Races in Municipality of Monroeville, Pennsylvania (PA) Detailed Stats
Ancestries, Foreign-born residents, place of birth

Recent posts about races in Municipality of Monroeville, Pennsylvania on our local forum with over 2,400,000 registered users:
 | Hispanics in Pitt (205 replies) |
6.4% of Municipality of Monroeville, PA residents are foreign-born (3.6% born in Asia, 1.9% born in Europe), which is 8.7% less than the foreign-born rate of 7.0% across the entire state of Pennsylvania.
Race distribution in Municipality of Monroeville

- 24,97185.1%White alone
- 2,4258.3%Black alone
- 1,2924.4%Asian alone
- 3361.1%Two or more races
- 2250.8%Hispanic
- 500.2%Other race alone
- 390.1%American Indian alone
- 110.04%Native Hawaiian and Other
Pacific Islander alone
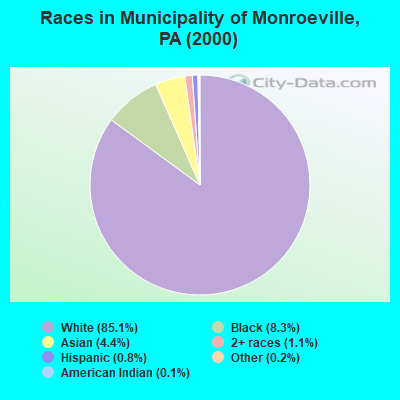
2000
2022
-
- 10,322,45584.1%White alone
- 1,202,4379.8%Black alone
- 394,0883.2%Hispanic
- 218,2961.8%Asian alone
- 113,0970.9%Two or more races
- 13,0860.1%Other race alone
- 14,9040.1%American Indian alone
- 2,6910.02%Native Hawaiian and Other
Pacific Islander alone

-
- 9,487,22873.1%White alone
- 1,311,58110.1%Black alone
- 1,115,9978.6%Hispanic
- 493,9423.8%Two or more races
- 487,1243.8%Asian alone
- 63,5820.5%Other race alone
- 10,1300.08%American Indian alone
- 2,4240.02%Native Hawaiian and Other
Pacific Islander alone

Income and house value in Municipality of Monroeville
- Median household income in 2022
- $83,946White non-Hispanic householders
- $73,057Black householders
- $89,152American Indian and Alaska Native householders
- $143,117Asian householders
- $66,871Some other race householders
- $103,573Two or more races householders
- $96,210Hispanic or Latino race householders
- Median 2022 house value
- $243,206White Non-Hispanic householders
- $227,806Black or African American householders
- $280,642American Indian or Alaska Native householders
- $369,322Asian householders
- $238,958Native Hawaiian and other Pacific Islander householders
- $311,176Two or more races householders
- $211,345Hispanic or Latino householders
Household income for White non-Hispanic householders

Household income for Black householders

Household income for American Indian and Alaska Native householders

Household income for Asian householders

Household income for Native Hawaiian and other Pacific Islander householders

Household income for Two or more races householders

Household income for Hispanic or Latino race householders

Foreign-born residents in Municipality of Monroeville
1,890 residents are foreign born (3.6% Asia, 1.9% Europe).
| This city: | 6.4% |
| Pennsylvania: | 4.1% |
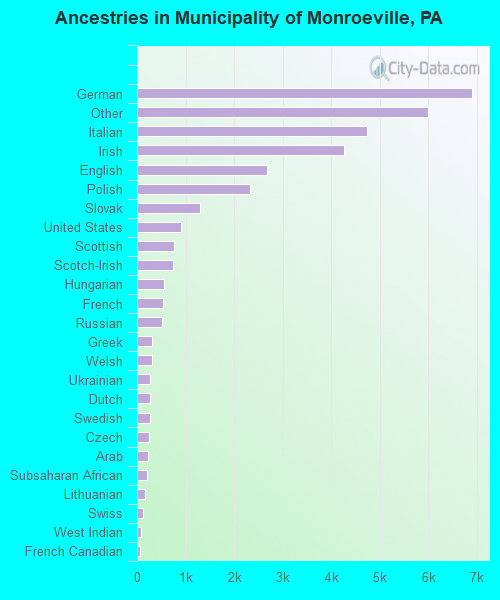
Ancestries in Municipality of Monroeville

- 6,91119.8%German
- 6,00317.2%Other
- 4,73513.6%Italian
- 4,26512.2%Irish
- 2,6797.7%English
- 2,3306.7%Polish
- 1,2973.7%Slovak
- 9072.6%United States
- 7532.2%Scottish
- 7342.1%Scotch-Irish
- 5651.6%Hungarian
- 5271.5%French
- 5231.5%Russian
- 3120.9%Greek
- 3080.9%Welsh
- 2680.8%Ukrainian
- 2630.8%Dutch
- 2580.7%Swedish
- 2380.7%Czech
- 2240.6%Arab
- 2140.6%Subsaharan African
- 1630.5%Lithuanian
- 1270.4%Swiss
- 870.2%West Indian
- 630.2%French Canadian
- 430.1%Norwegian
- 350.1%Danish
- 170.05%Portuguese
Zip codes: 15146.