Races in Mountain Home, Idaho (ID) Detailed Stats
Data:
Races - White alone (%)
Races - White alone (% change since 2000)
Races - Black alone (%)
Races - Black alone (% change since 2000)
Races - American Indian alone (%)
Races - American Indian alone (% change since 2000)
Races - Asian alone (%)
Races - Asian alone (% change since 2000)
Races - Hispanic (%)
Races - Hispanic (% change since 2000)
Races - Native Hawaiian and Other Pacific Islander alone (%)
Races - Native Hawaiian and Other Pacific Islander alone (% change since 2000)
Races - Two or more races(%)
Races - Two or more races(% change since 2000)
Races - Other race alone (%)
Races - Other race alone (% change since 2000)
Racial diversity
Place of birth - Born in state of residence (%)
Place of birth - Born in state of residence (%) - White
Place of birth - Born in state of residence (%) - Black or African American
Place of birth - Born in state of residence (%) - Asian
Place of birth - Born in state of residence (%) - Hispanic or Latino
Place of birth - Born in state of residence (%) - American Indian and Alaska Native
Place of birth - Born in state of residence (%) - Multirace
Place of birth - Born in state of residence (%) - Other Race
Place of birth - Born in other state (%)
Place of birth - Born in other state (%) - White
Place of birth - Born in other state (%) - Black or African American
Place of birth - Born in other state (%) - Asian
Place of birth - Born in other state (%) - Hispanic or Latino
Place of birth - Born in other state (%) - American Indian and Alaska Native
Place of birth - Born in other state (%) - Multirace
Place of birth - Born in other state (%) - Other Race
Place of birth - Native, outside of US (%)
Place of birth - Native, outside of US (%) - White
Place of birth - Native, outside of US (%) - Black or African American
Place of birth - Native, outside of US (%) - Asian
Place of birth - Native, outside of US (%) - Hispanic or Latino
Place of birth - Native, outside of US (%) - American Indian and Alaska Native
Place of birth - Native, outside of US (%) - Multirace
Place of birth - Native, outside of US (%) - Other Race
Place of birth - Foreign born (%)
Place of birth - Foreign born (%) - White
Place of birth - Foreign born (%) - Black or African American
Place of birth - Foreign born (%) - Asian
Place of birth - Foreign born (%) - Hispanic or Latino
Place of birth - Foreign born (%) - American Indian and Alaska Native
Place of birth - Foreign born (%) - Multirace
Place of birth - Foreign born (%) - Other Race
Residents speaking English at home (%)
Residents speaking English at home - Born in the United States (%)
Residents speaking English at home - Native, born elsewhere (%)
Residents speaking English at home - Foreign born (%)
Residents speaking Spanish at home (%)
Residents speaking Spanish at home - Born in the United States (%)
Residents speaking Spanish at home - Native, born elsewhere (%)
Residents speaking Spanish at home - Foreign born (%)
Residents speaking other language at home (%)
Residents speaking other language at home - Born in the United States (%)
Residents speaking other language at home - Native, born elsewhere (%)
Residents speaking other language at home - Foreign born (%)
Marital status - Never married (%)
Marital status - Now married (%)
Marital status - Separated (%)
Marital status - Widowed (%)
Marital status - Divorced (%)
Ancestries Reported - Arab (%)
Ancestries Reported - Czech (%)
Ancestries Reported - Danish (%)
Ancestries Reported - Dutch (%)
Ancestries Reported - English (%)
Ancestries Reported - French (%)
Ancestries Reported - French Canadian (%)
Ancestries Reported - German (%)
Ancestries Reported - Greek (%)
Ancestries Reported - Hungarian (%)
Ancestries Reported - Irish (%)
Ancestries Reported - Italian (%)
Ancestries Reported - Lithuanian (%)
Ancestries Reported - Norwegian (%)
Ancestries Reported - Polish (%)
Ancestries Reported - Portuguese (%)
Ancestries Reported - Russian (%)
Ancestries Reported - Scotch-Irish (%)
Ancestries Reported - Scottish (%)
Ancestries Reported - Slovak (%)
Ancestries Reported - Subsaharan African (%)
Ancestries Reported - Swedish (%)
Ancestries Reported - Swiss (%)
Ancestries Reported - Ukrainian (%)
Ancestries Reported - United States (%)
Ancestries Reported - Welsh (%)
Ancestries Reported - West Indian (%)
Ancestries Reported - Other (%)
Geographical mobility - Same house 1 year ago (%)
Geographical mobility - Same house 1 year ago (%) - White
Geographical mobility - Same house 1 year ago (%) - Black or African American
Geographical mobility - Same house 1 year ago (%) - Asian
Geographical mobility - Same house 1 year ago (%) - Hispanic or Latino
Geographical mobility - Same house 1 year ago (%) - American Indian and Alaska Native
Geographical mobility - Same house 1 year ago (%) - Multirace
Geographical mobility - Same house 1 year ago (%) - Other Race
Geographical mobility - Moved within same county (%)
Geographical mobility - Moved within same county (%) - White
Geographical mobility - Moved within same county (%) - Black or African American
Geographical mobility - Moved within same county (%) - Asian
Geographical mobility - Moved within same county (%) - Hispanic or Latino
Geographical mobility - Moved within same county (%) - American Indian and Alaska Native
Geographical mobility - Moved within same county (%) - Multirace
Geographical mobility - Moved within same county (%) - Other Race
Geographical mobility - Moved from different county within same state (%)
Geographical mobility - Moved from different county within same state (%) - White
Geographical mobility - Moved from different county within same state (%) - Black or African American
Geographical mobility - Moved from different county within same state (%) - Asian
Geographical mobility - Moved from different county within same state (%) - Hispanic or Latino
Geographical mobility - Moved from different county within same state (%) - American Indian and Alaska Native
Geographical mobility - Moved from different county within same state (%) - Multirace
Geographical mobility - Moved from different county within same state (%) - Other Race
Geographical mobility - Moved from different state (%)
Geographical mobility - Moved from different state (%) - White
Geographical mobility - Moved from different state (%) - Black or African American
Geographical mobility - Moved from different state (%) - Asian
Geographical mobility - Moved from different state (%) - Hispanic or Latino
Geographical mobility - Moved from different state (%) - American Indian and Alaska Native
Geographical mobility - Moved from different state (%) - Multirace
Geographical mobility - Moved from different state (%) - Other Race
Geographical mobility - Moved from abroad (%)
Geographical mobility - Moved from abroad (%) - White
Geographical mobility - Moved from abroad (%) - Black or African American
Geographical mobility - Moved from abroad (%) - Asian
Geographical mobility - Moved from abroad (%) - Hispanic or Latino
Geographical mobility - Moved from abroad (%) - American Indian and Alaska Native
Geographical mobility - Moved from abroad (%) - Multirace
Geographical mobility - Moved from abroad (%) - Other Race
Place of birth for the foreign-born population - Ireland (%)
Place of birth for the foreign-born population - Denmark (%)
Place of birth for the foreign-born population - Norway (%)
Place of birth for the foreign-born population - Sweden (%)
Place of birth for the foreign-born population - United Kingdom (%)
Place of birth for the foreign-born population - England (%)
Place of birth for the foreign-born population - Scotland (%)
Place of birth for the foreign-born population - Other Northern Europe (%)
Place of birth for the foreign-born population - Austria (%)
Place of birth for the foreign-born population - Belgium (%)
Place of birth for the foreign-born population - France (%)
Place of birth for the foreign-born population - Germany (%)
Place of birth for the foreign-born population - Netherlands (%)
Place of birth for the foreign-born population - Switzerland (%)
Place of birth for the foreign-born population - Other Western Europe (%)
Place of birth for the foreign-born population - Greece (%)
Place of birth for the foreign-born population - Italy (%)
Place of birth for the foreign-born population - Portugal (%)
Place of birth for the foreign-born population - Spain (%)
Place of birth for the foreign-born population - Other Southern Europe (%)
Place of birth for the foreign-born population - Albania (%)
Place of birth for the foreign-born population - Belarus (%)
Place of birth for the foreign-born population - Bosnia and Herzegovina (%)
Place of birth for the foreign-born population - Bulgaria (%)
Place of birth for the foreign-born population - Croatia (%)
Place of birth for the foreign-born population - Czechoslovakia (%)
Place of birth for the foreign-born population - Hungary (%)
Place of birth for the foreign-born population - Latvia (%)
Place of birth for the foreign-born population - Lithuania (%)
Place of birth for the foreign-born population - North Macedonia (Macedonia) (%)
Place of birth for the foreign-born population - Moldova (%)
Place of birth for the foreign-born population - Poland (%)
Place of birth for the foreign-born population - Romania (%)
Place of birth for the foreign-born population - Russia (%)
Place of birth for the foreign-born population - Serbia (%)
Place of birth for the foreign-born population - Ukraine (%)
Place of birth for the foreign-born population - Other Eastern Europe (%)
Place of birth for the foreign-born population - China (%)
Place of birth for the foreign-born population - Hong Kong (%)
Place of birth for the foreign-born population - Taiwan (%)
Place of birth for the foreign-born population - Japan (%)
Place of birth for the foreign-born population - Korea (%)
Place of birth for the foreign-born population - Other Eastern Asia (%)
Place of birth for the foreign-born population - Afghanistan (%)
Place of birth for the foreign-born population - Bangladesh (%)
Place of birth for the foreign-born population - India (%)
Place of birth for the foreign-born population - Iran (%)
Place of birth for the foreign-born population - Kazakhstan (%)
Place of birth for the foreign-born population - Nepal (%)
Place of birth for the foreign-born population - Pakistan (%)
Place of birth for the foreign-born population - Sri Lanka (%)
Place of birth for the foreign-born population - Uzbekistan (%)
Place of birth for the foreign-born population - Other South Central Asia (%)
Place of birth for the foreign-born population - Burma (%)
Place of birth for the foreign-born population - Cambodia (%)
Place of birth for the foreign-born population - Indonesia (%)
Place of birth for the foreign-born population - Laos (%)
Place of birth for the foreign-born population - Malaysia (%)
Place of birth for the foreign-born population - Philippines (%)
Place of birth for the foreign-born population - Singapore (%)
Place of birth for the foreign-born population - Thailand (%)
Place of birth for the foreign-born population - Vietnam (%)
Place of birth for the foreign-born population - Other South Eastern Asia (%)
Place of birth for the foreign-born population - Armenia (%)
Place of birth for the foreign-born population - Iraq (%)
Place of birth for the foreign-born population - Israel (%)
Place of birth for the foreign-born population - Jordan (%)
Place of birth for the foreign-born population - Kuwait (%)
Place of birth for the foreign-born population - Lebanon (%)
Place of birth for the foreign-born population - Saudi Arabia (%)
Place of birth for the foreign-born population - Syria (%)
Place of birth for the foreign-born population - Turkey (%)
Place of birth for the foreign-born population - Yemen (%)
Place of birth for the foreign-born population - Other Western Asia (%)
Place of birth for the foreign-born population - Eritrea (%)
Place of birth for the foreign-born population - Ethiopia (%)
Place of birth for the foreign-born population - Kenya (%)
Place of birth for the foreign-born population - Somalia (%)
Place of birth for the foreign-born population - Uganda (%)
Place of birth for the foreign-born population - Zimbabwe (%)
Place of birth for the foreign-born population - Other Eastern Africa (%)
Place of birth for the foreign-born population - Cameroon (%)
Place of birth for the foreign-born population - Congo (%)
Place of birth for the foreign-born population - Democratic Republic of Congo (Zaire) (%)
Place of birth for the foreign-born population - Other Middle Africa (%)
Place of birth for the foreign-born population - Egypt (%)
Place of birth for the foreign-born population - Morocco (%)
Place of birth for the foreign-born population - Sudan (%)
Place of birth for the foreign-born population - Other Northern Africa (%)
Place of birth for the foreign-born population - South Africa (%)
Place of birth for the foreign-born population - Other Southern Africa (%)
Place of birth for the foreign-born population - Cabo Verde (%)
Place of birth for the foreign-born population - Ghana (%)
Place of birth for the foreign-born population - Liberia (%)
Place of birth for the foreign-born population - Nigeria (%)
Place of birth for the foreign-born population - Senegal (%)
Place of birth for the foreign-born population - Sierra Leone (%)
Place of birth for the foreign-born population - Other Western Africa (%)
Place of birth for the foreign-born population - Australia (%)
Place of birth for the foreign-born population - New Zealand (%)
Place of birth for the foreign-born population - Fiji (%)
Place of birth for the foreign-born population - Micronesia (%)
Place of birth for the foreign-born population - Bahamas (%)
Place of birth for the foreign-born population - Barbados (%)
Place of birth for the foreign-born population - Cuba (%)
Place of birth for the foreign-born population - Dominica (%)
Place of birth for the foreign-born population - Dominican Republic (%)
Place of birth for the foreign-born population - Grenada (%)
Place of birth for the foreign-born population - Haiti (%)
Place of birth for the foreign-born population - Jamaica (%)
Place of birth for the foreign-born population - St. Vincent and the Grenadines (%)
Place of birth for the foreign-born population - Trinidad and Tobago (%)
Place of birth for the foreign-born population - West Indies (%)
Place of birth for the foreign-born population - Other Caribbean (%)
Place of birth for the foreign-born population - Belize (%)
Place of birth for the foreign-born population - Costa Rica (%)
Place of birth for the foreign-born population - El Salvador (%)
Place of birth for the foreign-born population - Guatemala (%)
Place of birth for the foreign-born population - Honduras (%)
Place of birth for the foreign-born population - Mexico (%)
Place of birth for the foreign-born population - Nicaragua (%)
Place of birth for the foreign-born population - Panama (%)
Place of birth for the foreign-born population - Other Central America (%)
Place of birth for the foreign-born population - Argentina (%)
Place of birth for the foreign-born population - Bolivia (%)
Place of birth for the foreign-born population - Brazil (%)
Place of birth for the foreign-born population - Chile (%)
Place of birth for the foreign-born population - Colombia (%)
Place of birth for the foreign-born population - Ecuador (%)
Place of birth for the foreign-born population - Guyana (%)
Place of birth for the foreign-born population - Peru (%)
Place of birth for the foreign-born population - Uruguay (%)
Place of birth for the foreign-born population - Venezuela (%)
Place of birth for the foreign-born population - Other South America (%)
Place of birth for the foreign-born population - Canada (%)
Place of birth for the foreign-born population - Other Northern America (%)
Place of birth for the foreign-born population - Other (%)
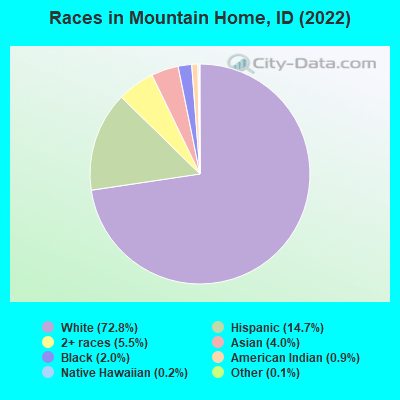
According to 2022 data, the most numerous races in Mountain Home, ID are White alone (12,193 residents), Hispanic (2,469 residents), and Two or more races (924 residents). 87.2% of Mountain Home residents speak English at home. 8.7% of Mountain Home, ID residents are foreign-born (3.6% born in Asia, 3.0% born in Latin America, 2.1% born in Europe), which is 42.8% greater than the foreign-born rate of 5.0% across the entire state of Idaho.
Race distribution in Mountain Home
2000 2022
1,139,291 88.0% White alone 101,690 7.9% Hispanic 18,261 1.4% Two or more races 15,789 1.2% American Indian alone 11,641 0.9% Asian alone 4,889 0.4% Black alone 1,192 0.09% Other race alone 1,200 0.09% Native Hawaiian and Other
1,531,219 79.0% White alone 261,921 13.5% Hispanic 81,112 4.2% Two or more races 25,174 1.3% Asian alone 15,825 0.8% American Indian alone 11,868 0.6% Black alone 8,752 0.5% Other race alone 3,162 0.2% Native Hawaiian and Other
Income and house value in Mountain Home Median household income in 2022 $57,813 White non-Hispanic householders$33,249 American Indian and Alaska Native householders$89,389 Asian householders$42,690 Some other race householders$35,689 Two or more races householders$34,598 Hispanic or Latino race householdersMedian 2022 house value $297,849 White Non-Hispanic householders$353,757 Black or African American householders$289,675 American Indian or Alaska Native householders over $1,000,000 Asian householdersover $1,000,000 Native Hawaiian and other Pacific Islander householders$324,332 Some other race householders$259,923 Two or more races householders$329,563 Hispanic or Latino householders
Median age by race in Mountain Home
32.8 Median age for White residents31.9 33.7 41.9 Median age for Black or African American residents43.6 40.6 49.5 Median age for American Indian / Alaska Native residents32.9 52.8 28.7 Median age for Asian residents26.3 39.5 -393,939,393.5 Median age for Native Hawaiian / Pacific Islander residents-355,119,825.4 -679,245,282.3 31.1 Median age for Other race residents32.8 28.2 24.5 Median age for Two or more races residents29.2 21.4 33.1 Median age for White alone residents31.6 35.1 25.9 Median age for Hispanic or Latino residents30.1 22.7
Owner/renter occupied households by race in Mountain Home
House owners and renters - White residents 3,188 63.6% Owner occupied1,823 36.4% Renter occupiedHouse owners and renters - Black or African American residents 63 36.9% Owner occupied108 63.1% Renter occupiedHouse owners and renters - American Indian / Alaska Native residents 126 89.8% Owner occupied14 10.2% Renter occupiedHouse owners and renters - Asian residents 118 47.6% Owner occupied130 52.4% Renter occupiedHouse owners and renters - Native Hawaiian / Pacific Islander residents 21 100.0% Renter occupiedHouse owners and renters - Other race residents 120 75.5% Owner occupied39 24.5% Renter occupiedHouse owners and renters - Two or more races residents 549 59.8% Owner occupied369 40.2% Renter occupiedHouse owners and renters - White alone residents 3,159 64.7% Owner occupied1,724 35.3% Renter occupiedHouse owners and renters - Hispanic or Latino residents 552 69.0% Owner occupied248 31.0% Renter occupied
Language usage in Mountain Home
English speakers - Total 87.2% of residents of Mountain Home speak English at home.
6.8% of residents speak Spanish at home 519 49.6% Speak English very well528 50.4% Speak English less than very well6.0% of residents speak other language at home 873 94.0% Speak English very well56 6.0% Speak English less than very well
English speakers - Born in the United States 93.0% of residents of Mountain Home speak English at home.
3.9% of residents speak Spanish at home 230 60.1% Speak English very well153 39.9% Speak English less than very well3.1% of residents speak other language at home 303 100.0% Speak English very well
English speakers - Native, born elsewhere 98.0% of residents of Mountain Home speak English at home.
English speakers - Foreign-born 30.9% of residents of Mountain Home speak English at home.
30.9% of residents speak Spanish at home 133 27.5% Speak English very well350 72.5% Speak English less than very well38.0% of residents speak other language at home 535 90.1% Speak English very well59 9.9% Speak English less than very well
White (Caucasian) - Speak only English Native:
96.8% (10,842)Foreign-born:
78.6% (251)
White (Caucasian) - Speak another language Native:
3.1% (348)Foreign-born:
18.2% (58)
Black or African American - Speak only English Native:
90.5% (245)Foreign-born:
59.6% (17)
Black or African American - Speak another language Native:
9.0% (24)Foreign-born:
43.1% (12)
American Indian / Alaska Native - Speak another language Native:
21.8% (39)Foreign-born:
98.9% (285)
Asian - Speak only English Native:
100.0% (30)Foreign-born:
18.1% (85)
Other race - Speak only English Native:
43.4% (246)Foreign-born:
22.6% (57)
Other race - Speak another language Native:
56.1% (319)Foreign-born:
78.7% (198)
Two or more races - Speak only English Native:
89.4% (1,517)Foreign-born:
26.7% (78)
Two or more races - Speak another language Native:
8.3% (141)Foreign-born:
77.7% (227)
White alone - Speak only English Native:
96.6% (10,644)Foreign-born:
62.8% (272)
White alone - Speak another language Native:
3.4% (379)Foreign-born:
21.4% (93)
Hispanic or Latino - Speak only English Native:
72.2% (1,178)Foreign-born:
16.7% (88)
Hispanic or Latino - Speak another language Native:
28.2% (459)Foreign-born:
84.3% (446)
Foreign-born residents in Mountain Home 1,465 residents are foreign born (3.6% Asia , 3.0% Latin America , 2.1% Europe ).
Marital status for residents in Mountain Home Marital status - White (Caucasian) population 15 years and over
Males 26.5% Never married48.9% Now married1.1% Separated2.5% Widowed21.0% DivorcedFemales 22.5% Never married46.8% Now married1.6% Separated11.1% Widowed18.0% DivorcedWomen who gave birth in the past 12 months Now married:
100.0% (186)Unmarried:
0.0% (0)
Women who did not give birth in the past 12 months Now married:
46.9% (1,226)Unmarried:
53.1% (1,387)
Marital status - Black or African American population 15 years and over
Males 30.1% Never married36.3% Now married0.0% Separated25.7% Widowed8.0% DivorcedFemales 61.2% Never married26.2% Now married0.0% Separated12.1% Widowed0.5% DivorcedWomen who did not give birth in the past 12 months Now married:
29.8% (53)Unmarried:
70.2% (124)
Marital status - American Indian / Alaska Native population 15 years and over
Males 20.9% Never married37.4% Now married0.0% Separated10.1% Widowed31.7% DivorcedFemales 13.3% Never married10.3% Now married0.0% Separated16.4% Widowed60.0% DivorcedWomen who did not give birth in the past 12 months Now married:
37.0% (19)Unmarried:
63.0% (33)
Marital status - Asian population 15 years and over
Males 56.6% Never married34.8% Now married0.0% Separated0.0% Widowed8.6% DivorcedFemales 6.3% Never married77.8% Now married13.0% Separated0.0% Widowed2.9% DivorcedWomen who did not give birth in the past 12 months Now married:
92.5% (169)Unmarried:
7.5% (14)
Marital status - Other race population 15 years and over
Males 34.5% Never married62.6% Now married0.0% Separated0.0% Widowed2.9% DivorcedFemales 30.6% Never married63.5% Now married0.0% Separated0.0% Widowed5.9% DivorcedWomen who did not give birth in the past 12 months Now married:
59.3% (72)Unmarried:
40.7% (50)
Marital status - Two or more races population 15 years and over
Males 62.0% Never married25.6% Now married0.0% Separated0.0% Widowed12.4% DivorcedFemales 19.4% Never married46.9% Now married7.2% Separated15.4% Widowed11.1% DivorcedWomen who gave birth in the past 12 months Now married:
100.0% (65)Unmarried:
0.0% (0)
Women who did not give birth in the past 12 months Now married:
51.2% (263)Unmarried:
48.8% (251)
Marital status - White alone, not Hispanic / Latino population 15 years and over
Males 26.9% Never married48.1% Now married1.2% Separated2.6% Widowed21.3% DivorcedFemales 21.4% Never married46.9% Now married1.7% Separated11.6% Widowed18.4% DivorcedWomen who gave birth in the past 12 months Now married:
100.0% (107)Unmarried:
0.0% (0)
Women who did not give birth in the past 12 months Now married:
48.9% (1,242)Unmarried:
51.1% (1,296)
Marital status - Hispanic or Latino population 15 years and over
Males 29.8% Never married63.3% Now married0.0% Separated0.0% Widowed6.9% DivorcedFemales 29.4% Never married46.0% Now married3.1% Separated5.5% Widowed16.0% DivorcedWomen who gave birth in the past 12 months Now married:
100.0% (86)Unmarried:
0.0% (0)
Women who did not give birth in the past 12 months Now married:
48.4% (314)Unmarried:
51.6% (335)
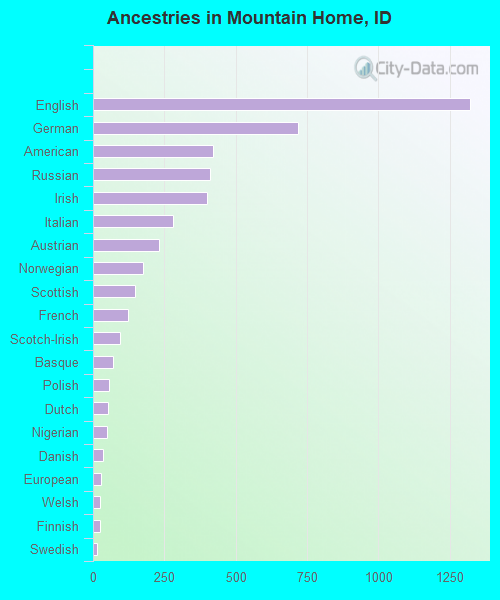
Ancestries in Mountain Home
1,322 18.1% English717 9.8% German420 5.8% American410 5.6% Russian398 5.5% Irish281 3.9% Italian230 3.2% Austrian177 2.4% Norwegian147 2.0% Scottish124 1.7% French94 1.3% Scotch-Irish71 1.0% Basque57 0.8% Polish51 0.7% Dutch50 0.7% Nigerian36 0.5% Danish29 0.4% European26 0.4% Welsh25 0.3% Finnish15 0.2% Swedish11 0.2% Swiss10 0.1% French Canadian9 0.1% Trinidadian and Tobagonian6 0.08% Portuguese4 0.05% African3 0.04% Belgian
Geographical mobility in Mountain Home Same house 1 year ago 9,785 80.2% White (Caucasian)263 74.0% Black or African American336 83.7% American Indian / Alaska Native556 79.0% Asian23 100.0% Native Hawaiian / Pacific Islander776 82.4% Other race1,742 78.8% Two or more races9,671 79.9% White alone, not Hispanic / Latino1,993 81.9% Hispanic or LatinoMoved within same county 1,322 10.8% White / Caucasian53 15.0% Black or African American1 0.3% American Indian / Alaska Native63 6.7% Other race338 15.3% Two or more races1,348 11.1% White alone, not Hispanic / Latino214 8.8% Hispanic or LatinoMoved within same state 464 3.8% White / Caucasian38 10.6% Black or African American8 2.1% American Indian / Alaska Native79 8.4% Other race7 0.3% Two or more races472 3.9% White alone, not Hispanic / Latino81 3.3% Hispanic or LatinoMoved from different state 416 3.4% White / Caucasian9 2.7% Black or African American9 2.3% American Indian / Alaska Native43 6.1% Asian77 3.5% Two or more races421 3.5% White alone, not Hispanic / LatinoMoved from abroad 213 1.7% White86 21.5% American Indian / Alaska Native182 25.8% Asian1 0.1% Two or more races190 1.6% White alone, not Hispanic / Latino90 3.7% Hispanic or Latino
Children Nativity (place of birth) in Mountain Home
Children under 6 years - Living with two parents Both parents native 601 100.0% NativeBoth parents foreign-born 230 100.0% NativeOne native, one foreign-born parent 96 100.0% NativeChildren under 6 years - Living with one parent Native parent 332 100.0% NativeForeign-born parent 9 100.0% NativeChildren 6 to 17 years - Living with two parents Both parents native 947 100.0% NativeBoth parents foreign-born 51 59.1% Native35 40.9% Foreign-bornOne native, one foreign-born parent 383 95.9% Native16 4.1% Foreign-bornChildren 6 to 17 years - Living with one parent Native parent 788 100.0% NativeForeign-born parent 250 51.1% Native239 48.9% Foreign-born
Grandparents responsible for own grandchildren in Mountain Home
Grandparents (30 to 59 years) White / Caucasian 43 42.9% Responsible for grandchildren58 57.1% Not responsible for grandchildrenBlack or African American 47 100.0% Responsible for grandchildrenAmerican Indian / Alaska Native 18 100.0% Not responsible for grandchildrenOther race 36 32.6% Responsible for grandchildren75 67.4% Not responsible for grandchildrenTwo or more races 5 100.0% Not responsible for grandchildrenWhite alone, not Hispanic / Latino 47 44.6% Responsible for grandchildren58 55.4% Not responsible for grandchildrenHispanic or Latino 42 40.3% Responsible for grandchildren62 59.7% Not responsible for grandchildrenGrandparents (60 years and over) White / Caucasian 146 86.6% Responsible for grandchildren23 13.4% Not responsible for grandchildrenAmerican Indian / Alaska Native 11 100.0% Not responsible for grandchildrenOther race 4 100.0% Responsible for grandchildrenWhite alone, not Hispanic / Latino 146 86.2% Responsible for grandchildren23 13.8% Not responsible for grandchildrenHispanic or Latino 6 48.2% Responsible for grandchildren6 51.8% Not responsible for grandchildren