Races in Mount Vernon, Virginia (VA) Detailed Stats
Data:
Races - White alone (%)
Races - White alone (% change since 2000)
Races - Black alone (%)
Races - Black alone (% change since 2000)
Races - American Indian alone (%)
Races - American Indian alone (% change since 2000)
Races - Asian alone (%)
Races - Asian alone (% change since 2000)
Races - Hispanic (%)
Races - Hispanic (% change since 2000)
Races - Native Hawaiian and Other Pacific Islander alone (%)
Races - Native Hawaiian and Other Pacific Islander alone (% change since 2000)
Races - Two or more races(%)
Races - Two or more races(% change since 2000)
Races - Other race alone (%)
Races - Other race alone (% change since 2000)
Racial diversity
Place of birth - Born in state of residence (%)
Place of birth - Born in state of residence (%) - White
Place of birth - Born in state of residence (%) - Black or African American
Place of birth - Born in state of residence (%) - Asian
Place of birth - Born in state of residence (%) - Hispanic or Latino
Place of birth - Born in state of residence (%) - American Indian and Alaska Native
Place of birth - Born in state of residence (%) - Multirace
Place of birth - Born in state of residence (%) - Other Race
Place of birth - Born in other state (%)
Place of birth - Born in other state (%) - White
Place of birth - Born in other state (%) - Black or African American
Place of birth - Born in other state (%) - Asian
Place of birth - Born in other state (%) - Hispanic or Latino
Place of birth - Born in other state (%) - American Indian and Alaska Native
Place of birth - Born in other state (%) - Multirace
Place of birth - Born in other state (%) - Other Race
Place of birth - Native, outside of US (%)
Place of birth - Native, outside of US (%) - White
Place of birth - Native, outside of US (%) - Black or African American
Place of birth - Native, outside of US (%) - Asian
Place of birth - Native, outside of US (%) - Hispanic or Latino
Place of birth - Native, outside of US (%) - American Indian and Alaska Native
Place of birth - Native, outside of US (%) - Multirace
Place of birth - Native, outside of US (%) - Other Race
Place of birth - Foreign born (%)
Place of birth - Foreign born (%) - White
Place of birth - Foreign born (%) - Black or African American
Place of birth - Foreign born (%) - Asian
Place of birth - Foreign born (%) - Hispanic or Latino
Place of birth - Foreign born (%) - American Indian and Alaska Native
Place of birth - Foreign born (%) - Multirace
Place of birth - Foreign born (%) - Other Race
Residents speaking English at home (%)
Residents speaking English at home - Born in the United States (%)
Residents speaking English at home - Native, born elsewhere (%)
Residents speaking English at home - Foreign born (%)
Residents speaking Spanish at home (%)
Residents speaking Spanish at home - Born in the United States (%)
Residents speaking Spanish at home - Native, born elsewhere (%)
Residents speaking Spanish at home - Foreign born (%)
Residents speaking other language at home (%)
Residents speaking other language at home - Born in the United States (%)
Residents speaking other language at home - Native, born elsewhere (%)
Residents speaking other language at home - Foreign born (%)
Marital status - Never married (%)
Marital status - Now married (%)
Marital status - Separated (%)
Marital status - Widowed (%)
Marital status - Divorced (%)
Ancestries Reported - Arab (%)
Ancestries Reported - Czech (%)
Ancestries Reported - Danish (%)
Ancestries Reported - Dutch (%)
Ancestries Reported - English (%)
Ancestries Reported - French (%)
Ancestries Reported - French Canadian (%)
Ancestries Reported - German (%)
Ancestries Reported - Greek (%)
Ancestries Reported - Hungarian (%)
Ancestries Reported - Irish (%)
Ancestries Reported - Italian (%)
Ancestries Reported - Lithuanian (%)
Ancestries Reported - Norwegian (%)
Ancestries Reported - Polish (%)
Ancestries Reported - Portuguese (%)
Ancestries Reported - Russian (%)
Ancestries Reported - Scotch-Irish (%)
Ancestries Reported - Scottish (%)
Ancestries Reported - Slovak (%)
Ancestries Reported - Subsaharan African (%)
Ancestries Reported - Swedish (%)
Ancestries Reported - Swiss (%)
Ancestries Reported - Ukrainian (%)
Ancestries Reported - United States (%)
Ancestries Reported - Welsh (%)
Ancestries Reported - West Indian (%)
Ancestries Reported - Other (%)
Geographical mobility - Same house 1 year ago (%)
Geographical mobility - Same house 1 year ago (%) - White
Geographical mobility - Same house 1 year ago (%) - Black or African American
Geographical mobility - Same house 1 year ago (%) - Asian
Geographical mobility - Same house 1 year ago (%) - Hispanic or Latino
Geographical mobility - Same house 1 year ago (%) - American Indian and Alaska Native
Geographical mobility - Same house 1 year ago (%) - Multirace
Geographical mobility - Same house 1 year ago (%) - Other Race
Geographical mobility - Moved within same county (%)
Geographical mobility - Moved within same county (%) - White
Geographical mobility - Moved within same county (%) - Black or African American
Geographical mobility - Moved within same county (%) - Asian
Geographical mobility - Moved within same county (%) - Hispanic or Latino
Geographical mobility - Moved within same county (%) - American Indian and Alaska Native
Geographical mobility - Moved within same county (%) - Multirace
Geographical mobility - Moved within same county (%) - Other Race
Geographical mobility - Moved from different county within same state (%)
Geographical mobility - Moved from different county within same state (%) - White
Geographical mobility - Moved from different county within same state (%) - Black or African American
Geographical mobility - Moved from different county within same state (%) - Asian
Geographical mobility - Moved from different county within same state (%) - Hispanic or Latino
Geographical mobility - Moved from different county within same state (%) - American Indian and Alaska Native
Geographical mobility - Moved from different county within same state (%) - Multirace
Geographical mobility - Moved from different county within same state (%) - Other Race
Geographical mobility - Moved from different state (%)
Geographical mobility - Moved from different state (%) - White
Geographical mobility - Moved from different state (%) - Black or African American
Geographical mobility - Moved from different state (%) - Asian
Geographical mobility - Moved from different state (%) - Hispanic or Latino
Geographical mobility - Moved from different state (%) - American Indian and Alaska Native
Geographical mobility - Moved from different state (%) - Multirace
Geographical mobility - Moved from different state (%) - Other Race
Geographical mobility - Moved from abroad (%)
Geographical mobility - Moved from abroad (%) - White
Geographical mobility - Moved from abroad (%) - Black or African American
Geographical mobility - Moved from abroad (%) - Asian
Geographical mobility - Moved from abroad (%) - Hispanic or Latino
Geographical mobility - Moved from abroad (%) - American Indian and Alaska Native
Geographical mobility - Moved from abroad (%) - Multirace
Geographical mobility - Moved from abroad (%) - Other Race
Place of birth for the foreign-born population - Ireland (%)
Place of birth for the foreign-born population - Denmark (%)
Place of birth for the foreign-born population - Norway (%)
Place of birth for the foreign-born population - Sweden (%)
Place of birth for the foreign-born population - United Kingdom (%)
Place of birth for the foreign-born population - England (%)
Place of birth for the foreign-born population - Scotland (%)
Place of birth for the foreign-born population - Other Northern Europe (%)
Place of birth for the foreign-born population - Austria (%)
Place of birth for the foreign-born population - Belgium (%)
Place of birth for the foreign-born population - France (%)
Place of birth for the foreign-born population - Germany (%)
Place of birth for the foreign-born population - Netherlands (%)
Place of birth for the foreign-born population - Switzerland (%)
Place of birth for the foreign-born population - Other Western Europe (%)
Place of birth for the foreign-born population - Greece (%)
Place of birth for the foreign-born population - Italy (%)
Place of birth for the foreign-born population - Portugal (%)
Place of birth for the foreign-born population - Spain (%)
Place of birth for the foreign-born population - Other Southern Europe (%)
Place of birth for the foreign-born population - Albania (%)
Place of birth for the foreign-born population - Belarus (%)
Place of birth for the foreign-born population - Bosnia and Herzegovina (%)
Place of birth for the foreign-born population - Bulgaria (%)
Place of birth for the foreign-born population - Croatia (%)
Place of birth for the foreign-born population - Czechoslovakia (%)
Place of birth for the foreign-born population - Hungary (%)
Place of birth for the foreign-born population - Latvia (%)
Place of birth for the foreign-born population - Lithuania (%)
Place of birth for the foreign-born population - North Macedonia (Macedonia) (%)
Place of birth for the foreign-born population - Moldova (%)
Place of birth for the foreign-born population - Poland (%)
Place of birth for the foreign-born population - Romania (%)
Place of birth for the foreign-born population - Russia (%)
Place of birth for the foreign-born population - Serbia (%)
Place of birth for the foreign-born population - Ukraine (%)
Place of birth for the foreign-born population - Other Eastern Europe (%)
Place of birth for the foreign-born population - China (%)
Place of birth for the foreign-born population - Hong Kong (%)
Place of birth for the foreign-born population - Taiwan (%)
Place of birth for the foreign-born population - Japan (%)
Place of birth for the foreign-born population - Korea (%)
Place of birth for the foreign-born population - Other Eastern Asia (%)
Place of birth for the foreign-born population - Afghanistan (%)
Place of birth for the foreign-born population - Bangladesh (%)
Place of birth for the foreign-born population - India (%)
Place of birth for the foreign-born population - Iran (%)
Place of birth for the foreign-born population - Kazakhstan (%)
Place of birth for the foreign-born population - Nepal (%)
Place of birth for the foreign-born population - Pakistan (%)
Place of birth for the foreign-born population - Sri Lanka (%)
Place of birth for the foreign-born population - Uzbekistan (%)
Place of birth for the foreign-born population - Other South Central Asia (%)
Place of birth for the foreign-born population - Burma (%)
Place of birth for the foreign-born population - Cambodia (%)
Place of birth for the foreign-born population - Indonesia (%)
Place of birth for the foreign-born population - Laos (%)
Place of birth for the foreign-born population - Malaysia (%)
Place of birth for the foreign-born population - Philippines (%)
Place of birth for the foreign-born population - Singapore (%)
Place of birth for the foreign-born population - Thailand (%)
Place of birth for the foreign-born population - Vietnam (%)
Place of birth for the foreign-born population - Other South Eastern Asia (%)
Place of birth for the foreign-born population - Armenia (%)
Place of birth for the foreign-born population - Iraq (%)
Place of birth for the foreign-born population - Israel (%)
Place of birth for the foreign-born population - Jordan (%)
Place of birth for the foreign-born population - Kuwait (%)
Place of birth for the foreign-born population - Lebanon (%)
Place of birth for the foreign-born population - Saudi Arabia (%)
Place of birth for the foreign-born population - Syria (%)
Place of birth for the foreign-born population - Turkey (%)
Place of birth for the foreign-born population - Yemen (%)
Place of birth for the foreign-born population - Other Western Asia (%)
Place of birth for the foreign-born population - Eritrea (%)
Place of birth for the foreign-born population - Ethiopia (%)
Place of birth for the foreign-born population - Kenya (%)
Place of birth for the foreign-born population - Somalia (%)
Place of birth for the foreign-born population - Uganda (%)
Place of birth for the foreign-born population - Zimbabwe (%)
Place of birth for the foreign-born population - Other Eastern Africa (%)
Place of birth for the foreign-born population - Cameroon (%)
Place of birth for the foreign-born population - Congo (%)
Place of birth for the foreign-born population - Democratic Republic of Congo (Zaire) (%)
Place of birth for the foreign-born population - Other Middle Africa (%)
Place of birth for the foreign-born population - Egypt (%)
Place of birth for the foreign-born population - Morocco (%)
Place of birth for the foreign-born population - Sudan (%)
Place of birth for the foreign-born population - Other Northern Africa (%)
Place of birth for the foreign-born population - South Africa (%)
Place of birth for the foreign-born population - Other Southern Africa (%)
Place of birth for the foreign-born population - Cabo Verde (%)
Place of birth for the foreign-born population - Ghana (%)
Place of birth for the foreign-born population - Liberia (%)
Place of birth for the foreign-born population - Nigeria (%)
Place of birth for the foreign-born population - Senegal (%)
Place of birth for the foreign-born population - Sierra Leone (%)
Place of birth for the foreign-born population - Other Western Africa (%)
Place of birth for the foreign-born population - Australia (%)
Place of birth for the foreign-born population - New Zealand (%)
Place of birth for the foreign-born population - Fiji (%)
Place of birth for the foreign-born population - Micronesia (%)
Place of birth for the foreign-born population - Bahamas (%)
Place of birth for the foreign-born population - Barbados (%)
Place of birth for the foreign-born population - Cuba (%)
Place of birth for the foreign-born population - Dominica (%)
Place of birth for the foreign-born population - Dominican Republic (%)
Place of birth for the foreign-born population - Grenada (%)
Place of birth for the foreign-born population - Haiti (%)
Place of birth for the foreign-born population - Jamaica (%)
Place of birth for the foreign-born population - St. Vincent and the Grenadines (%)
Place of birth for the foreign-born population - Trinidad and Tobago (%)
Place of birth for the foreign-born population - West Indies (%)
Place of birth for the foreign-born population - Other Caribbean (%)
Place of birth for the foreign-born population - Belize (%)
Place of birth for the foreign-born population - Costa Rica (%)
Place of birth for the foreign-born population - El Salvador (%)
Place of birth for the foreign-born population - Guatemala (%)
Place of birth for the foreign-born population - Honduras (%)
Place of birth for the foreign-born population - Mexico (%)
Place of birth for the foreign-born population - Nicaragua (%)
Place of birth for the foreign-born population - Panama (%)
Place of birth for the foreign-born population - Other Central America (%)
Place of birth for the foreign-born population - Argentina (%)
Place of birth for the foreign-born population - Bolivia (%)
Place of birth for the foreign-born population - Brazil (%)
Place of birth for the foreign-born population - Chile (%)
Place of birth for the foreign-born population - Colombia (%)
Place of birth for the foreign-born population - Ecuador (%)
Place of birth for the foreign-born population - Guyana (%)
Place of birth for the foreign-born population - Peru (%)
Place of birth for the foreign-born population - Uruguay (%)
Place of birth for the foreign-born population - Venezuela (%)
Place of birth for the foreign-born population - Other South America (%)
Place of birth for the foreign-born population - Canada (%)
Place of birth for the foreign-born population - Other Northern America (%)
Place of birth for the foreign-born population - Other (%)
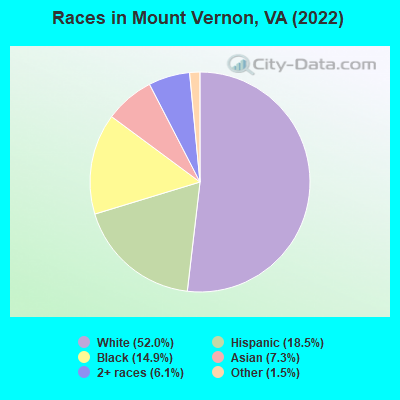
According to 2022 data, the most numerous races in Mount Vernon, VA are White alone (6,869 residents), Black alone (1,963 residents), and Hispanic (2,447 residents). 77.5% of Mount Vernon residents speak English at home. 20.9% of Mount Vernon, VA residents are foreign-born (7.6% born in Latin America, 6.0% born in Africa, 4.8% born in Asia, 2.3% born in Europe), which is 42.6% greater than the foreign-born rate of 12.0% across the entire state of Virginia.
Race distribution in Mount Vernon
2000 2022
4,965,637 70.2% White alone 1,376,378 19.4% Black alone 329,540 4.7% Hispanic 259,277 3.7% Asian alone 114,022 1.6% Two or more races 18,596 0.3% American Indian alone 11,685 0.2% Other race alone 3,380 0.05% Native Hawaiian and Other
5,095,130 58.7% White alone 1,594,785 18.4% Black alone 905,750 10.4% Hispanic 602,881 6.9% Asian alone 406,047 4.7% Two or more races 60,419 0.7% Other race alone 11,738 0.1% American Indian alone 6,869 0.08% Native Hawaiian and Other
Income and house value in Mount Vernon Median household income in 2022 $170,397 White non-Hispanic householders$128,305 Black householders$194,793 Asian householdersover $200,000 Some other race householders$139,605 Hispanic or Latino race householdersMedian 2022 house value $933,276 White Non-Hispanic householders$554,358 Black or African American householders$56,073 American Indian or Alaska Native householders $686,045 Asian householders$556,482 Some other race householders$567,952 Two or more races householders$593,015 Hispanic or Latino householders
Median age by race in Mount Vernon
49.2 Median age for White residents48.5 49.6 46.8 Median age for Black or African American residents39.1 49.2 -754,182,753.4 Median age for American Indian / Alaska Native residents-964,539,006.1 -669,005,847.3 41.5 Median age for Asian residents40.0 42.0 -666,666,666.0 Median age for Native Hawaiian / Pacific Islander residents-558,791,801.0 -584,518,166.9 39.2 Median age for Other race residents39.9 33.6 19.3 Median age for Two or more races residents12.8 34.1 51.6 Median age for White alone residents51.4 51.6 22.5 Median age for Hispanic or Latino residents12.1 33.5
Owner/renter occupied households by race in Mount Vernon
House owners and renters - White residents 2,667 85.9% Owner occupied438 14.1% Renter occupiedHouse owners and renters - Black or African American residents 358 44.1% Owner occupied454 55.9% Renter occupiedHouse owners and renters - Asian residents 190 85.0% Owner occupied34 15.0% Renter occupiedHouse owners and renters - Other race residents 84 55.6% Owner occupied67 44.4% Renter occupiedHouse owners and renters - Two or more races residents 366 67.3% Owner occupied178 32.7% Renter occupiedHouse owners and renters - White alone residents 2,602 87.4% Owner occupied375 12.6% Renter occupiedHouse owners and renters - Hispanic or Latino residents 375 58.8% Owner occupied262 41.2% Renter occupied
Language usage in Mount Vernon
English speakers - Total 77.5% of residents of Mount Vernon speak English at home.
10.5% of residents speak Spanish at home 822 64.1% Speak English very well460 35.9% Speak English less than very well12.4% of residents speak other language at home 1,145 75.7% Speak English very well367 24.3% Speak English less than very well
English speakers - Born in the United States 95.1% of residents of Mount Vernon speak English at home.
4.6% of residents speak Spanish at home 156 52.3% Speak English very well142 47.7% Speak English less than very well1.1% of residents speak other language at home 60 85.7% Speak English very well10 14.3% Speak English less than very well
English speakers - Native, born elsewhere 78.3% of residents of Mount Vernon speak English at home.
15.5% of residents speak Spanish at home 40 85.1% Speak English very well7 14.9% Speak English less than very well3.9% of residents speak other language at home 12 100.0% Speak English less than very well
English speakers - Foreign-born 26.1% of residents of Mount Vernon speak English at home.
30.1% of residents speak Spanish at home 477 57.3% Speak English very well356 42.7% Speak English less than very well44.8% of residents speak other language at home 952 76.8% Speak English very well288 23.2% Speak English less than very well
White (Caucasian) - Speak only English Native:
97.4% (6,307)Foreign-born:
34.3% (179)
White (Caucasian) - Speak another language Native:
3.7% (240)Foreign-born:
68.8% (359)
Black or African American - Speak only English Native:
81.5% (831)Foreign-born:
31.5% (288)
Black or African American - Speak another language Native:
20.0% (204)Foreign-born:
70.2% (642)
Asian - Speak only English Native:
85.7% (270)Foreign-born:
24.8% (154)
Asian - Speak another language Native:
11.1% (35)Foreign-born:
76.8% (475)
Other race - Speak only English Native:
81.0% (207)Foreign-born:
6.5% (14)
Other race - Speak another language Native:
30.5% (78)Foreign-born:
93.1% (196)
Two or more races - Speak only English Native:
87.7% (1,243)Foreign-born:
23.1% (121)
Two or more races - Speak another language Native:
11.3% (160)Foreign-born:
76.6% (400)
White alone - Speak only English Native:
97.3% (6,095)Foreign-born:
50.8% (182)
White alone - Speak another language Native:
3.0% (186)Foreign-born:
52.5% (188)
Hispanic or Latino - Speak only English Native:
78.5% (960)Foreign-born:
4.2% (34)
Hispanic or Latino - Speak another language Native:
27.2% (332)Foreign-born:
95.8% (783)
Foreign-born residents in Mount Vernon 2,763 residents are foreign born (7.6% Latin America , 6.0% Africa , 4.8% Asia , 2.3% Europe ).
This city:
20.9%Virginia:
12.6%
Marital status for residents in Mount Vernon Marital status - White (Caucasian) population 15 years and over
Males 20.5% Never married73.3% Now married0.2% Separated3.0% Widowed3.0% DivorcedFemales 20.0% Never married57.4% Now married1.3% Separated9.7% Widowed11.5% DivorcedWomen who gave birth in the past 12 months Now married:
100.0% (54)Unmarried:
0.0% (0)
Women who did not give birth in the past 12 months Now married:
53.0% (756)Unmarried:
47.0% (671)
Marital status - Black or African American population 15 years and over
Males 37.4% Never married46.1% Now married7.5% Separated0.0% Widowed8.9% DivorcedFemales 19.9% Never married43.4% Now married3.1% Separated8.3% Widowed25.3% DivorcedWomen who gave birth in the past 12 months Now married:
40.7% (33)Unmarried:
59.3% (47)
Women who did not give birth in the past 12 months Now married:
57.3% (194)Unmarried:
42.7% (144)
Marital status - Asian population 15 years and over
Males 19.1% Never married62.5% Now married1.4% Separated0.0% Widowed17.0% DivorcedFemales 8.6% Never married83.8% Now married0.0% Separated1.0% Widowed6.6% DivorcedWomen who gave birth in the past 12 months Now married:
100.0% (43)Unmarried:
0.0% (0)
Women who did not give birth in the past 12 months Now married:
76.0% (209)Unmarried:
24.0% (66)
Marital status - Other race population 15 years and over
Males 26.6% Never married68.4% Now married0.0% Separated0.0% Widowed5.1% DivorcedFemales 16.5% Never married78.7% Now married0.0% Separated0.0% Widowed4.7% DivorcedWomen who gave birth in the past 12 months Now married:
100.0% (44)Unmarried:
0.0% (0)
Women who did not give birth in the past 12 months Now married:
65.0% (48)Unmarried:
35.0% (26)
Marital status - Two or more races population 15 years and over
Males 26.6% Never married52.3% Now married4.5% Separated0.0% Widowed16.6% DivorcedFemales 37.0% Never married44.7% Now married2.3% Separated3.9% Widowed12.1% DivorcedWomen who did not give birth in the past 12 months Now married:
40.1% (162)Unmarried:
59.9% (242)
Marital status - White alone, not Hispanic / Latino population 15 years and over
Males 19.4% Never married74.2% Now married0.3% Separated2.8% Widowed3.3% DivorcedFemales 18.8% Never married57.9% Now married0.3% Separated10.7% Widowed12.2% DivorcedWomen who gave birth in the past 12 months Now married:
100.0% (45)Unmarried:
0.0% (0)
Women who did not give birth in the past 12 months Now married:
52.5% (680)Unmarried:
47.5% (614)
Marital status - Hispanic or Latino population 15 years and over
Males 25.1% Never married61.1% Now married2.7% Separated2.3% Widowed8.8% DivorcedFemales 30.0% Never married46.2% Now married6.1% Separated2.4% Widowed15.2% DivorcedWomen who gave birth in the past 12 months Now married:
100.0% (51)Unmarried:
0.0% (0)
Women who did not give birth in the past 12 months Now married:
42.9% (240)Unmarried:
57.1% (319)
Ancestries in Mount Vernon
482 6.7% Irish327 4.6% Italian312 4.4% Ghanaian305 4.3% European299 4.2% English298 4.2% German291 4.1% American234 3.3% Jamaican149 2.1% Ethiopian117 1.6% Scottish98 1.4% Greek91 1.3% Dutch88 1.2% Norwegian63 0.9% Northern European58 0.8% British46 0.6% African41 0.6% Polish38 0.5% Romanian33 0.5% Lithuanian33 0.5% Liberian33 0.5% Swedish29 0.4% Danish28 0.4% Moroccan28 0.4% Eastern European28 0.4% Scotch-Irish21 0.3% Syrian19 0.3% Austrian19 0.3% Czech17 0.2% Slovak13 0.2% Israeli12 0.2% French12 0.2% Haitian11 0.2% Finnish11 0.2% Scandinavian9 0.1% Russian7 0.10% Lebanese6 0.08% Guyanese5 0.07% Iranian5 0.07% Welsh
Geographical mobility in Mount Vernon Same house 1 year ago 6,559 89.3% White (Caucasian)1,634 84.2% Black or African American12 96.1% American Indian / Alaska Native876 88.7% Asian492 100.0% Other race2,000 92.4% Two or more races6,186 90.3% White alone, not Hispanic / Latino2,093 87.7% Hispanic or LatinoMoved within same county 389 5.3% White / Caucasian185 9.5% Black or African American46 4.7% Asian4 0.9% Other race251 3.7% White alone, not Hispanic / Latino206 8.6% Hispanic or LatinoMoved within same state 175 2.4% White / Caucasian14 0.7% Black or African American10 1.0% Asian23 1.0% Two or more races178 2.6% White alone, not Hispanic / Latino43 1.8% Hispanic or LatinoMoved from different state 204 2.8% White / Caucasian21 1.1% Black or African American29 2.9% Asian45 2.1% Two or more races209 3.1% White alone, not Hispanic / Latino21 0.9% Hispanic or LatinoMoved from abroad 19 0.3% White10 0.5% Black or African American25 2.5% Asian21 0.3% White alone, not Hispanic / Latino
Children Nativity (place of birth) in Mount Vernon
Children under 6 years - Living with two parents Both parents native 577 100.0% NativeBoth parents foreign-born 161 100.0% NativeOne native, one foreign-born parent 174 100.0% NativeChildren under 6 years - Living with one parent Native parent 108 100.0% NativeForeign-born parent 73 100.0% NativeChildren 6 to 17 years - Living with two parents Both parents native 1,077 97.4% Native28 2.6% Foreign-bornBoth parents foreign-born 132 59.4% Native90 40.6% Foreign-bornOne native, one foreign-born parent 299 100.0% NativeChildren 6 to 17 years - Living with one parent Native parent 72 100.0% NativeForeign-born parent 402 53.2% Native353 46.8% Foreign-born
Grandparents responsible for own grandchildren in Mount Vernon
Grandparents (30 to 59 years) White / Caucasian 5 100.0% Responsible for grandchildrenAsian 14 100.0% Not responsible for grandchildrenHispanic or Latino 10 100.0% Responsible for grandchildren
Grandparents (60 years and over) White / Caucasian 64 100.0% Not responsible for grandchildrenAsian 12 100.0% Responsible for grandchildrenHispanic or Latino 35 100.0% Not responsible for grandchildren