Races in Mount Prospect, Illinois (IL) Detailed Stats
Data:
Races - White alone (%)
Races - White alone (% change since 2000)
Races - Black alone (%)
Races - Black alone (% change since 2000)
Races - American Indian alone (%)
Races - American Indian alone (% change since 2000)
Races - Asian alone (%)
Races - Asian alone (% change since 2000)
Races - Hispanic (%)
Races - Hispanic (% change since 2000)
Races - Native Hawaiian and Other Pacific Islander alone (%)
Races - Native Hawaiian and Other Pacific Islander alone (% change since 2000)
Races - Two or more races(%)
Races - Two or more races(% change since 2000)
Races - Other race alone (%)
Races - Other race alone (% change since 2000)
Racial diversity
Place of birth - Born in state of residence (%)
Place of birth - Born in state of residence (%) - White
Place of birth - Born in state of residence (%) - Black or African American
Place of birth - Born in state of residence (%) - Asian
Place of birth - Born in state of residence (%) - Hispanic or Latino
Place of birth - Born in state of residence (%) - American Indian and Alaska Native
Place of birth - Born in state of residence (%) - Multirace
Place of birth - Born in state of residence (%) - Other Race
Place of birth - Born in other state (%)
Place of birth - Born in other state (%) - White
Place of birth - Born in other state (%) - Black or African American
Place of birth - Born in other state (%) - Asian
Place of birth - Born in other state (%) - Hispanic or Latino
Place of birth - Born in other state (%) - American Indian and Alaska Native
Place of birth - Born in other state (%) - Multirace
Place of birth - Born in other state (%) - Other Race
Place of birth - Native, outside of US (%)
Place of birth - Native, outside of US (%) - White
Place of birth - Native, outside of US (%) - Black or African American
Place of birth - Native, outside of US (%) - Asian
Place of birth - Native, outside of US (%) - Hispanic or Latino
Place of birth - Native, outside of US (%) - American Indian and Alaska Native
Place of birth - Native, outside of US (%) - Multirace
Place of birth - Native, outside of US (%) - Other Race
Place of birth - Foreign born (%)
Place of birth - Foreign born (%) - White
Place of birth - Foreign born (%) - Black or African American
Place of birth - Foreign born (%) - Asian
Place of birth - Foreign born (%) - Hispanic or Latino
Place of birth - Foreign born (%) - American Indian and Alaska Native
Place of birth - Foreign born (%) - Multirace
Place of birth - Foreign born (%) - Other Race
Residents speaking English at home (%)
Residents speaking English at home - Born in the United States (%)
Residents speaking English at home - Native, born elsewhere (%)
Residents speaking English at home - Foreign born (%)
Residents speaking Spanish at home (%)
Residents speaking Spanish at home - Born in the United States (%)
Residents speaking Spanish at home - Native, born elsewhere (%)
Residents speaking Spanish at home - Foreign born (%)
Residents speaking other language at home (%)
Residents speaking other language at home - Born in the United States (%)
Residents speaking other language at home - Native, born elsewhere (%)
Residents speaking other language at home - Foreign born (%)
Marital status - Never married (%)
Marital status - Now married (%)
Marital status - Separated (%)
Marital status - Widowed (%)
Marital status - Divorced (%)
Ancestries Reported - Arab (%)
Ancestries Reported - Czech (%)
Ancestries Reported - Danish (%)
Ancestries Reported - Dutch (%)
Ancestries Reported - English (%)
Ancestries Reported - French (%)
Ancestries Reported - French Canadian (%)
Ancestries Reported - German (%)
Ancestries Reported - Greek (%)
Ancestries Reported - Hungarian (%)
Ancestries Reported - Irish (%)
Ancestries Reported - Italian (%)
Ancestries Reported - Lithuanian (%)
Ancestries Reported - Norwegian (%)
Ancestries Reported - Polish (%)
Ancestries Reported - Portuguese (%)
Ancestries Reported - Russian (%)
Ancestries Reported - Scotch-Irish (%)
Ancestries Reported - Scottish (%)
Ancestries Reported - Slovak (%)
Ancestries Reported - Subsaharan African (%)
Ancestries Reported - Swedish (%)
Ancestries Reported - Swiss (%)
Ancestries Reported - Ukrainian (%)
Ancestries Reported - United States (%)
Ancestries Reported - Welsh (%)
Ancestries Reported - West Indian (%)
Ancestries Reported - Other (%)
Geographical mobility - Same house 1 year ago (%)
Geographical mobility - Same house 1 year ago (%) - White
Geographical mobility - Same house 1 year ago (%) - Black or African American
Geographical mobility - Same house 1 year ago (%) - Asian
Geographical mobility - Same house 1 year ago (%) - Hispanic or Latino
Geographical mobility - Same house 1 year ago (%) - American Indian and Alaska Native
Geographical mobility - Same house 1 year ago (%) - Multirace
Geographical mobility - Same house 1 year ago (%) - Other Race
Geographical mobility - Moved within same county (%)
Geographical mobility - Moved within same county (%) - White
Geographical mobility - Moved within same county (%) - Black or African American
Geographical mobility - Moved within same county (%) - Asian
Geographical mobility - Moved within same county (%) - Hispanic or Latino
Geographical mobility - Moved within same county (%) - American Indian and Alaska Native
Geographical mobility - Moved within same county (%) - Multirace
Geographical mobility - Moved within same county (%) - Other Race
Geographical mobility - Moved from different county within same state (%)
Geographical mobility - Moved from different county within same state (%) - White
Geographical mobility - Moved from different county within same state (%) - Black or African American
Geographical mobility - Moved from different county within same state (%) - Asian
Geographical mobility - Moved from different county within same state (%) - Hispanic or Latino
Geographical mobility - Moved from different county within same state (%) - American Indian and Alaska Native
Geographical mobility - Moved from different county within same state (%) - Multirace
Geographical mobility - Moved from different county within same state (%) - Other Race
Geographical mobility - Moved from different state (%)
Geographical mobility - Moved from different state (%) - White
Geographical mobility - Moved from different state (%) - Black or African American
Geographical mobility - Moved from different state (%) - Asian
Geographical mobility - Moved from different state (%) - Hispanic or Latino
Geographical mobility - Moved from different state (%) - American Indian and Alaska Native
Geographical mobility - Moved from different state (%) - Multirace
Geographical mobility - Moved from different state (%) - Other Race
Geographical mobility - Moved from abroad (%)
Geographical mobility - Moved from abroad (%) - White
Geographical mobility - Moved from abroad (%) - Black or African American
Geographical mobility - Moved from abroad (%) - Asian
Geographical mobility - Moved from abroad (%) - Hispanic or Latino
Geographical mobility - Moved from abroad (%) - American Indian and Alaska Native
Geographical mobility - Moved from abroad (%) - Multirace
Geographical mobility - Moved from abroad (%) - Other Race
Place of birth for the foreign-born population - Ireland (%)
Place of birth for the foreign-born population - Denmark (%)
Place of birth for the foreign-born population - Norway (%)
Place of birth for the foreign-born population - Sweden (%)
Place of birth for the foreign-born population - United Kingdom (%)
Place of birth for the foreign-born population - England (%)
Place of birth for the foreign-born population - Scotland (%)
Place of birth for the foreign-born population - Other Northern Europe (%)
Place of birth for the foreign-born population - Austria (%)
Place of birth for the foreign-born population - Belgium (%)
Place of birth for the foreign-born population - France (%)
Place of birth for the foreign-born population - Germany (%)
Place of birth for the foreign-born population - Netherlands (%)
Place of birth for the foreign-born population - Switzerland (%)
Place of birth for the foreign-born population - Other Western Europe (%)
Place of birth for the foreign-born population - Greece (%)
Place of birth for the foreign-born population - Italy (%)
Place of birth for the foreign-born population - Portugal (%)
Place of birth for the foreign-born population - Spain (%)
Place of birth for the foreign-born population - Other Southern Europe (%)
Place of birth for the foreign-born population - Albania (%)
Place of birth for the foreign-born population - Belarus (%)
Place of birth for the foreign-born population - Bosnia and Herzegovina (%)
Place of birth for the foreign-born population - Bulgaria (%)
Place of birth for the foreign-born population - Croatia (%)
Place of birth for the foreign-born population - Czechoslovakia (%)
Place of birth for the foreign-born population - Hungary (%)
Place of birth for the foreign-born population - Latvia (%)
Place of birth for the foreign-born population - Lithuania (%)
Place of birth for the foreign-born population - North Macedonia (Macedonia) (%)
Place of birth for the foreign-born population - Moldova (%)
Place of birth for the foreign-born population - Poland (%)
Place of birth for the foreign-born population - Romania (%)
Place of birth for the foreign-born population - Russia (%)
Place of birth for the foreign-born population - Serbia (%)
Place of birth for the foreign-born population - Ukraine (%)
Place of birth for the foreign-born population - Other Eastern Europe (%)
Place of birth for the foreign-born population - China (%)
Place of birth for the foreign-born population - Hong Kong (%)
Place of birth for the foreign-born population - Taiwan (%)
Place of birth for the foreign-born population - Japan (%)
Place of birth for the foreign-born population - Korea (%)
Place of birth for the foreign-born population - Other Eastern Asia (%)
Place of birth for the foreign-born population - Afghanistan (%)
Place of birth for the foreign-born population - Bangladesh (%)
Place of birth for the foreign-born population - India (%)
Place of birth for the foreign-born population - Iran (%)
Place of birth for the foreign-born population - Kazakhstan (%)
Place of birth for the foreign-born population - Nepal (%)
Place of birth for the foreign-born population - Pakistan (%)
Place of birth for the foreign-born population - Sri Lanka (%)
Place of birth for the foreign-born population - Uzbekistan (%)
Place of birth for the foreign-born population - Other South Central Asia (%)
Place of birth for the foreign-born population - Burma (%)
Place of birth for the foreign-born population - Cambodia (%)
Place of birth for the foreign-born population - Indonesia (%)
Place of birth for the foreign-born population - Laos (%)
Place of birth for the foreign-born population - Malaysia (%)
Place of birth for the foreign-born population - Philippines (%)
Place of birth for the foreign-born population - Singapore (%)
Place of birth for the foreign-born population - Thailand (%)
Place of birth for the foreign-born population - Vietnam (%)
Place of birth for the foreign-born population - Other South Eastern Asia (%)
Place of birth for the foreign-born population - Armenia (%)
Place of birth for the foreign-born population - Iraq (%)
Place of birth for the foreign-born population - Israel (%)
Place of birth for the foreign-born population - Jordan (%)
Place of birth for the foreign-born population - Kuwait (%)
Place of birth for the foreign-born population - Lebanon (%)
Place of birth for the foreign-born population - Saudi Arabia (%)
Place of birth for the foreign-born population - Syria (%)
Place of birth for the foreign-born population - Turkey (%)
Place of birth for the foreign-born population - Yemen (%)
Place of birth for the foreign-born population - Other Western Asia (%)
Place of birth for the foreign-born population - Eritrea (%)
Place of birth for the foreign-born population - Ethiopia (%)
Place of birth for the foreign-born population - Kenya (%)
Place of birth for the foreign-born population - Somalia (%)
Place of birth for the foreign-born population - Uganda (%)
Place of birth for the foreign-born population - Zimbabwe (%)
Place of birth for the foreign-born population - Other Eastern Africa (%)
Place of birth for the foreign-born population - Cameroon (%)
Place of birth for the foreign-born population - Congo (%)
Place of birth for the foreign-born population - Democratic Republic of Congo (Zaire) (%)
Place of birth for the foreign-born population - Other Middle Africa (%)
Place of birth for the foreign-born population - Egypt (%)
Place of birth for the foreign-born population - Morocco (%)
Place of birth for the foreign-born population - Sudan (%)
Place of birth for the foreign-born population - Other Northern Africa (%)
Place of birth for the foreign-born population - South Africa (%)
Place of birth for the foreign-born population - Other Southern Africa (%)
Place of birth for the foreign-born population - Cabo Verde (%)
Place of birth for the foreign-born population - Ghana (%)
Place of birth for the foreign-born population - Liberia (%)
Place of birth for the foreign-born population - Nigeria (%)
Place of birth for the foreign-born population - Senegal (%)
Place of birth for the foreign-born population - Sierra Leone (%)
Place of birth for the foreign-born population - Other Western Africa (%)
Place of birth for the foreign-born population - Australia (%)
Place of birth for the foreign-born population - New Zealand (%)
Place of birth for the foreign-born population - Fiji (%)
Place of birth for the foreign-born population - Micronesia (%)
Place of birth for the foreign-born population - Bahamas (%)
Place of birth for the foreign-born population - Barbados (%)
Place of birth for the foreign-born population - Cuba (%)
Place of birth for the foreign-born population - Dominica (%)
Place of birth for the foreign-born population - Dominican Republic (%)
Place of birth for the foreign-born population - Grenada (%)
Place of birth for the foreign-born population - Haiti (%)
Place of birth for the foreign-born population - Jamaica (%)
Place of birth for the foreign-born population - St. Vincent and the Grenadines (%)
Place of birth for the foreign-born population - Trinidad and Tobago (%)
Place of birth for the foreign-born population - West Indies (%)
Place of birth for the foreign-born population - Other Caribbean (%)
Place of birth for the foreign-born population - Belize (%)
Place of birth for the foreign-born population - Costa Rica (%)
Place of birth for the foreign-born population - El Salvador (%)
Place of birth for the foreign-born population - Guatemala (%)
Place of birth for the foreign-born population - Honduras (%)
Place of birth for the foreign-born population - Mexico (%)
Place of birth for the foreign-born population - Nicaragua (%)
Place of birth for the foreign-born population - Panama (%)
Place of birth for the foreign-born population - Other Central America (%)
Place of birth for the foreign-born population - Argentina (%)
Place of birth for the foreign-born population - Bolivia (%)
Place of birth for the foreign-born population - Brazil (%)
Place of birth for the foreign-born population - Chile (%)
Place of birth for the foreign-born population - Colombia (%)
Place of birth for the foreign-born population - Ecuador (%)
Place of birth for the foreign-born population - Guyana (%)
Place of birth for the foreign-born population - Peru (%)
Place of birth for the foreign-born population - Uruguay (%)
Place of birth for the foreign-born population - Venezuela (%)
Place of birth for the foreign-born population - Other South America (%)
Place of birth for the foreign-born population - Canada (%)
Place of birth for the foreign-born population - Other Northern America (%)
Place of birth for the foreign-born population - Other (%)
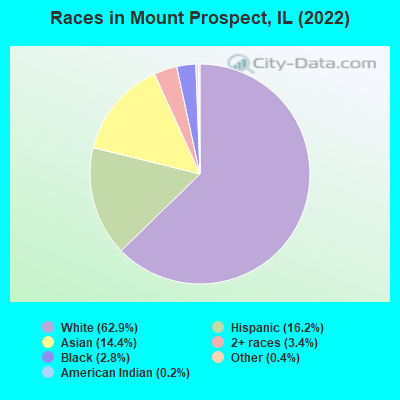
According to 2022 data, the most numerous races in Mount Prospect, IL are White alone (34,569 residents), Hispanic (8,917 residents), and Black alone (1,519 residents). 57.3% of Mount Prospect residents speak English at home. 30.5% of Mount Prospect, IL residents are foreign-born (12.0% born in Europe, 10.4% born in Asia, 7.2% born in Latin America), which is 54.1% greater than the foreign-born rate of 14.0% across the entire state of Illinois.
Race distribution in Mount Prospect
2000 2022
8,424,140 67.8% White alone 1,856,152 14.9% Black alone 1,530,262 12.3% Hispanic 419,916 3.4% Asian alone 153,996 1.2% Two or more races 13,479 0.1% Other race alone 18,232 0.1% American Indian alone 3,116 0.03% Native Hawaiian and Other
7,356,301 58.5% White alone 2,299,726 18.3% Hispanic 1,660,423 13.2% Black alone 747,296 5.9% Asian alone 458,599 3.6% Two or more races 45,386 0.4% Other race alone 10,405 0.08% American Indian alone 3,896 0.03% Native Hawaiian and Other
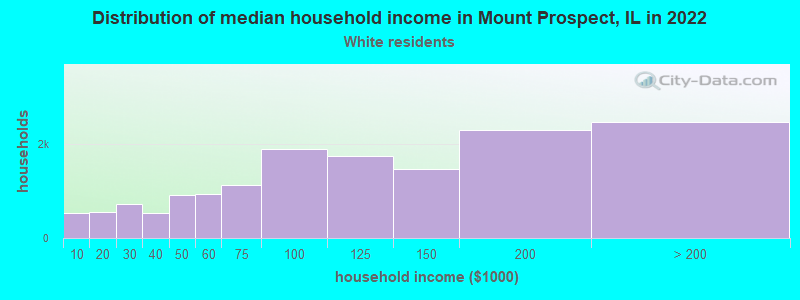
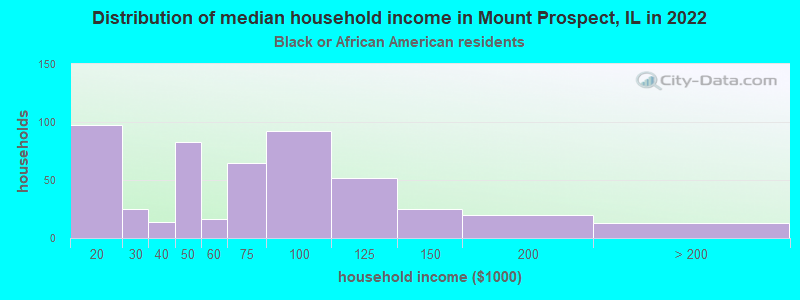
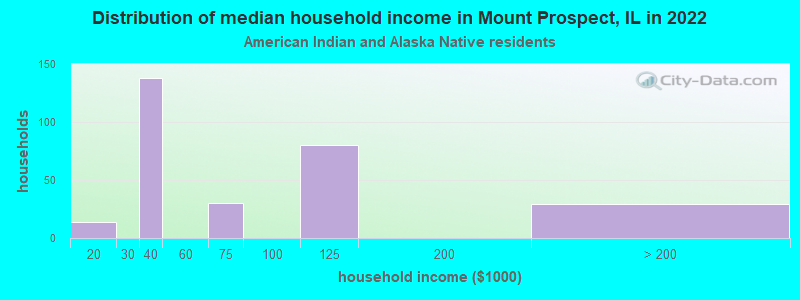
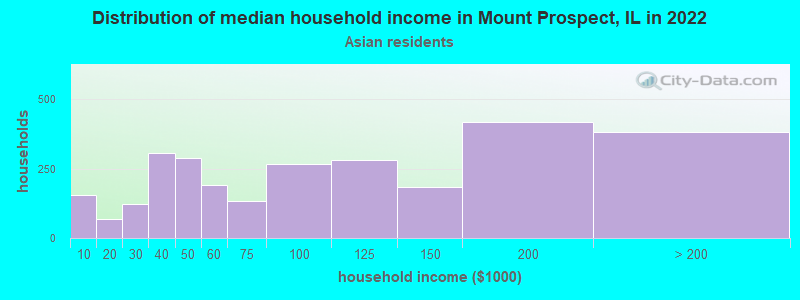
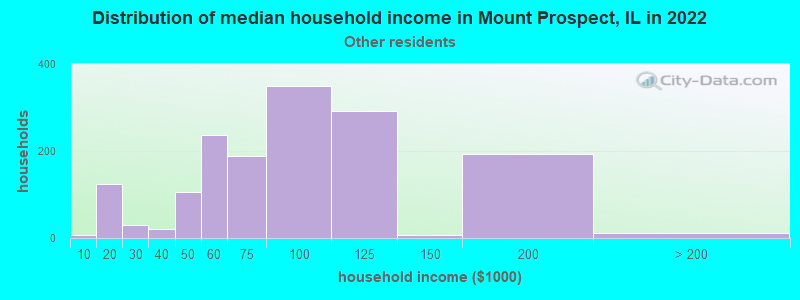
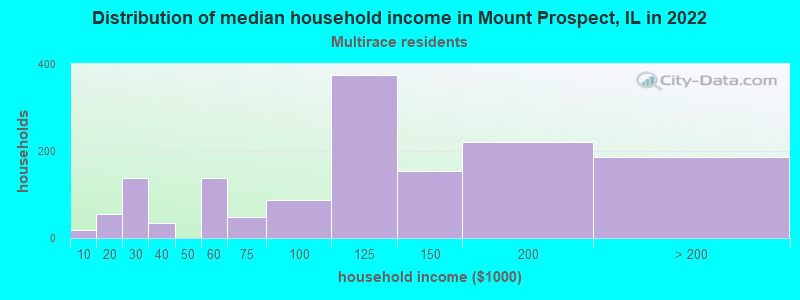
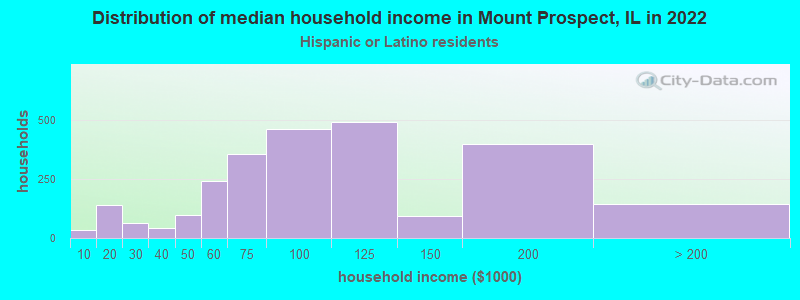
Income and house value in Mount Prospect Median household income in 2022 $104,585 White non-Hispanic householders$68,602 Black householders$92,430 Asian householders$78,914 Some other race householders$102,275 Two or more races householders$82,253 Hispanic or Latino race householdersMedian 2022 house value $405,579 White Non-Hispanic householders$243,643 Black or African American householders$179,827 American Indian or Alaska Native householders $380,496 Asian householders$253,602 Native Hawaiian and other Pacific Islander householders$407,055 Some other race householders$324,980 Two or more races householders$303,954 Hispanic or Latino householders
Median age by race in Mount Prospect
47.7 Median age for White residents46.0 49.0 31.2 Median age for Black or African American residents31.6 29.8 42.7 Median age for American Indian / Alaska Native residents50.3 39.9 38.6 Median age for Asian residents38.7 38.3 -687,999,999.3 Median age for Native Hawaiian / Pacific Islander residents-918,721,460.3 -610,229,276.3 33.1 Median age for Other race residents33.3 33.2 24.3 Median age for Two or more races residents24.7 22.6 47.2 Median age for White alone residents46.2 48.3 31.8 Median age for Hispanic or Latino residents31.7 32.1
Owner/renter occupied households by race in Mount Prospect
House owners and renters - White residents 11,931 78.6% Owner occupied3,258 21.4% Renter occupiedHouse owners and renters - Black or African American residents 143 27.7% Owner occupied374 72.3% Renter occupiedHouse owners and renters - American Indian / Alaska Native residents 115 38.7% Owner occupied182 61.3% Renter occupiedHouse owners and renters - Asian residents 1,706 61.8% Owner occupied1,053 38.2% Renter occupiedHouse owners and renters - Other race residents 314 21.1% Owner occupied1,175 78.9% Renter occupiedHouse owners and renters - Two or more races residents 733 48.9% Owner occupied768 51.1% Renter occupiedHouse owners and renters - White alone residents 12,388 79.0% Owner occupied3,287 21.0% Renter occupiedHouse owners and renters - Hispanic or Latino residents 820 32.8% Owner occupied1,681 67.2% Renter occupied
Language usage in Mount Prospect
English speakers - Total 57.3% of residents of Mount Prospect speak English at home.
12.7% of residents speak Spanish at home 3,811 57.9% Speak English very well2,768 42.1% Speak English less than very well30.4% of residents speak other language at home 9,826 62.6% Speak English very well5,865 37.4% Speak English less than very well
English speakers - Born in the United States 91.0% of residents of Mount Prospect speak English at home.
3.6% of residents speak Spanish at home 193 99.0% Speak English very well2 1.0% Speak English less than very well5.4% of residents speak other language at home 271 92.8% Speak English very well21 7.2% Speak English less than very well
English speakers - Native, born elsewhere 23.9% of residents of Mount Prospect speak English at home.
43.0% of residents speak Spanish at home 170 83.7% Speak English very well33 16.3% Speak English less than very well33.3% of residents speak other language at home 124 79.0% Speak English very well33 21.0% Speak English less than very well
English speakers - Foreign-born 10.4% of residents of Mount Prospect speak English at home.
20.7% of residents speak Spanish at home 1,079 31.2% Speak English very well2,376 68.8% Speak English less than very well68.7% of residents speak other language at home 6,206 54.1% Speak English very well5,256 45.9% Speak English less than very well
White (Caucasian) - Speak only English Native:
91.9% (22,694)Foreign-born:
11.0% (691)
White (Caucasian) - Speak another language Native:
9.0% (2,222)Foreign-born:
88.7% (5,574)
Black or African American - Speak only English Native:
96.8% (930)Foreign-born:
82.3% (192)
Black or African American - Speak another language Native:
3.3% (31)Foreign-born:
28.2% (66)
American Indian / Alaska Native - Speak only English Native:
36.4% (97)Foreign-born:
11.9% (34)
American Indian / Alaska Native - Speak another language Native:
62.1% (166)Foreign-born:
83.1% (240)
Asian - Speak only English Native:
40.0% (922)Foreign-born:
7.0% (346)
Asian - Speak another language Native:
59.9% (1,381)Foreign-born:
93.6% (4,616)
Other race - Speak only English Native:
24.2% (510)Foreign-born:
15.6% (434)
Other race - Speak another language Native:
75.7% (1,594)Foreign-born:
83.0% (2,313)
Two or more races - Speak another language Native:
37.4% (1,524)Foreign-born:
100.0% (1,117)
White alone - Speak only English Native:
88.9% (22,782)Foreign-born:
10.2% (764)
White alone - Speak another language Native:
11.4% (2,930)Foreign-born:
90.3% (6,749)
Hispanic or Latino - Speak only English Native:
30.6% (1,352)Foreign-born:
10.3% (403)
Hispanic or Latino - Speak another language Native:
69.3% (3,063)Foreign-born:
89.0% (3,479)
Foreign-born residents in Mount Prospect 16,767 residents are foreign born (12.0% Europe , 10.4% Asia , 7.2% Latin America ).
This city:
30.5%Illinois:
14.1%
Marital status for residents in Mount Prospect Marital status - White (Caucasian) population 15 years and over
Males 26.2% Never married63.4% Now married0.5% Separated3.7% Widowed6.2% DivorcedFemales 21.0% Never married56.0% Now married1.7% Separated11.0% Widowed10.3% DivorcedWomen who gave birth in the past 12 months Now married:
95.3% (307)Unmarried:
4.7% (15)
Women who did not give birth in the past 12 months Now married:
55.8% (3,464)Unmarried:
44.2% (2,748)
Marital status - Black or African American population 15 years and over
Males 54.8% Never married29.6% Now married12.9% Separated0.0% Widowed2.7% DivorcedFemales 53.2% Never married19.7% Now married1.6% Separated10.9% Widowed14.7% DivorcedWomen who gave birth in the past 12 months Now married:
0.0% (0)Unmarried:
94.4% (1)
Women who did not give birth in the past 12 months Now married:
21.3% (51)Unmarried:
78.7% (189)
Marital status - American Indian / Alaska Native population 15 years and over
Males 32.0% Never married43.2% Now married0.0% Separated24.8% Widowed0.0% DivorcedFemales 37.6% Never married62.4% Now married0.0% Separated0.0% Widowed0.0% DivorcedWomen who gave birth in the past 12 months Now married:
0.0% (0)Unmarried:
100.0% (13)
Women who did not give birth in the past 12 months Now married:
20.8% (27)Unmarried:
79.2% (103)
Marital status - Asian population 15 years and over
Males 18.9% Never married67.1% Now married2.2% Separated5.2% Widowed6.6% DivorcedFemales 17.4% Never married69.9% Now married1.2% Separated10.2% Widowed1.2% DivorcedWomen who gave birth in the past 12 months Now married:
71.7% (159)Unmarried:
28.3% (63)
Women who did not give birth in the past 12 months Now married:
75.9% (1,266)Unmarried:
24.1% (401)
Marital status - Other race population 15 years and over
Males 48.9% Never married40.4% Now married2.9% Separated1.7% Widowed6.2% DivorcedFemales 34.9% Never married57.6% Now married0.5% Separated3.4% Widowed3.6% DivorcedWomen who gave birth in the past 12 months Now married:
100.0% (147)Unmarried:
0.0% (0)
Women who did not give birth in the past 12 months Now married:
48.7% (574)Unmarried:
51.3% (604)
Marital status - Two or more races population 15 years and over
Males 53.0% Never married47.0% Now married0.0% Separated0.0% Widowed0.0% DivorcedFemales 40.3% Never married48.0% Now married0.0% Separated5.0% Widowed6.7% DivorcedWomen who gave birth in the past 12 months Now married:
0.0% (0)Unmarried:
100.0% (14)
Women who did not give birth in the past 12 months Now married:
42.7% (621)Unmarried:
57.3% (832)
Marital status - White alone, not Hispanic / Latino population 15 years and over
Males 25.6% Never married63.7% Now married0.5% Separated3.9% Widowed6.3% DivorcedFemales 20.7% Never married55.6% Now married1.7% Separated11.4% Widowed10.7% DivorcedWomen who gave birth in the past 12 months Now married:
95.0% (325)Unmarried:
5.0% (17)
Women who did not give birth in the past 12 months Now married:
55.2% (3,532)Unmarried:
44.8% (2,866)
Marital status - Hispanic or Latino population 15 years and over
Males 47.6% Never married44.5% Now married1.7% Separated1.5% Widowed4.7% DivorcedFemales 34.5% Never married55.1% Now married0.8% Separated5.0% Widowed4.7% DivorcedWomen who gave birth in the past 12 months Now married:
100.0% (150)Unmarried:
0.0% (0)
Women who did not give birth in the past 12 months Now married:
50.9% (1,236)Unmarried:
49.1% (1,193)
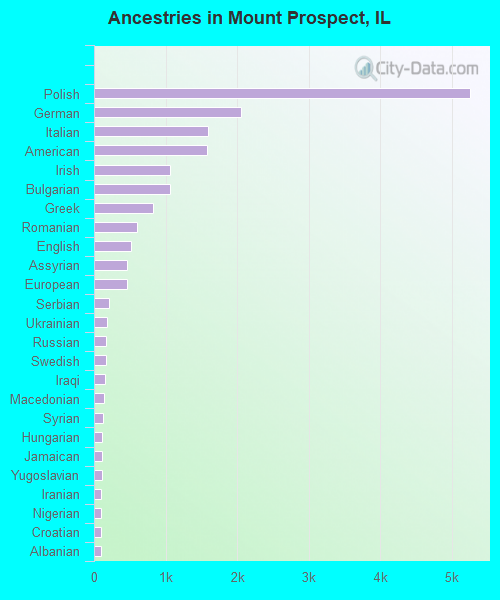
Ancestries in Mount Prospect
5,259 16.8% Polish2,051 6.5% German1,588 5.1% Italian1,584 5.1% American1,067 3.4% Irish1,056 3.4% Bulgarian824 2.6% Greek603 1.9% Romanian515 1.6% English468 1.5% Assyrian456 1.5% European203 0.6% Serbian182 0.6% Ukrainian174 0.6% Russian163 0.5% Swedish157 0.5% Iraqi135 0.4% Macedonian125 0.4% Syrian108 0.3% Hungarian108 0.3% Jamaican105 0.3% Yugoslavian103 0.3% Iranian100 0.3% Nigerian99 0.3% Croatian92 0.3% Albanian90 0.3% Canadian86 0.3% Scotch-Irish84 0.3% Slovak84 0.3% Lithuanian82 0.3% Norwegian68 0.2% Czech55 0.2% French54 0.2% Latvian51 0.2% Turkish48 0.2% Dutch43 0.1% Eastern European40 0.1% African36 0.1% Scottish28 0.09% Scandinavian26 0.08% Cypriot24 0.08% Palestinian24 0.08% Australian21 0.07% Arab16 0.05% Jordanian16 0.05% Brazilian16 0.05% Egyptian15 0.05% Welsh13 0.04% Lebanese13 0.04% British13 0.04% Austrian12 0.04% Czechoslovakian11 0.04% Portuguese11 0.04% Swiss9 0.03% Danish9 0.03% Slavic9 0.03% Slovene8 0.03% Armenian7 0.02% Northern European6 0.02% Belgian5 0.02% Luxembourger
Geographical mobility in Mount Prospect Same house 1 year ago 28,857 88.7% White (Caucasian)1,382 90.7% Black or African American583 98.7% American Indian / Alaska Native7,097 91.1% Asian18 100.0% Native Hawaiian / Pacific Islander4,239 81.9% Other race4,956 91.8% Two or more races30,772 89.7% White alone, not Hispanic / Latino7,408 84.1% Hispanic or LatinoMoved within same county 2,750 8.5% White / Caucasian109 7.2% Black or African American384 4.9% Asian680 13.1% Other race295 5.5% Two or more races2,599 7.6% White alone, not Hispanic / Latino1,102 12.5% Hispanic or LatinoMoved within same state 210 0.6% White / Caucasian39 2.5% Black or African American5 0.1% Asian161 3.1% Other race14 0.3% Two or more races221 0.6% White alone, not Hispanic / Latino124 1.4% Hispanic or LatinoMoved from different state 449 1.4% White / Caucasian20 0.3% Asian102 1.9% Two or more races448 1.3% White alone, not Hispanic / Latino62 0.7% Hispanic or LatinoMoved from abroad 119 0.4% White246 3.2% Asian63 1.2% Other race130 0.4% White alone, not Hispanic / Latino73 0.8% Hispanic or Latino
Children Nativity (place of birth) in Mount Prospect
Children under 6 years - Living with two parents Both parents native 1,433 100.0% NativeBoth parents foreign-born 1,024 97.8% Native23 2.2% Foreign-bornOne native, one foreign-born parent 351 100.0% NativeChildren under 6 years - Living with one parent Native parent 423 100.0% NativeForeign-born parent 114 100.0% NativeChildren 6 to 17 years - Living with two parents Both parents native 3,243 100.0% NativeBoth parents foreign-born 2,074 85.3% Native356 14.7% Foreign-bornOne native, one foreign-born parent 451 100.0% NativeChildren 6 to 17 years - Living with one parent Native parent 826 100.0% NativeForeign-born parent 597 52.3% Native544 47.7% Foreign-born
Place of birth for residents in Mount Prospect 6,709 Europe5,817 Asia5,721 Eastern Europe4,057 Americas4,035 Latin America3,631 Central America2,513 South Central Asia1,286 Eastern Asia1,212 South Eastern Asia804 Western Asia737 Southern Europe313 China256 South America166 Africa148 Caribbean133 Northern Europe117 Western Europe72 Eastern Africa52 Northern Africa41 Western Africa21 Northern America15 Oceania15 Australia and New Zealand Subregion3,303 Mexico3,209 Poland1,780 India924 Bulgaria689 Philippines681 Korea398 Romania391 Italy387 Ukraine313 Greece295 Iraq291 Vietnam187 Guatemala184 Moldova162 China148 Bosnia and Herzegovina136 Jamaica134 North Macedonia (Macedonia)130 Pakistan128 Cambodia127 El Salvador114 United Arab Emirates101 Burma (Myanmar)95 Turkey95 Japan93 Hong Kong86 Russia86 Bolivia84 Syria81 Iran80 Lebanon77 Czechoslovakia73 Germany72 United Kingdom58 Kazakhstan57 Taiwan57 Brazil49 Jordan45 Ireland44 Venezuela43 Saudi Arabia41 Nigeria40 Israel39 Croatia32 Spain31 Belarus31 Algeria30 Lithuania26 Nepal24 Serbia23 France21 Canada21 Ecuador20 Egypt15 Austria15 Australia14 England14 Argentina12 Costa Rica11 Cuba11 Peru8 Colombia4 Latvia1 Singapore
Grandparents responsible for own grandchildren in Mount Prospect
Grandparents (30 to 59 years) White / Caucasian 137 85.7% Responsible for grandchildren23 14.3% Not responsible for grandchildrenBlack or African American 1 80.2% Not responsible for grandchildrenAsian 20 100.0% Not responsible for grandchildrenOther race 99 39.1% Responsible for grandchildren154 60.9% Not responsible for grandchildrenTwo or more races 101 100.0% Not responsible for grandchildrenWhite alone, not Hispanic / Latino 62 77.0% Responsible for grandchildren19 23.0% Not responsible for grandchildrenHispanic or Latino 217 52.0% Responsible for grandchildren200 48.0% Not responsible for grandchildrenGrandparents (60 years and over) White / Caucasian 27 17.6% Responsible for grandchildren127 82.4% Not responsible for grandchildrenBlack or African American 45 100.0% Not responsible for grandchildrenAsian 79 40.1% Responsible for grandchildren119 59.9% Not responsible for grandchildrenOther race 64 77.5% Responsible for grandchildren19 22.5% Not responsible for grandchildrenTwo or more races 28 100.0% Not responsible for grandchildrenWhite alone, not Hispanic / Latino 33 18.1% Responsible for grandchildren149 81.9% Not responsible for grandchildrenHispanic or Latino 69 59.9% Responsible for grandchildren46 40.1% Not responsible for grandchildren