Races in Monroe, Georgia (GA) Detailed Stats
Data:
Races - White alone (%)
Races - White alone (% change since 2000)
Races - Black alone (%)
Races - Black alone (% change since 2000)
Races - American Indian alone (%)
Races - American Indian alone (% change since 2000)
Races - Asian alone (%)
Races - Asian alone (% change since 2000)
Races - Hispanic (%)
Races - Hispanic (% change since 2000)
Races - Native Hawaiian and Other Pacific Islander alone (%)
Races - Native Hawaiian and Other Pacific Islander alone (% change since 2000)
Races - Two or more races(%)
Races - Two or more races(% change since 2000)
Races - Other race alone (%)
Races - Other race alone (% change since 2000)
Racial diversity
Place of birth - Born in state of residence (%)
Place of birth - Born in state of residence (%) - White
Place of birth - Born in state of residence (%) - Black or African American
Place of birth - Born in state of residence (%) - Asian
Place of birth - Born in state of residence (%) - Hispanic or Latino
Place of birth - Born in state of residence (%) - American Indian and Alaska Native
Place of birth - Born in state of residence (%) - Multirace
Place of birth - Born in state of residence (%) - Other Race
Place of birth - Born in other state (%)
Place of birth - Born in other state (%) - White
Place of birth - Born in other state (%) - Black or African American
Place of birth - Born in other state (%) - Asian
Place of birth - Born in other state (%) - Hispanic or Latino
Place of birth - Born in other state (%) - American Indian and Alaska Native
Place of birth - Born in other state (%) - Multirace
Place of birth - Born in other state (%) - Other Race
Place of birth - Native, outside of US (%)
Place of birth - Native, outside of US (%) - White
Place of birth - Native, outside of US (%) - Black or African American
Place of birth - Native, outside of US (%) - Asian
Place of birth - Native, outside of US (%) - Hispanic or Latino
Place of birth - Native, outside of US (%) - American Indian and Alaska Native
Place of birth - Native, outside of US (%) - Multirace
Place of birth - Native, outside of US (%) - Other Race
Place of birth - Foreign born (%)
Place of birth - Foreign born (%) - White
Place of birth - Foreign born (%) - Black or African American
Place of birth - Foreign born (%) - Asian
Place of birth - Foreign born (%) - Hispanic or Latino
Place of birth - Foreign born (%) - American Indian and Alaska Native
Place of birth - Foreign born (%) - Multirace
Place of birth - Foreign born (%) - Other Race
Residents speaking English at home (%)
Residents speaking English at home - Born in the United States (%)
Residents speaking English at home - Native, born elsewhere (%)
Residents speaking English at home - Foreign born (%)
Residents speaking Spanish at home (%)
Residents speaking Spanish at home - Born in the United States (%)
Residents speaking Spanish at home - Native, born elsewhere (%)
Residents speaking Spanish at home - Foreign born (%)
Residents speaking other language at home (%)
Residents speaking other language at home - Born in the United States (%)
Residents speaking other language at home - Native, born elsewhere (%)
Residents speaking other language at home - Foreign born (%)
Marital status - Never married (%)
Marital status - Now married (%)
Marital status - Separated (%)
Marital status - Widowed (%)
Marital status - Divorced (%)
Ancestries Reported - Arab (%)
Ancestries Reported - Czech (%)
Ancestries Reported - Danish (%)
Ancestries Reported - Dutch (%)
Ancestries Reported - English (%)
Ancestries Reported - French (%)
Ancestries Reported - French Canadian (%)
Ancestries Reported - German (%)
Ancestries Reported - Greek (%)
Ancestries Reported - Hungarian (%)
Ancestries Reported - Irish (%)
Ancestries Reported - Italian (%)
Ancestries Reported - Lithuanian (%)
Ancestries Reported - Norwegian (%)
Ancestries Reported - Polish (%)
Ancestries Reported - Portuguese (%)
Ancestries Reported - Russian (%)
Ancestries Reported - Scotch-Irish (%)
Ancestries Reported - Scottish (%)
Ancestries Reported - Slovak (%)
Ancestries Reported - Subsaharan African (%)
Ancestries Reported - Swedish (%)
Ancestries Reported - Swiss (%)
Ancestries Reported - Ukrainian (%)
Ancestries Reported - United States (%)
Ancestries Reported - Welsh (%)
Ancestries Reported - West Indian (%)
Ancestries Reported - Other (%)
Geographical mobility - Same house 1 year ago (%)
Geographical mobility - Same house 1 year ago (%) - White
Geographical mobility - Same house 1 year ago (%) - Black or African American
Geographical mobility - Same house 1 year ago (%) - Asian
Geographical mobility - Same house 1 year ago (%) - Hispanic or Latino
Geographical mobility - Same house 1 year ago (%) - American Indian and Alaska Native
Geographical mobility - Same house 1 year ago (%) - Multirace
Geographical mobility - Same house 1 year ago (%) - Other Race
Geographical mobility - Moved within same county (%)
Geographical mobility - Moved within same county (%) - White
Geographical mobility - Moved within same county (%) - Black or African American
Geographical mobility - Moved within same county (%) - Asian
Geographical mobility - Moved within same county (%) - Hispanic or Latino
Geographical mobility - Moved within same county (%) - American Indian and Alaska Native
Geographical mobility - Moved within same county (%) - Multirace
Geographical mobility - Moved within same county (%) - Other Race
Geographical mobility - Moved from different county within same state (%)
Geographical mobility - Moved from different county within same state (%) - White
Geographical mobility - Moved from different county within same state (%) - Black or African American
Geographical mobility - Moved from different county within same state (%) - Asian
Geographical mobility - Moved from different county within same state (%) - Hispanic or Latino
Geographical mobility - Moved from different county within same state (%) - American Indian and Alaska Native
Geographical mobility - Moved from different county within same state (%) - Multirace
Geographical mobility - Moved from different county within same state (%) - Other Race
Geographical mobility - Moved from different state (%)
Geographical mobility - Moved from different state (%) - White
Geographical mobility - Moved from different state (%) - Black or African American
Geographical mobility - Moved from different state (%) - Asian
Geographical mobility - Moved from different state (%) - Hispanic or Latino
Geographical mobility - Moved from different state (%) - American Indian and Alaska Native
Geographical mobility - Moved from different state (%) - Multirace
Geographical mobility - Moved from different state (%) - Other Race
Geographical mobility - Moved from abroad (%)
Geographical mobility - Moved from abroad (%) - White
Geographical mobility - Moved from abroad (%) - Black or African American
Geographical mobility - Moved from abroad (%) - Asian
Geographical mobility - Moved from abroad (%) - Hispanic or Latino
Geographical mobility - Moved from abroad (%) - American Indian and Alaska Native
Geographical mobility - Moved from abroad (%) - Multirace
Geographical mobility - Moved from abroad (%) - Other Race
Place of birth for the foreign-born population - Ireland (%)
Place of birth for the foreign-born population - Denmark (%)
Place of birth for the foreign-born population - Norway (%)
Place of birth for the foreign-born population - Sweden (%)
Place of birth for the foreign-born population - United Kingdom (%)
Place of birth for the foreign-born population - England (%)
Place of birth for the foreign-born population - Scotland (%)
Place of birth for the foreign-born population - Other Northern Europe (%)
Place of birth for the foreign-born population - Austria (%)
Place of birth for the foreign-born population - Belgium (%)
Place of birth for the foreign-born population - France (%)
Place of birth for the foreign-born population - Germany (%)
Place of birth for the foreign-born population - Netherlands (%)
Place of birth for the foreign-born population - Switzerland (%)
Place of birth for the foreign-born population - Other Western Europe (%)
Place of birth for the foreign-born population - Greece (%)
Place of birth for the foreign-born population - Italy (%)
Place of birth for the foreign-born population - Portugal (%)
Place of birth for the foreign-born population - Spain (%)
Place of birth for the foreign-born population - Other Southern Europe (%)
Place of birth for the foreign-born population - Albania (%)
Place of birth for the foreign-born population - Belarus (%)
Place of birth for the foreign-born population - Bosnia and Herzegovina (%)
Place of birth for the foreign-born population - Bulgaria (%)
Place of birth for the foreign-born population - Croatia (%)
Place of birth for the foreign-born population - Czechoslovakia (%)
Place of birth for the foreign-born population - Hungary (%)
Place of birth for the foreign-born population - Latvia (%)
Place of birth for the foreign-born population - Lithuania (%)
Place of birth for the foreign-born population - North Macedonia (Macedonia) (%)
Place of birth for the foreign-born population - Moldova (%)
Place of birth for the foreign-born population - Poland (%)
Place of birth for the foreign-born population - Romania (%)
Place of birth for the foreign-born population - Russia (%)
Place of birth for the foreign-born population - Serbia (%)
Place of birth for the foreign-born population - Ukraine (%)
Place of birth for the foreign-born population - Other Eastern Europe (%)
Place of birth for the foreign-born population - China (%)
Place of birth for the foreign-born population - Hong Kong (%)
Place of birth for the foreign-born population - Taiwan (%)
Place of birth for the foreign-born population - Japan (%)
Place of birth for the foreign-born population - Korea (%)
Place of birth for the foreign-born population - Other Eastern Asia (%)
Place of birth for the foreign-born population - Afghanistan (%)
Place of birth for the foreign-born population - Bangladesh (%)
Place of birth for the foreign-born population - India (%)
Place of birth for the foreign-born population - Iran (%)
Place of birth for the foreign-born population - Kazakhstan (%)
Place of birth for the foreign-born population - Nepal (%)
Place of birth for the foreign-born population - Pakistan (%)
Place of birth for the foreign-born population - Sri Lanka (%)
Place of birth for the foreign-born population - Uzbekistan (%)
Place of birth for the foreign-born population - Other South Central Asia (%)
Place of birth for the foreign-born population - Burma (%)
Place of birth for the foreign-born population - Cambodia (%)
Place of birth for the foreign-born population - Indonesia (%)
Place of birth for the foreign-born population - Laos (%)
Place of birth for the foreign-born population - Malaysia (%)
Place of birth for the foreign-born population - Philippines (%)
Place of birth for the foreign-born population - Singapore (%)
Place of birth for the foreign-born population - Thailand (%)
Place of birth for the foreign-born population - Vietnam (%)
Place of birth for the foreign-born population - Other South Eastern Asia (%)
Place of birth for the foreign-born population - Armenia (%)
Place of birth for the foreign-born population - Iraq (%)
Place of birth for the foreign-born population - Israel (%)
Place of birth for the foreign-born population - Jordan (%)
Place of birth for the foreign-born population - Kuwait (%)
Place of birth for the foreign-born population - Lebanon (%)
Place of birth for the foreign-born population - Saudi Arabia (%)
Place of birth for the foreign-born population - Syria (%)
Place of birth for the foreign-born population - Turkey (%)
Place of birth for the foreign-born population - Yemen (%)
Place of birth for the foreign-born population - Other Western Asia (%)
Place of birth for the foreign-born population - Eritrea (%)
Place of birth for the foreign-born population - Ethiopia (%)
Place of birth for the foreign-born population - Kenya (%)
Place of birth for the foreign-born population - Somalia (%)
Place of birth for the foreign-born population - Uganda (%)
Place of birth for the foreign-born population - Zimbabwe (%)
Place of birth for the foreign-born population - Other Eastern Africa (%)
Place of birth for the foreign-born population - Cameroon (%)
Place of birth for the foreign-born population - Congo (%)
Place of birth for the foreign-born population - Democratic Republic of Congo (Zaire) (%)
Place of birth for the foreign-born population - Other Middle Africa (%)
Place of birth for the foreign-born population - Egypt (%)
Place of birth for the foreign-born population - Morocco (%)
Place of birth for the foreign-born population - Sudan (%)
Place of birth for the foreign-born population - Other Northern Africa (%)
Place of birth for the foreign-born population - South Africa (%)
Place of birth for the foreign-born population - Other Southern Africa (%)
Place of birth for the foreign-born population - Cabo Verde (%)
Place of birth for the foreign-born population - Ghana (%)
Place of birth for the foreign-born population - Liberia (%)
Place of birth for the foreign-born population - Nigeria (%)
Place of birth for the foreign-born population - Senegal (%)
Place of birth for the foreign-born population - Sierra Leone (%)
Place of birth for the foreign-born population - Other Western Africa (%)
Place of birth for the foreign-born population - Australia (%)
Place of birth for the foreign-born population - New Zealand (%)
Place of birth for the foreign-born population - Fiji (%)
Place of birth for the foreign-born population - Micronesia (%)
Place of birth for the foreign-born population - Bahamas (%)
Place of birth for the foreign-born population - Barbados (%)
Place of birth for the foreign-born population - Cuba (%)
Place of birth for the foreign-born population - Dominica (%)
Place of birth for the foreign-born population - Dominican Republic (%)
Place of birth for the foreign-born population - Grenada (%)
Place of birth for the foreign-born population - Haiti (%)
Place of birth for the foreign-born population - Jamaica (%)
Place of birth for the foreign-born population - St. Vincent and the Grenadines (%)
Place of birth for the foreign-born population - Trinidad and Tobago (%)
Place of birth for the foreign-born population - West Indies (%)
Place of birth for the foreign-born population - Other Caribbean (%)
Place of birth for the foreign-born population - Belize (%)
Place of birth for the foreign-born population - Costa Rica (%)
Place of birth for the foreign-born population - El Salvador (%)
Place of birth for the foreign-born population - Guatemala (%)
Place of birth for the foreign-born population - Honduras (%)
Place of birth for the foreign-born population - Mexico (%)
Place of birth for the foreign-born population - Nicaragua (%)
Place of birth for the foreign-born population - Panama (%)
Place of birth for the foreign-born population - Other Central America (%)
Place of birth for the foreign-born population - Argentina (%)
Place of birth for the foreign-born population - Bolivia (%)
Place of birth for the foreign-born population - Brazil (%)
Place of birth for the foreign-born population - Chile (%)
Place of birth for the foreign-born population - Colombia (%)
Place of birth for the foreign-born population - Ecuador (%)
Place of birth for the foreign-born population - Guyana (%)
Place of birth for the foreign-born population - Peru (%)
Place of birth for the foreign-born population - Uruguay (%)
Place of birth for the foreign-born population - Venezuela (%)
Place of birth for the foreign-born population - Other South America (%)
Place of birth for the foreign-born population - Canada (%)
Place of birth for the foreign-born population - Other Northern America (%)
Place of birth for the foreign-born population - Other (%)
Latest news about races in Monroe, GA collected exclusively by city-data.com from local newspapers, TV, and radio stations
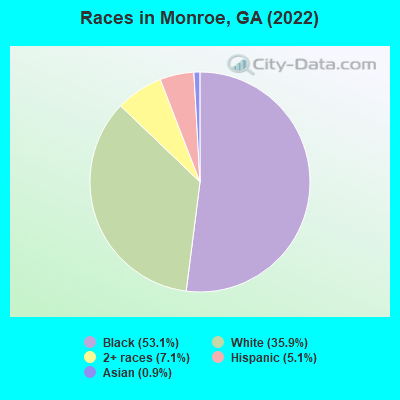
According to 2022 data, the most numerous races in Monroe, GA are White alone (5,688 residents), Black alone (8,418 residents), and Hispanic (801 residents). 95.8% of Monroe residents speak English at home. 2.9% of Monroe, GA residents are foreign-born (1.4% born in Latin America, 0.8% born in Asia, 0.4% born in Africa, 0.3% born in Europe), which is 243.1% less than the foreign-born rate of 10.0% across the entire state of Georgia.
Race distribution in Monroe
2000 2022
5,128,661 62.6% White alone 2,331,465 28.5% Black alone 435,227 5.3% Hispanic 171,513 2.1% Asian alone 87,364 1.1% Two or more races 17,670 0.2% American Indian alone 11,275 0.1% Other race alone 3,278 0.04% Native Hawaiian and Other
5,415,657 49.6% White alone 3,349,240 30.7% Black alone 1,132,604 10.4% Hispanic 479,156 4.4% Asian alone 462,923 4.2% Two or more races 54,416 0.5% Other race alone 11,923 0.1% American Indian alone 6,957 0.06% Native Hawaiian and Other
Income and house value in Monroe Median household income in 2022 $64,337 White non-Hispanic householders$39,822 Black householders$62,300 Two or more races householders$60,525 Hispanic or Latino race householdersMedian 2022 house value $260,544 White Non-Hispanic householders$215,360 Black or African American householders$330,081 Some other race householders$86,848 Two or more races householders$301,621 Hispanic or Latino householders
Median age by race in Monroe
38.5 Median age for White residents35.8 40.1 24.9 Median age for Black or African American residents25.0 28.0 -668,032,786.2 Median age for American Indian / Alaska Native residents-662,121,211.5 -666,666,666.0 44.1 Median age for Asian residents70.4 35.8 -666,666,666.0 Median age for Native Hawaiian / Pacific Islander residents-666,666,666.0 -666,666,666.0 81.3 Median age for Other race residents-1,547,049,440.2 -929,765,885.4 25.4 Median age for Two or more races residents15.2 44.0 38.0 Median age for White alone residents31.7 39.6 51.1 Median age for Hispanic or Latino residents35.8 48.0
Owner/renter occupied households by race in Monroe
House owners and renters - White residents 1,086 48.3% Owner occupied1,160 51.7% Renter occupiedHouse owners and renters - Black or African American residents 562 30.8% Owner occupied1,261 69.2% Renter occupiedHouse owners and renters - Asian residents 53 64.7% Owner occupied29 35.3% Renter occupiedHouse owners and renters - Two or more races residents 75 28.4% Owner occupied190 71.6% Renter occupiedHouse owners and renters - White alone residents 1,028 47.5% Owner occupied1,135 52.5% Renter occupiedHouse owners and renters - Hispanic or Latino residents 89 61.9% Owner occupied55 38.1% Renter occupied
Language usage in Monroe
English speakers - Total 95.8% of residents of Monroe speak English at home.
2.1% of residents speak Spanish at home 210 73.4% Speak English very well76 26.6% Speak English less than very well1.8% of residents speak other language at home 195 80.2% Speak English very well48 19.8% Speak English less than very well
English speakers - Born in the United States 94.6% of residents of Monroe speak English at home.
4.0% of residents speak Spanish at home 105 76.6% Speak English very well32 23.4% Speak English less than very well1.3% of residents speak other language at home 45 100.0% Speak English very well
English speakers - Native, born elsewhere 0.0% of residents of Monroe speak English at home.
100.0% of residents speak Spanish at home 33 100.0% Speak English very well
English speakers - Foreign-born 50.2% of residents of Monroe speak English at home.
12.8% of residents speak Spanish at home 15 25.4% Speak English very well44 74.6% Speak English less than very well37.2% of residents speak other language at home 125 72.7% Speak English very well47 27.3% Speak English less than very well
White (Caucasian) - Speak another language Native:
1.0% (55)Foreign-born:
89.9% (57)
Black or African American - Speak only English Native:
98.1% (6,581)Foreign-born:
69.2% (177)
Black or African American - Speak another language Native:
1.8% (120)Foreign-born:
29.8% (76)
Two or more races - Speak only English Native:
90.3% (682)Foreign-born:
97.8% (25)
Two or more races - Speak another language Native:
10.1% (76)Foreign-born:
5.8% (1)
Hispanic or Latino - Speak another language Native:
15.0% (99)Foreign-born:
100.0% (81)
Foreign-born residents in Monroe 462 residents are foreign born (1.4% Latin America , 0.8% Asia , 0.4% Africa , 0.3% Europe ).
This city:
2.9%Georgia:
10.4%
Marital status for residents in Monroe Marital status - White (Caucasian) population 15 years and over
Males 30.5% Never married39.3% Now married3.7% Separated6.0% Widowed20.6% DivorcedFemales 31.8% Never married37.6% Now married1.7% Separated11.5% Widowed17.4% DivorcedWomen who gave birth in the past 12 months Now married:
65.1% (69)Unmarried:
34.9% (37)
Women who did not give birth in the past 12 months Now married:
41.2% (578)Unmarried:
58.8% (824)
Marital status - Black or African American population 15 years and over
Males 57.5% Never married27.2% Now married5.9% Separated0.9% Widowed8.5% DivorcedFemales 69.1% Never married7.6% Now married3.8% Separated10.1% Widowed9.4% DivorcedWomen who gave birth in the past 12 months Now married:
0.0% (0)Unmarried:
100.0% (23)
Women who did not give birth in the past 12 months Now married:
5.0% (115)Unmarried:
95.0% (2,194)
Marital status - Asian population 15 years and over
Males 0.0% Never married100.0% Now married0.0% Separated0.0% Widowed0.0% DivorcedFemales 0.0% Never married50.0% Now married0.0% Separated50.0% Widowed0.0% DivorcedWomen who gave birth in the past 12 months Now married:
100.0% (24)Unmarried:
0.0% (0)
Marital status - Other race population 15 years and over
Males 100.0% Never married0.0% Now married0.0% Separated0.0% Widowed0.0% DivorcedFemales 0.0% Never married0.0% Now married0.0% Separated100.0% Widowed0.0% DivorcedMarital status - Two or more races population 15 years and over
Males 85.4% Never married10.8% Now married0.0% Separated0.0% Widowed3.8% DivorcedFemales 49.4% Never married25.5% Now married0.0% Separated11.3% Widowed13.9% DivorcedWomen who did not give birth in the past 12 months Now married:
23.2% (65)Unmarried:
76.8% (216)
Marital status - White alone, not Hispanic / Latino population 15 years and over
Males 32.5% Never married40.5% Now married3.9% Separated6.4% Widowed16.7% DivorcedFemales 30.7% Never married38.7% Now married1.2% Separated12.1% Widowed17.3% DivorcedWomen who gave birth in the past 12 months Now married:
81.3% (59)Unmarried:
18.7% (14)
Women who did not give birth in the past 12 months Now married:
42.1% (562)Unmarried:
57.9% (773)
Marital status - Hispanic or Latino population 15 years and over
Males 26.0% Never married19.4% Now married0.0% Separated0.0% Widowed54.6% DivorcedFemales 55.7% Never married9.2% Now married6.3% Separated18.5% Widowed10.3% DivorcedWomen who gave birth in the past 12 months Now married:
29.4% (11)Unmarried:
70.6% (26)
Women who did not give birth in the past 12 months Now married:
11.8% (18)Unmarried:
88.2% (137)
Ancestries in Monroe
688 8.4% American349 4.3% Irish315 3.9% English104 1.3% European98 1.2% German96 1.2% Scotch-Irish68 0.8% Scottish48 0.6% African44 0.5% Jamaican20 0.2% British9 0.1% French Canadian6 0.07% Croatian
Children Nativity (place of birth) in Monroe
Children under 6 years - Living with two parents Both parents native 312 100.0% NativeChildren under 6 years - Living with one parent Native parent 1,428 100.0% NativeForeign-born parent 57 100.0% NativeChildren 6 to 17 years - Living with two parents Both parents native 315 100.0% NativeBoth parents foreign-born 35 100.0% Foreign-bornOne native, one foreign-born parent 58 100.0% NativeChildren 6 to 17 years - Living with one parent Native parent 2,314 100.0% NativeForeign-born parent 106 50.3% Native105 49.7% Foreign-born
Grandparents responsible for own grandchildren in Monroe
Grandparents (30 to 59 years) White / Caucasian 36 16.9% Responsible for grandchildren176 83.1% Not responsible for grandchildrenBlack or African American 109 100.0% Not responsible for grandchildrenAsian 11 100.0% Not responsible for grandchildrenWhite alone, not Hispanic / Latino 29 15.0% Responsible for grandchildren166 85.0% Not responsible for grandchildrenHispanic or Latino 11 100.0% Responsible for grandchildrenGrandparents (60 years and over) White / Caucasian 45 30.2% Responsible for grandchildren105 69.8% Not responsible for grandchildrenBlack or African American 233 82.6% Responsible for grandchildren49 17.4% Not responsible for grandchildrenWhite alone, not Hispanic / Latino 45 29.4% Responsible for grandchildren109 70.6% Not responsible for grandchildren