Races in Mokena, Illinois (IL) Detailed Stats
Data:
Races - White alone (%)
Races - White alone (% change since 2000)
Races - Black alone (%)
Races - Black alone (% change since 2000)
Races - American Indian alone (%)
Races - American Indian alone (% change since 2000)
Races - Asian alone (%)
Races - Asian alone (% change since 2000)
Races - Hispanic (%)
Races - Hispanic (% change since 2000)
Races - Native Hawaiian and Other Pacific Islander alone (%)
Races - Native Hawaiian and Other Pacific Islander alone (% change since 2000)
Races - Two or more races(%)
Races - Two or more races(% change since 2000)
Races - Other race alone (%)
Races - Other race alone (% change since 2000)
Racial diversity
Place of birth - Born in state of residence (%)
Place of birth - Born in state of residence (%) - White
Place of birth - Born in state of residence (%) - Black or African American
Place of birth - Born in state of residence (%) - Asian
Place of birth - Born in state of residence (%) - Hispanic or Latino
Place of birth - Born in state of residence (%) - American Indian and Alaska Native
Place of birth - Born in state of residence (%) - Multirace
Place of birth - Born in state of residence (%) - Other Race
Place of birth - Born in other state (%)
Place of birth - Born in other state (%) - White
Place of birth - Born in other state (%) - Black or African American
Place of birth - Born in other state (%) - Asian
Place of birth - Born in other state (%) - Hispanic or Latino
Place of birth - Born in other state (%) - American Indian and Alaska Native
Place of birth - Born in other state (%) - Multirace
Place of birth - Born in other state (%) - Other Race
Place of birth - Native, outside of US (%)
Place of birth - Native, outside of US (%) - White
Place of birth - Native, outside of US (%) - Black or African American
Place of birth - Native, outside of US (%) - Asian
Place of birth - Native, outside of US (%) - Hispanic or Latino
Place of birth - Native, outside of US (%) - American Indian and Alaska Native
Place of birth - Native, outside of US (%) - Multirace
Place of birth - Native, outside of US (%) - Other Race
Place of birth - Foreign born (%)
Place of birth - Foreign born (%) - White
Place of birth - Foreign born (%) - Black or African American
Place of birth - Foreign born (%) - Asian
Place of birth - Foreign born (%) - Hispanic or Latino
Place of birth - Foreign born (%) - American Indian and Alaska Native
Place of birth - Foreign born (%) - Multirace
Place of birth - Foreign born (%) - Other Race
Residents speaking English at home (%)
Residents speaking English at home - Born in the United States (%)
Residents speaking English at home - Native, born elsewhere (%)
Residents speaking English at home - Foreign born (%)
Residents speaking Spanish at home (%)
Residents speaking Spanish at home - Born in the United States (%)
Residents speaking Spanish at home - Native, born elsewhere (%)
Residents speaking Spanish at home - Foreign born (%)
Residents speaking other language at home (%)
Residents speaking other language at home - Born in the United States (%)
Residents speaking other language at home - Native, born elsewhere (%)
Residents speaking other language at home - Foreign born (%)
Marital status - Never married (%)
Marital status - Now married (%)
Marital status - Separated (%)
Marital status - Widowed (%)
Marital status - Divorced (%)
Ancestries Reported - Arab (%)
Ancestries Reported - Czech (%)
Ancestries Reported - Danish (%)
Ancestries Reported - Dutch (%)
Ancestries Reported - English (%)
Ancestries Reported - French (%)
Ancestries Reported - French Canadian (%)
Ancestries Reported - German (%)
Ancestries Reported - Greek (%)
Ancestries Reported - Hungarian (%)
Ancestries Reported - Irish (%)
Ancestries Reported - Italian (%)
Ancestries Reported - Lithuanian (%)
Ancestries Reported - Norwegian (%)
Ancestries Reported - Polish (%)
Ancestries Reported - Portuguese (%)
Ancestries Reported - Russian (%)
Ancestries Reported - Scotch-Irish (%)
Ancestries Reported - Scottish (%)
Ancestries Reported - Slovak (%)
Ancestries Reported - Subsaharan African (%)
Ancestries Reported - Swedish (%)
Ancestries Reported - Swiss (%)
Ancestries Reported - Ukrainian (%)
Ancestries Reported - United States (%)
Ancestries Reported - Welsh (%)
Ancestries Reported - West Indian (%)
Ancestries Reported - Other (%)
Geographical mobility - Same house 1 year ago (%)
Geographical mobility - Same house 1 year ago (%) - White
Geographical mobility - Same house 1 year ago (%) - Black or African American
Geographical mobility - Same house 1 year ago (%) - Asian
Geographical mobility - Same house 1 year ago (%) - Hispanic or Latino
Geographical mobility - Same house 1 year ago (%) - American Indian and Alaska Native
Geographical mobility - Same house 1 year ago (%) - Multirace
Geographical mobility - Same house 1 year ago (%) - Other Race
Geographical mobility - Moved within same county (%)
Geographical mobility - Moved within same county (%) - White
Geographical mobility - Moved within same county (%) - Black or African American
Geographical mobility - Moved within same county (%) - Asian
Geographical mobility - Moved within same county (%) - Hispanic or Latino
Geographical mobility - Moved within same county (%) - American Indian and Alaska Native
Geographical mobility - Moved within same county (%) - Multirace
Geographical mobility - Moved within same county (%) - Other Race
Geographical mobility - Moved from different county within same state (%)
Geographical mobility - Moved from different county within same state (%) - White
Geographical mobility - Moved from different county within same state (%) - Black or African American
Geographical mobility - Moved from different county within same state (%) - Asian
Geographical mobility - Moved from different county within same state (%) - Hispanic or Latino
Geographical mobility - Moved from different county within same state (%) - American Indian and Alaska Native
Geographical mobility - Moved from different county within same state (%) - Multirace
Geographical mobility - Moved from different county within same state (%) - Other Race
Geographical mobility - Moved from different state (%)
Geographical mobility - Moved from different state (%) - White
Geographical mobility - Moved from different state (%) - Black or African American
Geographical mobility - Moved from different state (%) - Asian
Geographical mobility - Moved from different state (%) - Hispanic or Latino
Geographical mobility - Moved from different state (%) - American Indian and Alaska Native
Geographical mobility - Moved from different state (%) - Multirace
Geographical mobility - Moved from different state (%) - Other Race
Geographical mobility - Moved from abroad (%)
Geographical mobility - Moved from abroad (%) - White
Geographical mobility - Moved from abroad (%) - Black or African American
Geographical mobility - Moved from abroad (%) - Asian
Geographical mobility - Moved from abroad (%) - Hispanic or Latino
Geographical mobility - Moved from abroad (%) - American Indian and Alaska Native
Geographical mobility - Moved from abroad (%) - Multirace
Geographical mobility - Moved from abroad (%) - Other Race
Place of birth for the foreign-born population - Ireland (%)
Place of birth for the foreign-born population - Denmark (%)
Place of birth for the foreign-born population - Norway (%)
Place of birth for the foreign-born population - Sweden (%)
Place of birth for the foreign-born population - United Kingdom (%)
Place of birth for the foreign-born population - England (%)
Place of birth for the foreign-born population - Scotland (%)
Place of birth for the foreign-born population - Other Northern Europe (%)
Place of birth for the foreign-born population - Austria (%)
Place of birth for the foreign-born population - Belgium (%)
Place of birth for the foreign-born population - France (%)
Place of birth for the foreign-born population - Germany (%)
Place of birth for the foreign-born population - Netherlands (%)
Place of birth for the foreign-born population - Switzerland (%)
Place of birth for the foreign-born population - Other Western Europe (%)
Place of birth for the foreign-born population - Greece (%)
Place of birth for the foreign-born population - Italy (%)
Place of birth for the foreign-born population - Portugal (%)
Place of birth for the foreign-born population - Spain (%)
Place of birth for the foreign-born population - Other Southern Europe (%)
Place of birth for the foreign-born population - Albania (%)
Place of birth for the foreign-born population - Belarus (%)
Place of birth for the foreign-born population - Bosnia and Herzegovina (%)
Place of birth for the foreign-born population - Bulgaria (%)
Place of birth for the foreign-born population - Croatia (%)
Place of birth for the foreign-born population - Czechoslovakia (%)
Place of birth for the foreign-born population - Hungary (%)
Place of birth for the foreign-born population - Latvia (%)
Place of birth for the foreign-born population - Lithuania (%)
Place of birth for the foreign-born population - North Macedonia (Macedonia) (%)
Place of birth for the foreign-born population - Moldova (%)
Place of birth for the foreign-born population - Poland (%)
Place of birth for the foreign-born population - Romania (%)
Place of birth for the foreign-born population - Russia (%)
Place of birth for the foreign-born population - Serbia (%)
Place of birth for the foreign-born population - Ukraine (%)
Place of birth for the foreign-born population - Other Eastern Europe (%)
Place of birth for the foreign-born population - China (%)
Place of birth for the foreign-born population - Hong Kong (%)
Place of birth for the foreign-born population - Taiwan (%)
Place of birth for the foreign-born population - Japan (%)
Place of birth for the foreign-born population - Korea (%)
Place of birth for the foreign-born population - Other Eastern Asia (%)
Place of birth for the foreign-born population - Afghanistan (%)
Place of birth for the foreign-born population - Bangladesh (%)
Place of birth for the foreign-born population - India (%)
Place of birth for the foreign-born population - Iran (%)
Place of birth for the foreign-born population - Kazakhstan (%)
Place of birth for the foreign-born population - Nepal (%)
Place of birth for the foreign-born population - Pakistan (%)
Place of birth for the foreign-born population - Sri Lanka (%)
Place of birth for the foreign-born population - Uzbekistan (%)
Place of birth for the foreign-born population - Other South Central Asia (%)
Place of birth for the foreign-born population - Burma (%)
Place of birth for the foreign-born population - Cambodia (%)
Place of birth for the foreign-born population - Indonesia (%)
Place of birth for the foreign-born population - Laos (%)
Place of birth for the foreign-born population - Malaysia (%)
Place of birth for the foreign-born population - Philippines (%)
Place of birth for the foreign-born population - Singapore (%)
Place of birth for the foreign-born population - Thailand (%)
Place of birth for the foreign-born population - Vietnam (%)
Place of birth for the foreign-born population - Other South Eastern Asia (%)
Place of birth for the foreign-born population - Armenia (%)
Place of birth for the foreign-born population - Iraq (%)
Place of birth for the foreign-born population - Israel (%)
Place of birth for the foreign-born population - Jordan (%)
Place of birth for the foreign-born population - Kuwait (%)
Place of birth for the foreign-born population - Lebanon (%)
Place of birth for the foreign-born population - Saudi Arabia (%)
Place of birth for the foreign-born population - Syria (%)
Place of birth for the foreign-born population - Turkey (%)
Place of birth for the foreign-born population - Yemen (%)
Place of birth for the foreign-born population - Other Western Asia (%)
Place of birth for the foreign-born population - Eritrea (%)
Place of birth for the foreign-born population - Ethiopia (%)
Place of birth for the foreign-born population - Kenya (%)
Place of birth for the foreign-born population - Somalia (%)
Place of birth for the foreign-born population - Uganda (%)
Place of birth for the foreign-born population - Zimbabwe (%)
Place of birth for the foreign-born population - Other Eastern Africa (%)
Place of birth for the foreign-born population - Cameroon (%)
Place of birth for the foreign-born population - Congo (%)
Place of birth for the foreign-born population - Democratic Republic of Congo (Zaire) (%)
Place of birth for the foreign-born population - Other Middle Africa (%)
Place of birth for the foreign-born population - Egypt (%)
Place of birth for the foreign-born population - Morocco (%)
Place of birth for the foreign-born population - Sudan (%)
Place of birth for the foreign-born population - Other Northern Africa (%)
Place of birth for the foreign-born population - South Africa (%)
Place of birth for the foreign-born population - Other Southern Africa (%)
Place of birth for the foreign-born population - Cabo Verde (%)
Place of birth for the foreign-born population - Ghana (%)
Place of birth for the foreign-born population - Liberia (%)
Place of birth for the foreign-born population - Nigeria (%)
Place of birth for the foreign-born population - Senegal (%)
Place of birth for the foreign-born population - Sierra Leone (%)
Place of birth for the foreign-born population - Other Western Africa (%)
Place of birth for the foreign-born population - Australia (%)
Place of birth for the foreign-born population - New Zealand (%)
Place of birth for the foreign-born population - Fiji (%)
Place of birth for the foreign-born population - Micronesia (%)
Place of birth for the foreign-born population - Bahamas (%)
Place of birth for the foreign-born population - Barbados (%)
Place of birth for the foreign-born population - Cuba (%)
Place of birth for the foreign-born population - Dominica (%)
Place of birth for the foreign-born population - Dominican Republic (%)
Place of birth for the foreign-born population - Grenada (%)
Place of birth for the foreign-born population - Haiti (%)
Place of birth for the foreign-born population - Jamaica (%)
Place of birth for the foreign-born population - St. Vincent and the Grenadines (%)
Place of birth for the foreign-born population - Trinidad and Tobago (%)
Place of birth for the foreign-born population - West Indies (%)
Place of birth for the foreign-born population - Other Caribbean (%)
Place of birth for the foreign-born population - Belize (%)
Place of birth for the foreign-born population - Costa Rica (%)
Place of birth for the foreign-born population - El Salvador (%)
Place of birth for the foreign-born population - Guatemala (%)
Place of birth for the foreign-born population - Honduras (%)
Place of birth for the foreign-born population - Mexico (%)
Place of birth for the foreign-born population - Nicaragua (%)
Place of birth for the foreign-born population - Panama (%)
Place of birth for the foreign-born population - Other Central America (%)
Place of birth for the foreign-born population - Argentina (%)
Place of birth for the foreign-born population - Bolivia (%)
Place of birth for the foreign-born population - Brazil (%)
Place of birth for the foreign-born population - Chile (%)
Place of birth for the foreign-born population - Colombia (%)
Place of birth for the foreign-born population - Ecuador (%)
Place of birth for the foreign-born population - Guyana (%)
Place of birth for the foreign-born population - Peru (%)
Place of birth for the foreign-born population - Uruguay (%)
Place of birth for the foreign-born population - Venezuela (%)
Place of birth for the foreign-born population - Other South America (%)
Place of birth for the foreign-born population - Canada (%)
Place of birth for the foreign-born population - Other Northern America (%)
Place of birth for the foreign-born population - Other (%)
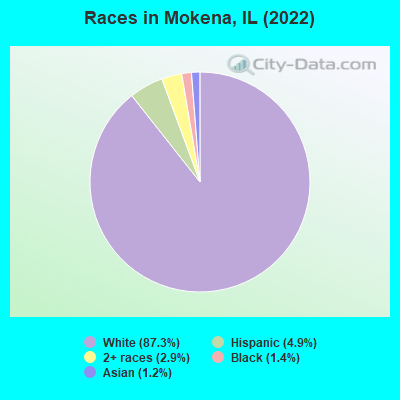
According to 2022 data, the most numerous races in Mokena, IL are White alone (17,366 residents), Hispanic (977 residents), and Black alone (279 residents). 93.7% of Mokena residents speak English at home. 2.3% of Mokena, IL residents are foreign-born (1.1% born in Europe, 0.7% born in Asia, 0.5% born in Latin America), which is 507.9% less than the foreign-born rate of 14.0% across the entire state of Illinois.
Race distribution in Mokena
2000 2022
8,424,140 67.8% White alone 1,856,152 14.9% Black alone 1,530,262 12.3% Hispanic 419,916 3.4% Asian alone 153,996 1.2% Two or more races 13,479 0.1% Other race alone 18,232 0.1% American Indian alone 3,116 0.03% Native Hawaiian and Other
7,356,301 58.5% White alone 2,299,726 18.3% Hispanic 1,660,423 13.2% Black alone 747,296 5.9% Asian alone 458,599 3.6% Two or more races 45,386 0.4% Other race alone 10,405 0.08% American Indian alone 3,896 0.03% Native Hawaiian and Other
Income and house value in Mokena Median household income in 2022 $113,606 White non-Hispanic householders$166,845 Black householders$145,193 Asian householders$121,812 Two or more races householders$91,229 Hispanic or Latino race householdersMedian 2022 house value $400,620 White Non-Hispanic householders$509,812 Black or African American householders $428,799 Asian householders$417,119 Some other race householders$463,466 Two or more races householders$413,968 Hispanic or Latino householders
Median age by race in Mokena
46.2 Median age for White residents43.8 48.2 49.7 Median age for Black or African American residents46.9 61.9 -801,714,897.4 Median age for American Indian / Alaska Native residents-764,890,281.4 -844,733,984.0 50.7 Median age for Asian residents54.8 35.1 -593,236,714.4 Median age for Native Hawaiian / Pacific Islander residents-658,536,584.7 -576,015,108.0 50.2 Median age for Other race residents31.6 -708,045,976.3 24.9 Median age for Two or more races residents24.8 32.8 45.5 Median age for White alone residents43.4 47.5 29.5 Median age for Hispanic or Latino residents24.4 33.0
Owner/renter occupied households by race in Mokena
House owners and renters - White residents 6,154 93.5% Owner occupied430 6.5% Renter occupiedHouse owners and renters - Black or African American residents 80 81.9% Owner occupied18 18.1% Renter occupiedHouse owners and renters - Asian residents 42 66.0% Owner occupied22 34.0% Renter occupiedHouse owners and renters - Other race residents 28 100.0% Renter occupiedHouse owners and renters - Two or more races residents 271 65.1% Owner occupied145 34.9% Renter occupiedHouse owners and renters - White alone residents 6,190 93.2% Owner occupied455 6.8% Renter occupiedHouse owners and renters - Hispanic or Latino residents 172 59.7% Owner occupied116 40.3% Renter occupied
Language usage in Mokena
English speakers - Total 93.7% of residents of Mokena speak English at home.
2.0% of residents speak Spanish at home 365 97.6% Speak English very well9 2.4% Speak English less than very well2.5% of residents speak other language at home 345 73.7% Speak English very well123 26.3% Speak English less than very well
English speakers - Born in the United States 93.2% of residents of Mokena speak English at home.
6.0% of residents speak Spanish at home 123 100.0% Speak English very well
English speakers - Native, born elsewhere 92.0% of residents of Mokena speak English at home.
37.0% of residents speak other language at home 37 100.0% Speak English less than very well
English speakers - Foreign-born 26.8% of residents of Mokena speak English at home.
18.3% of residents speak Spanish at home 83 90.2% Speak English very well9 9.8% Speak English less than very well55.9% of residents speak other language at home 186 66.2% Speak English very well95 33.8% Speak English less than very well
White (Caucasian) - Speak only English Native:
99.8% (15,979)Foreign-born:
47.3% (115)
White (Caucasian) - Speak another language Native:
1.5% (244)Foreign-born:
57.1% (139)
Black or African American - Speak another language Native:
7.9% (24)Foreign-born:
100.0% (2)
Asian - Speak only English Native:
50.1% (56)Foreign-born:
8.5% (10)
Asian - Speak another language Native:
49.9% (56)Foreign-born:
92.2% (107)
Two or more races - Speak only English Native:
95.1% (767)Foreign-born:
12.6% (10)
White alone - Speak only English Native:
98.8% (16,053)Foreign-born:
48.1% (115)
White alone - Speak another language Native:
1.1% (180)Foreign-born:
50.8% (122)
Hispanic or Latino - Speak only English Native:
72.3% (486)Foreign-born:
18.9% (20)
Hispanic or Latino - Speak another language Native:
29.2% (197)Foreign-born:
81.3% (87)
Foreign-born residents in Mokena 458 residents are foreign born (1.1% Europe , 0.7% Asia , 0.5% Latin America ).
This city:
2.3%Illinois:
14.1%
Marital status for residents in Mokena Marital status - White (Caucasian) population 15 years and over
Males 27.3% Never married63.9% Now married0.5% Separated1.8% Widowed6.5% DivorcedFemales 23.5% Never married62.2% Now married0.3% Separated7.6% Widowed6.4% DivorcedWomen who gave birth in the past 12 months Now married:
94.8% (147)Unmarried:
5.2% (8)
Women who did not give birth in the past 12 months Now married:
48.1% (1,422)Unmarried:
51.9% (1,534)
Marital status - Black or African American population 15 years and over
Males 30.7% Never married69.3% Now married0.0% Separated0.0% Widowed0.0% DivorcedFemales 47.2% Never married34.7% Now married0.0% Separated0.0% Widowed18.1% DivorcedWomen who did not give birth in the past 12 months Now married:
15.8% (9)Unmarried:
84.2% (49)
Marital status - Asian population 15 years and over
Males 0.0% Never married25.7% Now married0.0% Separated22.9% Widowed51.4% DivorcedFemales 10.5% Never married89.5% Now married0.0% Separated0.0% Widowed0.0% DivorcedWomen who did not give birth in the past 12 months Now married:
84.4% (70)Unmarried:
15.6% (13)
Marital status - Other race population 15 years and over
Males 52.9% Never married25.5% Now married0.0% Separated0.0% Widowed21.6% DivorcedFemales 0.0% Never married100.0% Now married0.0% Separated0.0% Widowed0.0% DivorcedMarital status - Two or more races population 15 years and over
Males 53.8% Never married40.3% Now married0.0% Separated2.6% Widowed3.3% DivorcedFemales 22.9% Never married61.8% Now married0.0% Separated15.3% Widowed0.0% DivorcedWomen who gave birth in the past 12 months Now married:
100.0% (35)Unmarried:
0.0% (0)
Women who did not give birth in the past 12 months Now married:
60.0% (128)Unmarried:
40.0% (85)
Marital status - White alone, not Hispanic / Latino population 15 years and over
Males 27.1% Never married63.9% Now married0.5% Separated1.9% Widowed6.6% DivorcedFemales 23.2% Never married62.2% Now married0.3% Separated7.7% Widowed6.5% DivorcedWomen who gave birth in the past 12 months Now married:
93.2% (116)Unmarried:
6.8% (9)
Women who did not give birth in the past 12 months Now married:
48.6% (1,466)Unmarried:
51.4% (1,549)
Marital status - Hispanic or Latino population 15 years and over
Males 50.7% Never married42.3% Now married0.0% Separated0.0% Widowed7.0% DivorcedFemales 22.9% Never married66.2% Now married0.0% Separated8.6% Widowed2.3% DivorcedWomen who gave birth in the past 12 months Now married:
100.0% (71)Unmarried:
0.0% (0)
Women who did not give birth in the past 12 months Now married:
41.3% (65)Unmarried:
58.7% (93)
Ancestries in Mokena
1,281 20.6% Polish1,180 19.0% Irish769 12.4% German466 7.5% Italian408 6.6% Dutch382 6.1% American146 2.3% English145 2.3% Norwegian99 1.6% Lithuanian97 1.6% European74 1.2% Scottish70 1.1% Swedish51 0.8% British44 0.7% Russian39 0.6% Greek33 0.5% Eastern European32 0.5% Dutch West Indian30 0.5% Haitian26 0.4% African22 0.4% Croatian21 0.3% French Canadian20 0.3% Austrian20 0.3% Northern European19 0.3% Slovak11 0.2% Czechoslovakian10 0.2% Czech9 0.1% Scandinavian9 0.1% Slovene7 0.1% Canadian7 0.1% French7 0.1% Hungarian6 0.10% Alsatian
Children Nativity (place of birth) in Mokena
Children under 6 years - Living with two parents Both parents native 1,158 100.0% NativeOne native, one foreign-born parent 15 100.0% NativeChildren under 6 years - Living with one parent Native parent 113 100.0% NativeChildren 6 to 17 years - Living with two parents Both parents native 2,078 98.0% Native43 2.0% Foreign-bornBoth parents foreign-born 113 100.0% NativeOne native, one foreign-born parent 92 100.0% NativeChildren 6 to 17 years - Living with one parent Native parent 518 100.0% NativeForeign-born parent 25 47.4% Native28 52.6% Foreign-born
Grandparents responsible for own grandchildren in Mokena
Grandparents (30 to 59 years) White / Caucasian 12 45.2% Responsible for grandchildren14 54.8% Not responsible for grandchildrenAsian 6 100.0% Responsible for grandchildrenWhite alone, not Hispanic / Latino 16 47.6% Responsible for grandchildren18 52.4% Not responsible for grandchildrenGrandparents (60 years and over) White / Caucasian 20 15.5% Responsible for grandchildren111 84.5% Not responsible for grandchildrenAsian 3 100.0% Responsible for grandchildrenWhite alone, not Hispanic / Latino 22 16.3% Responsible for grandchildren115 83.7% Not responsible for grandchildren