Races in Moberly, Missouri (MO) Detailed Stats
Ancestries, Foreign-born residents, place of birth
Settings
X


Recent posts about races in Moberly, Missouri on our local forum with over 2,400,000 registered users:
 | Thoughts on Moberly? (8 replies) |
| Missouri Outlaw History (3407 replies) |
| Interesting Missouri facts. (1186 replies) |
| Moberly, MO (4 replies) |
| Help me find an inexpensive, rural MO town (113 replies) |
| I need help in Moberly MO!!!!!!!!!!!!!!!!!!!!!!!! (5 replies) |
Latest news about races in Moberly, MO collected exclusively by city-data.com from local newspapers, TV, and radio stations
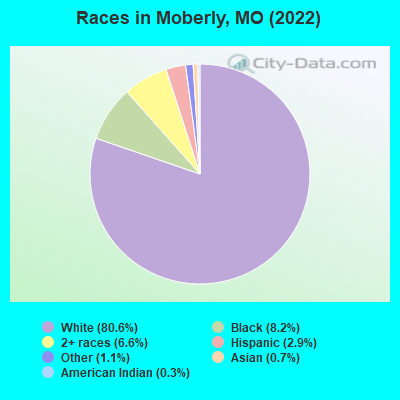
According to 2022 data, the most numerous races in Moberly, MO are White alone (11,093 residents), Black alone (1,128 residents), and Two or more races (905 residents). 98.6% of Moberly residents speak English at home. 1.3% of Moberly, MO residents are foreign-born , which is 205.8% less than the foreign-born rate of 4.0% across the entire state of Missouri.
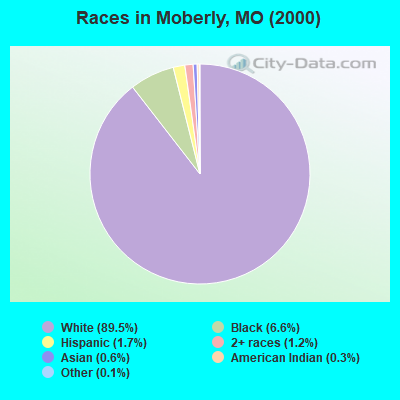
Race distribution in Moberly
2000
2022

- 10,69589.5%White alone
- 7906.6%Black alone
- 1991.7%Hispanic
- 1391.2%Two or more races
- 710.6%Asian alone
- 350.3%American Indian alone
- 140.1%Other race alone
- 20.02%Native Hawaiian and Other
Pacific Islander alone
-
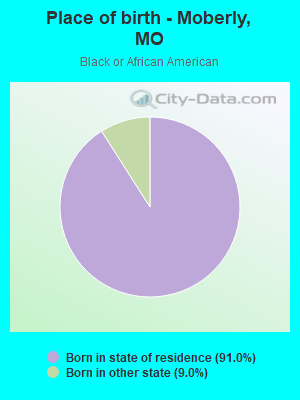
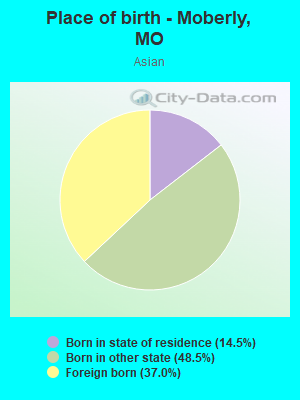
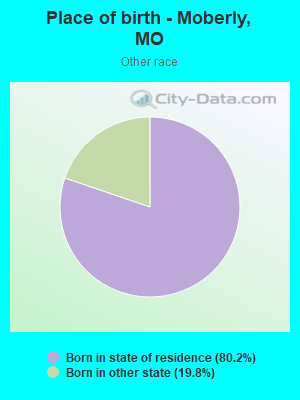
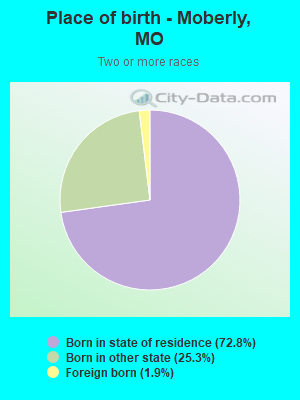
- 11,09380.6%White alone
- 1,1288.2%Black alone
- 9056.6%Two or more races
- 3982.9%Hispanic
- 1561.1%Other race alone
- 900.7%Asian alone
- 440.3%American Indian alone
- 40.03%Native Hawaiian and Other
Pacific Islander alone
2000
2022
-
- 4,686,47483.8%White alone
- 625,66711.2%Black alone
- 118,5922.1%Hispanic
- 71,9051.3%Two or more races
- 61,0411.1%Asian alone
- 23,3020.4%American Indian alone
- 5,2910.09%Other race alone
- 2,9390.05%Native Hawaiian and Other
Pacific Islander alone

-
- 4,733,41176.6%White alone
- 656,73910.6%Black alone
- 316,3005.1%Two or more races
- 291,7634.7%Hispanic
- 132,4362.1%Asian alone
- 27,4670.4%Other race alone
- 12,3130.2%American Indian alone
- 7,5280.1%Native Hawaiian and Other
Pacific Islander alone

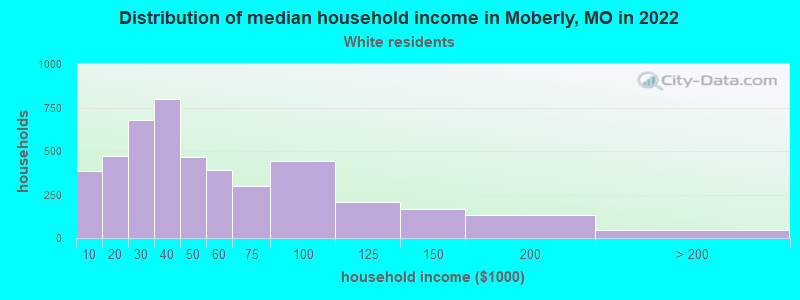
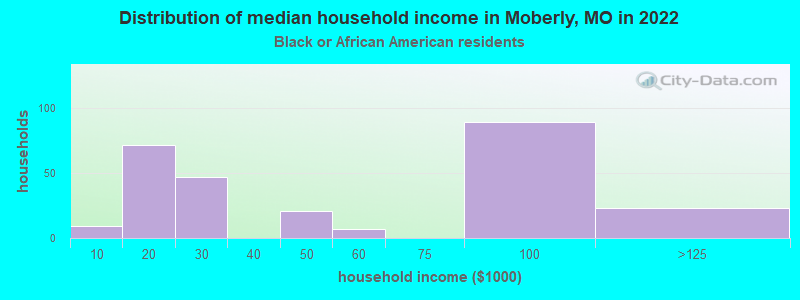
Income and house value in Moberly
- Median household income in 2022
- $37,711White non-Hispanic householders
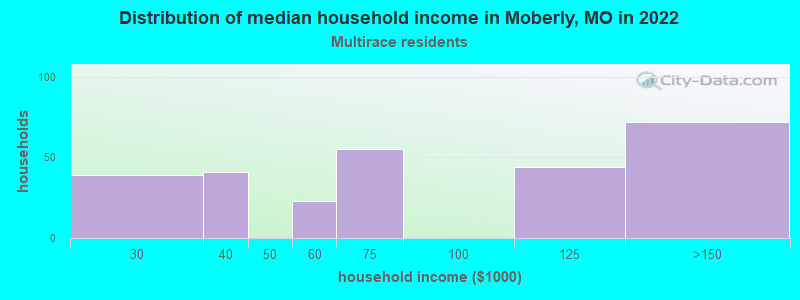
- $71,896Two or more races householders
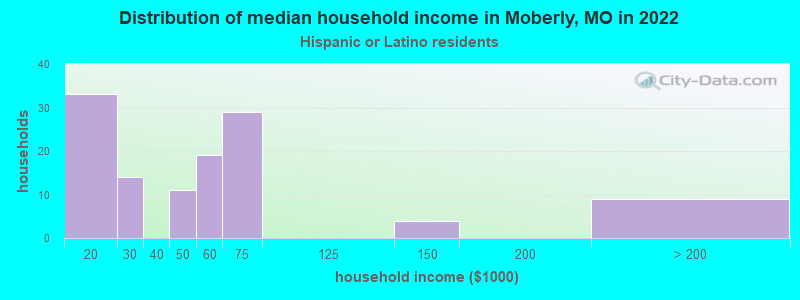
- $51,209Hispanic or Latino race householders
- Median 2022 house value
- $150,809White Non-Hispanic householders
- $119,093Black or African American householders
- $116,605American Indian or Alaska Native householders
- $328,361Asian householders
- $202,116Some other race householders
- $125,933Two or more races householders
- $202,116Hispanic or Latino householders
Household income for White non-Hispanic householders
Household income for Black householders
Household income for Some other race householders
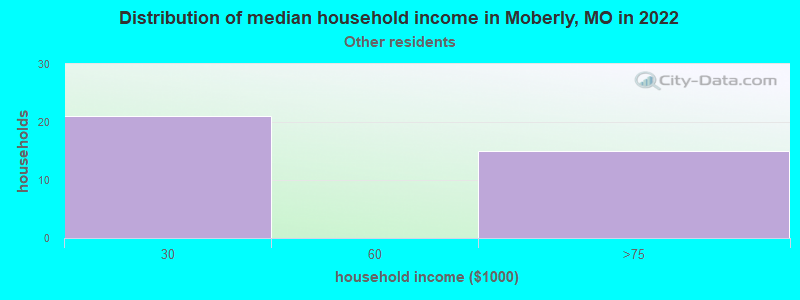
Household income for Two or more races householders
Household income for Hispanic or Latino race householders
Median age by race in Moberly
- 38.4Median age for White residents
- 36.0Males
- 40.9Females
- 40.8Median age for Black or African American residents
- 38.7Males
- 65.3Females
- 51.9Median age for American Indian / Alaska Native residents
- -652,291,104.5Males
- -576,856,648.8Females
- 35.6Median age for Asian residents
- 2.8Males
- 40.7Females
- -693,430,656.2Median age for Native Hawaiian / Pacific Islander residents
- -683,513,838.1Males
- -752,136,751.4Females
- 17.8Median age for Other race residents
- 1.9Males
- -684,343,433.7Females
- 13.5Median age for Two or more races residents
- 13.9Males
- 10.9Females
- 38.7Median age for White alone residents
- 36.4Males
- 40.9Females
- 26.5Median age for Hispanic or Latino residents
- 22.9Males
- 26.4Females
Owner/renter occupied households by race in Moberly
- House owners and renters - White residents
- 2,29851.7%Owner occupied
- 2,14948.3%Renter occupied
- House owners and renters - Black or African American residents
- 17259.1%Owner occupied
- 11940.9%Renter occupied
- House owners and renters - Asian residents
- 9100.0%Renter occupied
- House owners and renters - Other race residents
- 1858.8%Owner occupied
- 1341.2%Renter occupied
- House owners and renters - Two or more races residents
- 21776.6%Owner occupied
- 6623.4%Renter occupied
- House owners and renters - White alone residents
- 2,29752.2%Owner occupied
- 2,10147.8%Renter occupied
- House owners and renters - Hispanic or Latino residents
- 3126.9%Owner occupied
- 8573.1%Renter occupied
Language usage in Moberly
- English speakers - Total
- 98.6% of residents of Moberly speak English at home.
- 0.6% of residents speak Spanish at home
- 7192.2%Speak English very well
- 67.8%Speak English less than very well
- 0.8% of residents speak other language at home
- 8081.6%Speak English very well
- 1818.4%Speak English less than very well
- English speakers - Born in the United States
- 97.9% of residents of Moberly speak English at home.
- 1.4% of residents speak Spanish at home
- 39100.0%Speak English very well
- 0.5% of residents speak other language at home
- 14100.0%Speak English very well
All residents speak only English at home
- English speakers - Foreign-born
- 53.6% of residents of Moberly speak English at home.
- 16.0% of residents speak Spanish at home
- 2379.3%Speak English very well
- 620.7%Speak English less than very well
- 26.5% of residents speak other language at home
- 4185.4%Speak English very well
- 714.6%Speak English less than very well
White (Caucasian) - Speak only English
| Native: | 100.0% (10,662) |
| Foreign-born: | 79.8% (82) |
White (Caucasian) - Speak another language
| Native: | 0.2% (17) |
| Foreign-born: | 21.8% (23) |
Asian - Speak another language
| Native: | 47.2% (16) |
| Foreign-born: | 100.0% (36) |
Two or more races - Speak another language
| Native: | 4.7% (41) |
| Foreign-born: | 100.0% (20) |
White alone - Speak only English
| Native: | 99.8% (10,513) |
| Foreign-born: | 87.5% (74) |
Hispanic or Latino - Speak only English
| Native: | 86.2% (269) |
| Foreign-born: | 30.0% (13) |
Hispanic or Latino - Speak another language
| Native: | 15.0% (47) |
| Foreign-born: | 71.0% (30) |
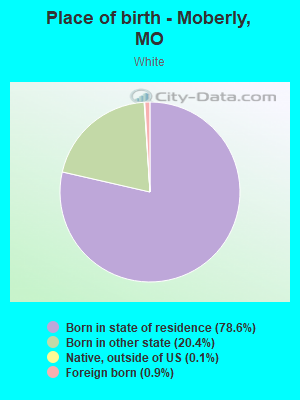
Foreign-born residents in Moberly
180 residents are foreign born
| This city: | 1.3% |
| Missouri: | 4.2% |

Marital status for residents in Moberly
Marital status - White (Caucasian) population 15 years and over
- Males
- 40.4%Never married
- 38.5%Now married
- 2.1%Separated
- 2.2%Widowed
- 16.8%Divorced
- Females
- 28.5%Never married
- 32.3%Now married
- 1.9%Separated
- 14.6%Widowed
- 22.7%Divorced
Women who gave birth in the past 12 months
| Now married: | 38.3% (58) |
| Unmarried: | 61.7% (93) |
Women who did not give birth in the past 12 months
| Now married: | 31.3% (746) |
| Unmarried: | 68.7% (1,640) |
Marital status - Black or African American population 15 years and over
- Males
- 65.3%Never married
- 15.5%Now married
- 4.6%Separated
- 3.1%Widowed
- 11.4%Divorced
- Females
- 51.2%Never married
- 9.6%Now married
- 0.0%Separated
- 20.8%Widowed
- 18.4%Divorced
Women who did not give birth in the past 12 months
| Now married: | 0.0% (0) |
| Unmarried: | 100.0% (46) |
Marital status - American Indian / Alaska Native population 15 years and over
- Males
- 0.0%Never married
- 56.0%Now married
- 0.0%Separated
- 0.0%Widowed
- 44.0%Divorced
- Females
- 100.0%Never married
- 0.0%Now married
- 0.0%Separated
- 0.0%Widowed
- 0.0%Divorced
Women who did not give birth in the past 12 months
| Now married: | 0.0% (0) |
| Unmarried: | 100.0% (21) |
Marital status - Asian population 15 years and over
- Males
- 100.0%Never married
- 0.0%Now married
- 0.0%Separated
- 0.0%Widowed
- 0.0%Divorced
- Females
- 0.0%Never married
- 84.3%Now married
- 0.0%Separated
- 0.0%Widowed
- 15.7%Divorced
Women who did not give birth in the past 12 months
| Now married: | 100.0% (32) |
| Unmarried: | 0.0% (0) |
Marital status - Other race population 15 years and over
- Males
- 100.0%Never married
- 0.0%Now married
- 0.0%Separated
- 0.0%Widowed
- 0.0%Divorced
- Females
- 44.0%Never married
- 56.0%Now married
- 0.0%Separated
- 0.0%Widowed
- 0.0%Divorced
Women who gave birth in the past 12 months
| Now married: | 0.0% (0) |
| Unmarried: | 100.0% (13) |
Marital status - Two or more races population 15 years and over
- Males
- 28.4%Never married
- 41.8%Now married
- 6.5%Separated
- 0.0%Widowed
- 23.4%Divorced
- Females
- 50.0%Never married
- 0.0%Now married
- 0.0%Separated
- 44.4%Widowed
- 5.6%Divorced
Women who gave birth in the past 12 months
| Now married: | 0.0% (0) |
| Unmarried: | 100.0% (21) |
Women who did not give birth in the past 12 months
| Now married: | 0.0% (0) |
| Unmarried: | 100.0% (90) |
Marital status - White alone, not Hispanic / Latino population 15 years and over
- Males
- 39.3%Never married
- 39.3%Now married
- 2.1%Separated
- 2.3%Widowed
- 17.0%Divorced
- Females
- 28.2%Never married
- 32.3%Now married
- 1.9%Separated
- 14.8%Widowed
- 22.7%Divorced
Women who gave birth in the past 12 months
| Now married: | 38.3% (58) |
| Unmarried: | 61.7% (94) |
Women who did not give birth in the past 12 months
| Now married: | 31.0% (726) |
| Unmarried: | 69.0% (1,619) |
Marital status - Hispanic or Latino population 15 years and over
- Males
- 78.5%Never married
- 12.3%Now married
- 0.0%Separated
- 0.0%Widowed
- 9.2%Divorced
- Females
- 49.6%Never married
- 35.9%Now married
- 0.0%Separated
- 0.0%Widowed
- 14.5%Divorced
Women who gave birth in the past 12 months
| Now married: | 0.0% (0) |
| Unmarried: | 100.0% (12) |
Women who did not give birth in the past 12 months
| Now married: | 37.3% (31) |
| Unmarried: | 62.7% (51) |
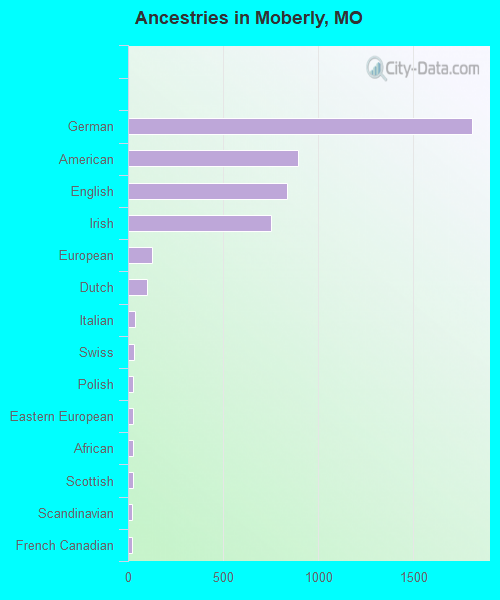
Ancestries in Moberly

- 1,80927.1%German
- 89313.4%American
- 83812.5%English
- 75111.2%Irish
- 1271.9%European
- 991.5%Dutch
- 350.5%Italian
- 330.5%Swiss
- 280.4%Polish
- 260.4%Eastern European
- 260.4%African
- 240.4%Scottish
- 210.3%Scandinavian
- 200.3%French Canadian
- 150.2%Welsh
- 130.2%Swedish
- 120.2%Belgian
- 90.1%French
- 80.1%Norwegian
- 70.1%Northern European
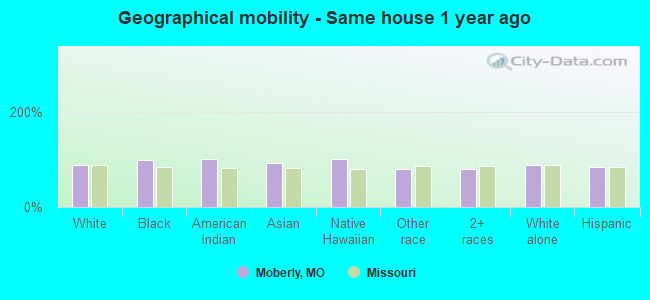
Geographical mobility in Moberly

- Same house 1 year ago
- 9,87888.3%White (Caucasian)
- 1,10898.3%Black or African American
- 45100.0%American Indian / Alaska Native
- 8492.0%Asian
- 5100.0%Native Hawaiian / Pacific Islander
- 13479.6%Other race
- 82280.3%Two or more races
- 9,70588.2%White alone, not Hispanic / Latino
- 33784.4%Hispanic or Latino
-
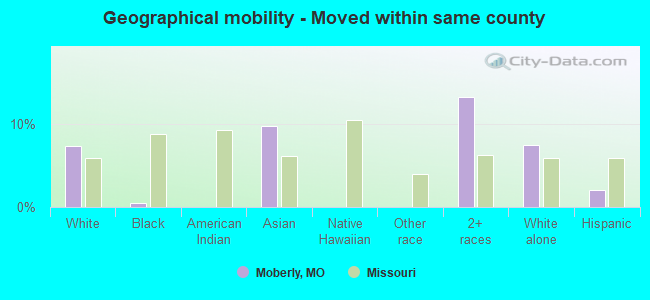
- Moved within same county
- 8207.3%White / Caucasian
- 50.4%Black or African American
- 99.8%Asian
- 13713.4%Two or more races
- 8257.5%White alone, not Hispanic / Latino
- 82.0%Hispanic or Latino
-
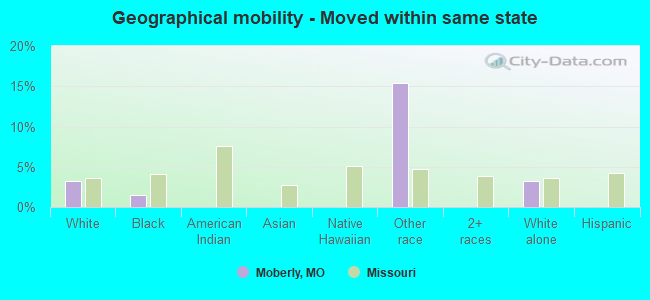
- Moved within same state
- 3593.2%White / Caucasian
- 171.5%Black or African American
- 2615.5%Other race
- 3613.3%White alone, not Hispanic / Latino
-
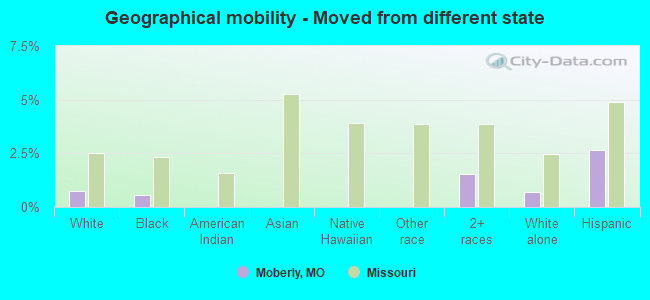
- Moved from different state
- 840.8%White / Caucasian
- 60.6%Black or African American
- 161.5%Two or more races
- 760.7%White alone, not Hispanic / Latino
- 112.6%Hispanic or Latino
-
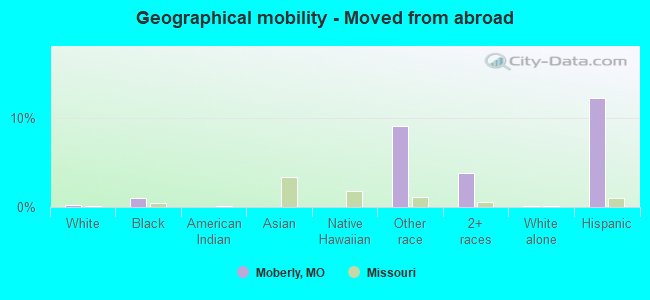
- Moved from abroad
- 200.2%White
- 111.0%Black or African American
- 159.0%Other race
- 393.8%Two or more races
- 150.1%White alone, not Hispanic / Latino
- 4912.2%Hispanic or Latino
Children Nativity (place of birth) in Moberly
Place of birth for residents in Moberly
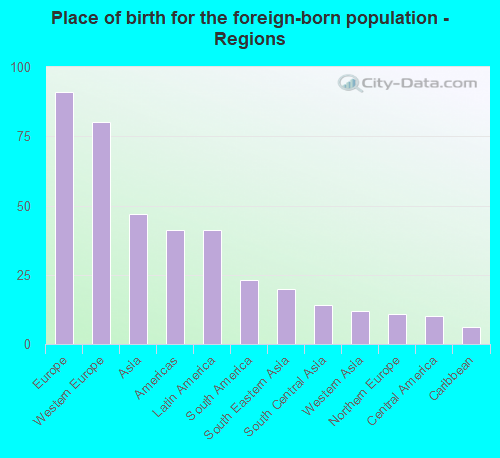
![Place of birth for the foreign-born population - Regions]()
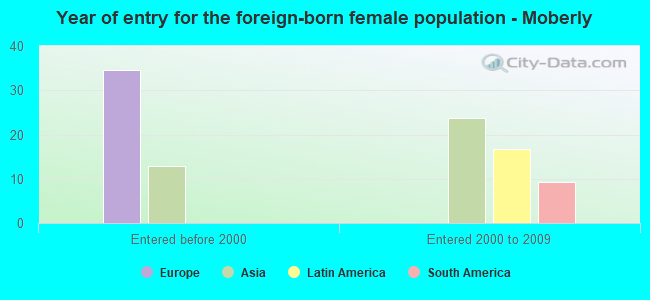
- 91Europe
- 80Western Europe
- 47Asia
- 41Americas
- 41Latin America
- 23South America
- 20South Eastern Asia
- 14South Central Asia
- 12Western Asia
- 11Northern Europe
- 10Central America
- 6Caribbean
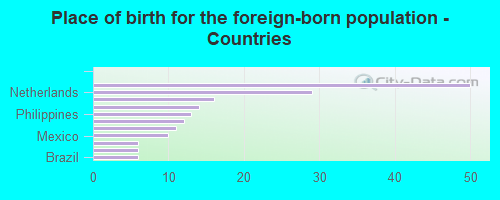
![Place of birth for the foreign-born population - Countries]()
- 50Germany
- 29Netherlands
- 16Colombia
- 14India
- 13Philippines
- 12Iraq
- 11England
- 10Mexico
- 6Indonesia
- 6Cuba
- 6Brazil
Grandparents responsible for own grandchildren in Moberly
Zip codes: 65270.