Races in Milledgeville, Georgia (GA) Detailed Stats
Data:
Races - White alone (%)
Races - White alone (% change since 2000)
Races - Black alone (%)
Races - Black alone (% change since 2000)
Races - American Indian alone (%)
Races - American Indian alone (% change since 2000)
Races - Asian alone (%)
Races - Asian alone (% change since 2000)
Races - Hispanic (%)
Races - Hispanic (% change since 2000)
Races - Native Hawaiian and Other Pacific Islander alone (%)
Races - Native Hawaiian and Other Pacific Islander alone (% change since 2000)
Races - Two or more races(%)
Races - Two or more races(% change since 2000)
Races - Other race alone (%)
Races - Other race alone (% change since 2000)
Racial diversity
Place of birth - Born in state of residence (%)
Place of birth - Born in state of residence (%) - White
Place of birth - Born in state of residence (%) - Black or African American
Place of birth - Born in state of residence (%) - Asian
Place of birth - Born in state of residence (%) - Hispanic or Latino
Place of birth - Born in state of residence (%) - American Indian and Alaska Native
Place of birth - Born in state of residence (%) - Multirace
Place of birth - Born in state of residence (%) - Other Race
Place of birth - Born in other state (%)
Place of birth - Born in other state (%) - White
Place of birth - Born in other state (%) - Black or African American
Place of birth - Born in other state (%) - Asian
Place of birth - Born in other state (%) - Hispanic or Latino
Place of birth - Born in other state (%) - American Indian and Alaska Native
Place of birth - Born in other state (%) - Multirace
Place of birth - Born in other state (%) - Other Race
Place of birth - Native, outside of US (%)
Place of birth - Native, outside of US (%) - White
Place of birth - Native, outside of US (%) - Black or African American
Place of birth - Native, outside of US (%) - Asian
Place of birth - Native, outside of US (%) - Hispanic or Latino
Place of birth - Native, outside of US (%) - American Indian and Alaska Native
Place of birth - Native, outside of US (%) - Multirace
Place of birth - Native, outside of US (%) - Other Race
Place of birth - Foreign born (%)
Place of birth - Foreign born (%) - White
Place of birth - Foreign born (%) - Black or African American
Place of birth - Foreign born (%) - Asian
Place of birth - Foreign born (%) - Hispanic or Latino
Place of birth - Foreign born (%) - American Indian and Alaska Native
Place of birth - Foreign born (%) - Multirace
Place of birth - Foreign born (%) - Other Race
Residents speaking English at home (%)
Residents speaking English at home - Born in the United States (%)
Residents speaking English at home - Native, born elsewhere (%)
Residents speaking English at home - Foreign born (%)
Residents speaking Spanish at home (%)
Residents speaking Spanish at home - Born in the United States (%)
Residents speaking Spanish at home - Native, born elsewhere (%)
Residents speaking Spanish at home - Foreign born (%)
Residents speaking other language at home (%)
Residents speaking other language at home - Born in the United States (%)
Residents speaking other language at home - Native, born elsewhere (%)
Residents speaking other language at home - Foreign born (%)
Marital status - Never married (%)
Marital status - Now married (%)
Marital status - Separated (%)
Marital status - Widowed (%)
Marital status - Divorced (%)
Ancestries Reported - Arab (%)
Ancestries Reported - Czech (%)
Ancestries Reported - Danish (%)
Ancestries Reported - Dutch (%)
Ancestries Reported - English (%)
Ancestries Reported - French (%)
Ancestries Reported - French Canadian (%)
Ancestries Reported - German (%)
Ancestries Reported - Greek (%)
Ancestries Reported - Hungarian (%)
Ancestries Reported - Irish (%)
Ancestries Reported - Italian (%)
Ancestries Reported - Lithuanian (%)
Ancestries Reported - Norwegian (%)
Ancestries Reported - Polish (%)
Ancestries Reported - Portuguese (%)
Ancestries Reported - Russian (%)
Ancestries Reported - Scotch-Irish (%)
Ancestries Reported - Scottish (%)
Ancestries Reported - Slovak (%)
Ancestries Reported - Subsaharan African (%)
Ancestries Reported - Swedish (%)
Ancestries Reported - Swiss (%)
Ancestries Reported - Ukrainian (%)
Ancestries Reported - United States (%)
Ancestries Reported - Welsh (%)
Ancestries Reported - West Indian (%)
Ancestries Reported - Other (%)
Geographical mobility - Same house 1 year ago (%)
Geographical mobility - Same house 1 year ago (%) - White
Geographical mobility - Same house 1 year ago (%) - Black or African American
Geographical mobility - Same house 1 year ago (%) - Asian
Geographical mobility - Same house 1 year ago (%) - Hispanic or Latino
Geographical mobility - Same house 1 year ago (%) - American Indian and Alaska Native
Geographical mobility - Same house 1 year ago (%) - Multirace
Geographical mobility - Same house 1 year ago (%) - Other Race
Geographical mobility - Moved within same county (%)
Geographical mobility - Moved within same county (%) - White
Geographical mobility - Moved within same county (%) - Black or African American
Geographical mobility - Moved within same county (%) - Asian
Geographical mobility - Moved within same county (%) - Hispanic or Latino
Geographical mobility - Moved within same county (%) - American Indian and Alaska Native
Geographical mobility - Moved within same county (%) - Multirace
Geographical mobility - Moved within same county (%) - Other Race
Geographical mobility - Moved from different county within same state (%)
Geographical mobility - Moved from different county within same state (%) - White
Geographical mobility - Moved from different county within same state (%) - Black or African American
Geographical mobility - Moved from different county within same state (%) - Asian
Geographical mobility - Moved from different county within same state (%) - Hispanic or Latino
Geographical mobility - Moved from different county within same state (%) - American Indian and Alaska Native
Geographical mobility - Moved from different county within same state (%) - Multirace
Geographical mobility - Moved from different county within same state (%) - Other Race
Geographical mobility - Moved from different state (%)
Geographical mobility - Moved from different state (%) - White
Geographical mobility - Moved from different state (%) - Black or African American
Geographical mobility - Moved from different state (%) - Asian
Geographical mobility - Moved from different state (%) - Hispanic or Latino
Geographical mobility - Moved from different state (%) - American Indian and Alaska Native
Geographical mobility - Moved from different state (%) - Multirace
Geographical mobility - Moved from different state (%) - Other Race
Geographical mobility - Moved from abroad (%)
Geographical mobility - Moved from abroad (%) - White
Geographical mobility - Moved from abroad (%) - Black or African American
Geographical mobility - Moved from abroad (%) - Asian
Geographical mobility - Moved from abroad (%) - Hispanic or Latino
Geographical mobility - Moved from abroad (%) - American Indian and Alaska Native
Geographical mobility - Moved from abroad (%) - Multirace
Geographical mobility - Moved from abroad (%) - Other Race
Place of birth for the foreign-born population - Ireland (%)
Place of birth for the foreign-born population - Denmark (%)
Place of birth for the foreign-born population - Norway (%)
Place of birth for the foreign-born population - Sweden (%)
Place of birth for the foreign-born population - United Kingdom (%)
Place of birth for the foreign-born population - England (%)
Place of birth for the foreign-born population - Scotland (%)
Place of birth for the foreign-born population - Other Northern Europe (%)
Place of birth for the foreign-born population - Austria (%)
Place of birth for the foreign-born population - Belgium (%)
Place of birth for the foreign-born population - France (%)
Place of birth for the foreign-born population - Germany (%)
Place of birth for the foreign-born population - Netherlands (%)
Place of birth for the foreign-born population - Switzerland (%)
Place of birth for the foreign-born population - Other Western Europe (%)
Place of birth for the foreign-born population - Greece (%)
Place of birth for the foreign-born population - Italy (%)
Place of birth for the foreign-born population - Portugal (%)
Place of birth for the foreign-born population - Spain (%)
Place of birth for the foreign-born population - Other Southern Europe (%)
Place of birth for the foreign-born population - Albania (%)
Place of birth for the foreign-born population - Belarus (%)
Place of birth for the foreign-born population - Bosnia and Herzegovina (%)
Place of birth for the foreign-born population - Bulgaria (%)
Place of birth for the foreign-born population - Croatia (%)
Place of birth for the foreign-born population - Czechoslovakia (%)
Place of birth for the foreign-born population - Hungary (%)
Place of birth for the foreign-born population - Latvia (%)
Place of birth for the foreign-born population - Lithuania (%)
Place of birth for the foreign-born population - North Macedonia (Macedonia) (%)
Place of birth for the foreign-born population - Moldova (%)
Place of birth for the foreign-born population - Poland (%)
Place of birth for the foreign-born population - Romania (%)
Place of birth for the foreign-born population - Russia (%)
Place of birth for the foreign-born population - Serbia (%)
Place of birth for the foreign-born population - Ukraine (%)
Place of birth for the foreign-born population - Other Eastern Europe (%)
Place of birth for the foreign-born population - China (%)
Place of birth for the foreign-born population - Hong Kong (%)
Place of birth for the foreign-born population - Taiwan (%)
Place of birth for the foreign-born population - Japan (%)
Place of birth for the foreign-born population - Korea (%)
Place of birth for the foreign-born population - Other Eastern Asia (%)
Place of birth for the foreign-born population - Afghanistan (%)
Place of birth for the foreign-born population - Bangladesh (%)
Place of birth for the foreign-born population - India (%)
Place of birth for the foreign-born population - Iran (%)
Place of birth for the foreign-born population - Kazakhstan (%)
Place of birth for the foreign-born population - Nepal (%)
Place of birth for the foreign-born population - Pakistan (%)
Place of birth for the foreign-born population - Sri Lanka (%)
Place of birth for the foreign-born population - Uzbekistan (%)
Place of birth for the foreign-born population - Other South Central Asia (%)
Place of birth for the foreign-born population - Burma (%)
Place of birth for the foreign-born population - Cambodia (%)
Place of birth for the foreign-born population - Indonesia (%)
Place of birth for the foreign-born population - Laos (%)
Place of birth for the foreign-born population - Malaysia (%)
Place of birth for the foreign-born population - Philippines (%)
Place of birth for the foreign-born population - Singapore (%)
Place of birth for the foreign-born population - Thailand (%)
Place of birth for the foreign-born population - Vietnam (%)
Place of birth for the foreign-born population - Other South Eastern Asia (%)
Place of birth for the foreign-born population - Armenia (%)
Place of birth for the foreign-born population - Iraq (%)
Place of birth for the foreign-born population - Israel (%)
Place of birth for the foreign-born population - Jordan (%)
Place of birth for the foreign-born population - Kuwait (%)
Place of birth for the foreign-born population - Lebanon (%)
Place of birth for the foreign-born population - Saudi Arabia (%)
Place of birth for the foreign-born population - Syria (%)
Place of birth for the foreign-born population - Turkey (%)
Place of birth for the foreign-born population - Yemen (%)
Place of birth for the foreign-born population - Other Western Asia (%)
Place of birth for the foreign-born population - Eritrea (%)
Place of birth for the foreign-born population - Ethiopia (%)
Place of birth for the foreign-born population - Kenya (%)
Place of birth for the foreign-born population - Somalia (%)
Place of birth for the foreign-born population - Uganda (%)
Place of birth for the foreign-born population - Zimbabwe (%)
Place of birth for the foreign-born population - Other Eastern Africa (%)
Place of birth for the foreign-born population - Cameroon (%)
Place of birth for the foreign-born population - Congo (%)
Place of birth for the foreign-born population - Democratic Republic of Congo (Zaire) (%)
Place of birth for the foreign-born population - Other Middle Africa (%)
Place of birth for the foreign-born population - Egypt (%)
Place of birth for the foreign-born population - Morocco (%)
Place of birth for the foreign-born population - Sudan (%)
Place of birth for the foreign-born population - Other Northern Africa (%)
Place of birth for the foreign-born population - South Africa (%)
Place of birth for the foreign-born population - Other Southern Africa (%)
Place of birth for the foreign-born population - Cabo Verde (%)
Place of birth for the foreign-born population - Ghana (%)
Place of birth for the foreign-born population - Liberia (%)
Place of birth for the foreign-born population - Nigeria (%)
Place of birth for the foreign-born population - Senegal (%)
Place of birth for the foreign-born population - Sierra Leone (%)
Place of birth for the foreign-born population - Other Western Africa (%)
Place of birth for the foreign-born population - Australia (%)
Place of birth for the foreign-born population - New Zealand (%)
Place of birth for the foreign-born population - Fiji (%)
Place of birth for the foreign-born population - Micronesia (%)
Place of birth for the foreign-born population - Bahamas (%)
Place of birth for the foreign-born population - Barbados (%)
Place of birth for the foreign-born population - Cuba (%)
Place of birth for the foreign-born population - Dominica (%)
Place of birth for the foreign-born population - Dominican Republic (%)
Place of birth for the foreign-born population - Grenada (%)
Place of birth for the foreign-born population - Haiti (%)
Place of birth for the foreign-born population - Jamaica (%)
Place of birth for the foreign-born population - St. Vincent and the Grenadines (%)
Place of birth for the foreign-born population - Trinidad and Tobago (%)
Place of birth for the foreign-born population - West Indies (%)
Place of birth for the foreign-born population - Other Caribbean (%)
Place of birth for the foreign-born population - Belize (%)
Place of birth for the foreign-born population - Costa Rica (%)
Place of birth for the foreign-born population - El Salvador (%)
Place of birth for the foreign-born population - Guatemala (%)
Place of birth for the foreign-born population - Honduras (%)
Place of birth for the foreign-born population - Mexico (%)
Place of birth for the foreign-born population - Nicaragua (%)
Place of birth for the foreign-born population - Panama (%)
Place of birth for the foreign-born population - Other Central America (%)
Place of birth for the foreign-born population - Argentina (%)
Place of birth for the foreign-born population - Bolivia (%)
Place of birth for the foreign-born population - Brazil (%)
Place of birth for the foreign-born population - Chile (%)
Place of birth for the foreign-born population - Colombia (%)
Place of birth for the foreign-born population - Ecuador (%)
Place of birth for the foreign-born population - Guyana (%)
Place of birth for the foreign-born population - Peru (%)
Place of birth for the foreign-born population - Uruguay (%)
Place of birth for the foreign-born population - Venezuela (%)
Place of birth for the foreign-born population - Other South America (%)
Place of birth for the foreign-born population - Canada (%)
Place of birth for the foreign-born population - Other Northern America (%)
Place of birth for the foreign-born population - Other (%)
Latest news about races in Milledgeville, GA collected exclusively by city-data.com from local newspapers, TV, and radio stations
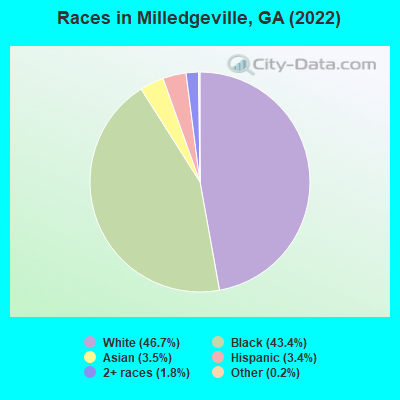
According to 2022 data, the most numerous races in Milledgeville, GA are White alone (8,095 residents), Black alone (7,522 residents), and Hispanic (586 residents). 93.4% of Milledgeville residents speak English at home. 4.0% of Milledgeville, GA residents are foreign-born (1.7% born in Asia, 1.5% born in Latin America, 0.5% born in Europe), which is 150.3% less than the foreign-born rate of 10.0% across the entire state of Georgia.
Race distribution in Milledgeville
2000 2022
5,128,661 62.6% White alone 2,331,465 28.5% Black alone 435,227 5.3% Hispanic 171,513 2.1% Asian alone 87,364 1.1% Two or more races 17,670 0.2% American Indian alone 11,275 0.1% Other race alone 3,278 0.04% Native Hawaiian and Other
5,415,657 49.6% White alone 3,349,240 30.7% Black alone 1,132,604 10.4% Hispanic 479,156 4.4% Asian alone 462,923 4.2% Two or more races 54,416 0.5% Other race alone 11,923 0.1% American Indian alone 6,957 0.06% Native Hawaiian and Other
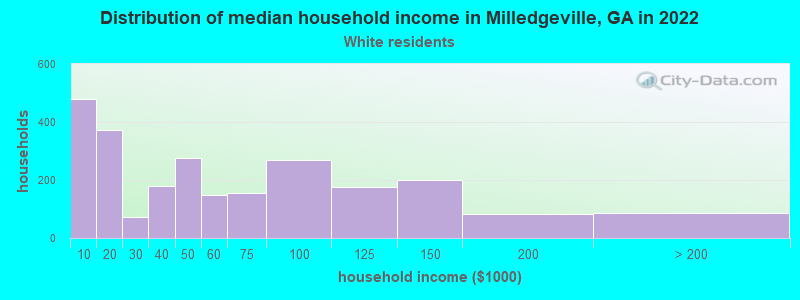
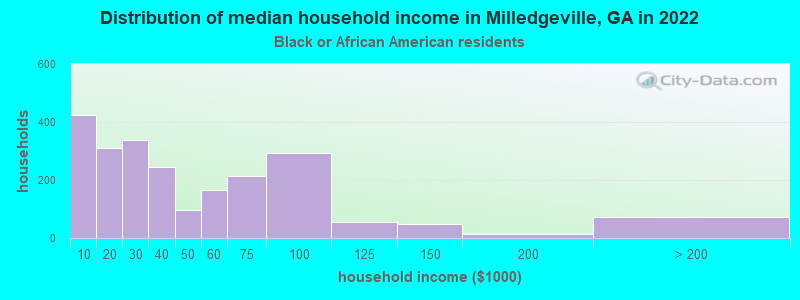
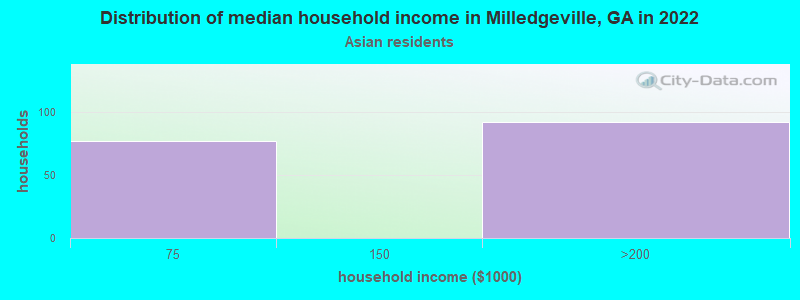
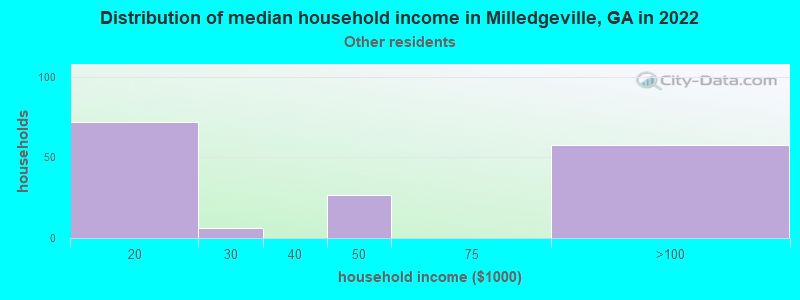
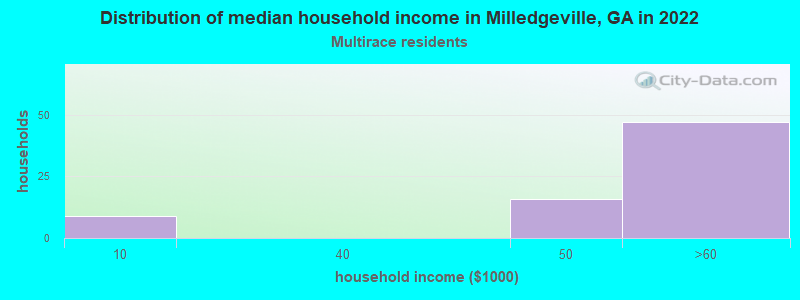
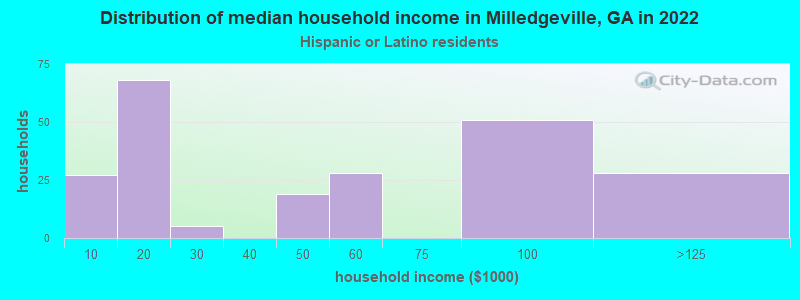
Income and house value in Milledgeville Median household income in 2022 $44,738 White non-Hispanic householders$34,530 Black householders$55,348 Two or more races householdersMedian 2022 house value $223,561 White Non-Hispanic householders$156,350 Black or African American householders $156,588 Asian householders$226,421 Some other race householders$235,478 Hispanic or Latino householders
Median age by race in Milledgeville
24.0 Median age for White residents26.6 21.9 32.8 Median age for Black or African American residents31.1 34.1 -597,462,513.8 Median age for American Indian / Alaska Native residents-597,222,221.6 -597,938,143.7 19.5 Median age for Asian residents19.7 19.4 -657,243,815.6 Median age for Native Hawaiian / Pacific Islander residents-693,227,090.9 -776,776,776.0 24.0 Median age for Other race residents32.5 16.6 33.0 Median age for Two or more races residents40.3 20.4 23.7 Median age for White alone residents26.2 21.5 24.3 Median age for Hispanic or Latino residents32.9 20.3
Owner/renter occupied households by race in Milledgeville
House owners and renters - White residents 1,033 41.9% Owner occupied1,432 58.1% Renter occupiedHouse owners and renters - Black or African American residents 667 29.4% Owner occupied1,598 70.6% Renter occupiedHouse owners and renters - Asian residents 115 67.9% Owner occupied54 32.1% Renter occupiedHouse owners and renters - Other race residents 155 100.0% Renter occupiedHouse owners and renters - Two or more races residents 63 100.0% Renter occupiedHouse owners and renters - White alone residents 1,024 41.1% Owner occupied1,465 58.9% Renter occupiedHouse owners and renters - Hispanic or Latino residents 27 12.9% Owner occupied185 87.1% Renter occupied
Language usage in Milledgeville
English speakers - Total 93.4% of residents of Milledgeville speak English at home.
2.4% of residents speak Spanish at home 269 67.2% Speak English very well131 32.8% Speak English less than very well4.0% of residents speak other language at home 437 66.0% Speak English very well225 34.0% Speak English less than very well
English speakers - Born in the United States 96.6% of residents of Milledgeville speak English at home.
2.7% of residents speak Spanish at home 99 100.0% Speak English very well0.6% of residents speak other language at home 23 100.0% Speak English very well
English speakers - Native, born elsewhere 28.3% of residents of Milledgeville speak English at home.
28.3% of residents speak Spanish at home 30 100.0% Speak English very well47.2% of residents speak other language at home 50 100.0% Speak English very well
English speakers - Foreign-born 26.8% of residents of Milledgeville speak English at home.
28.7% of residents speak Spanish at home 102 51.3% Speak English very well97 48.7% Speak English less than very well43.6% of residents speak other language at home 82 27.2% Speak English very well220 72.8% Speak English less than very well
White (Caucasian) - Speak only English Native:
99.7% (7,698)Foreign-born:
100.0% (68)
Black or African American - Speak only English Native:
98.6% (7,036)Foreign-born:
61.7% (13)
Black or African American - Speak another language Native:
1.3% (91)Foreign-born:
37.6% (8)
Asian - Speak another language Native:
68.6% (228)Foreign-born:
100.0% (289)
Other race - Speak only English Native:
13.5% (20)Foreign-born:
28.9% (65)
Other race - Speak another language Native:
88.3% (131)Foreign-born:
74.3% (168)
Two or more races - Speak only English Native:
95.1% (373)Foreign-born:
15.2% (17)
Two or more races - Speak another language Native:
5.4% (21)Foreign-born:
84.8% (94)
White alone - Speak only English Native:
98.9% (7,659)Foreign-born:
100.0% (100)
Hispanic or Latino - Speak only English Native:
53.7% (174)Foreign-born:
18.9% (47)
Hispanic or Latino - Speak another language Native:
47.3% (153)Foreign-born:
81.5% (204)
Foreign-born residents in Milledgeville 692 residents are foreign born (1.7% Asia , 1.5% Latin America , 0.5% Europe ).
This city:
4.0%Georgia:
10.4%
Marital status for residents in Milledgeville Marital status - White (Caucasian) population 15 years and over
Males 60.5% Never married24.2% Now married1.8% Separated3.3% Widowed10.2% DivorcedFemales 61.5% Never married23.9% Now married0.0% Separated7.5% Widowed7.2% DivorcedWomen who gave birth in the past 12 months Now married:
55.4% (146)Unmarried:
44.6% (118)
Women who did not give birth in the past 12 months Now married:
10.1% (239)Unmarried:
89.9% (2,132)
Marital status - Black or African American population 15 years and over
Males 69.1% Never married20.2% Now married3.1% Separated1.5% Widowed6.1% DivorcedFemales 60.1% Never married20.2% Now married0.8% Separated6.2% Widowed12.7% DivorcedWomen who did not give birth in the past 12 months Now married:
16.3% (319)Unmarried:
83.7% (1,632)
Marital status - Asian population 15 years and over
Males 18.0% Never married82.0% Now married0.0% Separated0.0% Widowed0.0% DivorcedFemales 67.9% Never married30.1% Now married0.0% Separated0.0% Widowed2.0% DivorcedWomen who did not give birth in the past 12 months Now married:
30.7% (111)Unmarried:
69.3% (249)
Marital status - Other race population 15 years and over
Males 97.2% Never married2.8% Now married0.0% Separated0.0% Widowed0.0% DivorcedFemales 59.6% Never married40.4% Now married0.0% Separated0.0% Widowed0.0% DivorcedWomen who gave birth in the past 12 months Now married:
0.0% (0)Unmarried:
100.0% (25)
Women who did not give birth in the past 12 months Now married:
60.5% (30)Unmarried:
39.5% (19)
Marital status - Two or more races population 15 years and over
Males 67.5% Never married8.8% Now married0.0% Separated9.4% Widowed14.4% DivorcedFemales 80.9% Never married8.0% Now married0.0% Separated11.2% Widowed0.0% DivorcedWomen who did not give birth in the past 12 months Now married:
0.0% (0)Unmarried:
100.0% (225)
Marital status - White alone, not Hispanic / Latino population 15 years and over
Males 60.6% Never married23.9% Now married1.9% Separated3.3% Widowed10.4% DivorcedFemales 61.4% Never married24.2% Now married0.0% Separated7.6% Widowed6.8% DivorcedWomen who gave birth in the past 12 months Now married:
55.4% (152)Unmarried:
44.6% (122)
Women who did not give birth in the past 12 months Now married:
10.3% (248)Unmarried:
89.7% (2,168)
Marital status - Hispanic or Latino population 15 years and over
Males 81.4% Never married14.0% Now married0.0% Separated0.0% Widowed4.7% DivorcedFemales 72.3% Never married19.5% Now married0.0% Separated0.0% Widowed8.2% DivorcedWomen who gave birth in the past 12 months Now married:
0.0% (0)Unmarried:
100.0% (20)
Women who did not give birth in the past 12 months Now married:
14.3% (25)Unmarried:
85.7% (149)
Ancestries in Milledgeville
1,406 13.6% American708 6.8% English437 4.2% African407 3.9% Irish221 2.1% German49 0.5% Scottish47 0.5% European45 0.4% Jamaican42 0.4% Scotch-Irish32 0.3% Dutch31 0.3% Italian26 0.3% Hungarian25 0.2% French Canadian20 0.2% Polish17 0.2% French15 0.1% Nigerian12 0.1% Lebanese12 0.1% British12 0.1% Finnish12 0.1% Welsh10 0.10% South African9 0.09% Scandinavian9 0.09% Swedish8 0.08% Moroccan7 0.07% West Indian4 0.04% Israeli4 0.04% Slavic2 0.02% Norwegian
Geographical mobility in Milledgeville Same house 1 year ago 5,655 72.9% White (Caucasian)6,368 84.4% Black or African American537 88.7% Asian254 63.4% Other race326 65.7% Two or more races5,772 72.9% White alone, not Hispanic / Latino357 60.8% Hispanic or LatinoMoved within same county 583 7.5% White / Caucasian366 4.9% Black or African American27 4.4% Asian14 3.5% Other race57 11.6% Two or more races615 7.8% White alone, not Hispanic / Latino38 6.5% Hispanic or LatinoMoved within same state 1,249 16.1% White / Caucasian598 7.9% Black or African American13 100.0% American Indian / Alaska Native36 6.0% Asian158 39.4% Other race115 23.2% Two or more races1,230 15.5% White alone, not Hispanic / Latino229 39.0% Hispanic or LatinoMoved from different state 240 3.1% White / Caucasian165 2.2% Black or African American249 3.1% White alone, not Hispanic / LatinoMoved from abroad 28 0.4% White29 0.4% Black or African American34 0.4% White alone, not Hispanic / Latino
Children Nativity (place of birth) in Milledgeville
Children under 6 years - Living with two parents Both parents native 256 100.0% NativeChildren under 6 years - Living with one parent Native parent 376 100.0% NativeForeign-born parent 19 100.0% NativeChildren 6 to 17 years - Living with two parents Both parents native 447 100.0% NativeBoth parents foreign-born 188 100.0% NativeChildren 6 to 17 years - Living with one parent Native parent 729 100.0% NativeForeign-born parent 55 59.8% Native37 40.2% Foreign-born
Grandparents responsible for own grandchildren in Milledgeville
Grandparents (30 to 59 years) White / Caucasian 49 100.0% Not responsible for grandchildrenBlack or African American 45 42.0% Responsible for grandchildren62 58.0% Not responsible for grandchildrenWhite alone, not Hispanic / Latino 52 100.0% Not responsible for grandchildrenGrandparents (60 years and over) Black or African American 9 16.9% Responsible for grandchildren44 83.1% Not responsible for grandchildren