Races in Middletown, Connecticut (CT) Detailed Stats
Data:
Races - White alone (%)
Races - White alone (% change since 2000)
Races - Black alone (%)
Races - Black alone (% change since 2000)
Races - American Indian alone (%)
Races - American Indian alone (% change since 2000)
Races - Asian alone (%)
Races - Asian alone (% change since 2000)
Races - Hispanic (%)
Races - Hispanic (% change since 2000)
Races - Native Hawaiian and Other Pacific Islander alone (%)
Races - Native Hawaiian and Other Pacific Islander alone (% change since 2000)
Races - Two or more races(%)
Races - Two or more races(% change since 2000)
Races - Other race alone (%)
Races - Other race alone (% change since 2000)
Racial diversity
Place of birth - Born in state of residence (%)
Place of birth - Born in state of residence (%) - White
Place of birth - Born in state of residence (%) - Black or African American
Place of birth - Born in state of residence (%) - Asian
Place of birth - Born in state of residence (%) - Hispanic or Latino
Place of birth - Born in state of residence (%) - American Indian and Alaska Native
Place of birth - Born in state of residence (%) - Multirace
Place of birth - Born in state of residence (%) - Other Race
Place of birth - Born in other state (%)
Place of birth - Born in other state (%) - White
Place of birth - Born in other state (%) - Black or African American
Place of birth - Born in other state (%) - Asian
Place of birth - Born in other state (%) - Hispanic or Latino
Place of birth - Born in other state (%) - American Indian and Alaska Native
Place of birth - Born in other state (%) - Multirace
Place of birth - Born in other state (%) - Other Race
Place of birth - Native, outside of US (%)
Place of birth - Native, outside of US (%) - White
Place of birth - Native, outside of US (%) - Black or African American
Place of birth - Native, outside of US (%) - Asian
Place of birth - Native, outside of US (%) - Hispanic or Latino
Place of birth - Native, outside of US (%) - American Indian and Alaska Native
Place of birth - Native, outside of US (%) - Multirace
Place of birth - Native, outside of US (%) - Other Race
Place of birth - Foreign born (%)
Place of birth - Foreign born (%) - White
Place of birth - Foreign born (%) - Black or African American
Place of birth - Foreign born (%) - Asian
Place of birth - Foreign born (%) - Hispanic or Latino
Place of birth - Foreign born (%) - American Indian and Alaska Native
Place of birth - Foreign born (%) - Multirace
Place of birth - Foreign born (%) - Other Race
Residents speaking English at home (%)
Residents speaking English at home - Born in the United States (%)
Residents speaking English at home - Native, born elsewhere (%)
Residents speaking English at home - Foreign born (%)
Residents speaking Spanish at home (%)
Residents speaking Spanish at home - Born in the United States (%)
Residents speaking Spanish at home - Native, born elsewhere (%)
Residents speaking Spanish at home - Foreign born (%)
Residents speaking other language at home (%)
Residents speaking other language at home - Born in the United States (%)
Residents speaking other language at home - Native, born elsewhere (%)
Residents speaking other language at home - Foreign born (%)
Marital status - Never married (%)
Marital status - Now married (%)
Marital status - Separated (%)
Marital status - Widowed (%)
Marital status - Divorced (%)
Ancestries Reported - Arab (%)
Ancestries Reported - Czech (%)
Ancestries Reported - Danish (%)
Ancestries Reported - Dutch (%)
Ancestries Reported - English (%)
Ancestries Reported - French (%)
Ancestries Reported - French Canadian (%)
Ancestries Reported - German (%)
Ancestries Reported - Greek (%)
Ancestries Reported - Hungarian (%)
Ancestries Reported - Irish (%)
Ancestries Reported - Italian (%)
Ancestries Reported - Lithuanian (%)
Ancestries Reported - Norwegian (%)
Ancestries Reported - Polish (%)
Ancestries Reported - Portuguese (%)
Ancestries Reported - Russian (%)
Ancestries Reported - Scotch-Irish (%)
Ancestries Reported - Scottish (%)
Ancestries Reported - Slovak (%)
Ancestries Reported - Subsaharan African (%)
Ancestries Reported - Swedish (%)
Ancestries Reported - Swiss (%)
Ancestries Reported - Ukrainian (%)
Ancestries Reported - United States (%)
Ancestries Reported - Welsh (%)
Ancestries Reported - West Indian (%)
Ancestries Reported - Other (%)
Geographical mobility - Same house 1 year ago (%)
Geographical mobility - Same house 1 year ago (%) - White
Geographical mobility - Same house 1 year ago (%) - Black or African American
Geographical mobility - Same house 1 year ago (%) - Asian
Geographical mobility - Same house 1 year ago (%) - Hispanic or Latino
Geographical mobility - Same house 1 year ago (%) - American Indian and Alaska Native
Geographical mobility - Same house 1 year ago (%) - Multirace
Geographical mobility - Same house 1 year ago (%) - Other Race
Geographical mobility - Moved within same county (%)
Geographical mobility - Moved within same county (%) - White
Geographical mobility - Moved within same county (%) - Black or African American
Geographical mobility - Moved within same county (%) - Asian
Geographical mobility - Moved within same county (%) - Hispanic or Latino
Geographical mobility - Moved within same county (%) - American Indian and Alaska Native
Geographical mobility - Moved within same county (%) - Multirace
Geographical mobility - Moved within same county (%) - Other Race
Geographical mobility - Moved from different county within same state (%)
Geographical mobility - Moved from different county within same state (%) - White
Geographical mobility - Moved from different county within same state (%) - Black or African American
Geographical mobility - Moved from different county within same state (%) - Asian
Geographical mobility - Moved from different county within same state (%) - Hispanic or Latino
Geographical mobility - Moved from different county within same state (%) - American Indian and Alaska Native
Geographical mobility - Moved from different county within same state (%) - Multirace
Geographical mobility - Moved from different county within same state (%) - Other Race
Geographical mobility - Moved from different state (%)
Geographical mobility - Moved from different state (%) - White
Geographical mobility - Moved from different state (%) - Black or African American
Geographical mobility - Moved from different state (%) - Asian
Geographical mobility - Moved from different state (%) - Hispanic or Latino
Geographical mobility - Moved from different state (%) - American Indian and Alaska Native
Geographical mobility - Moved from different state (%) - Multirace
Geographical mobility - Moved from different state (%) - Other Race
Geographical mobility - Moved from abroad (%)
Geographical mobility - Moved from abroad (%) - White
Geographical mobility - Moved from abroad (%) - Black or African American
Geographical mobility - Moved from abroad (%) - Asian
Geographical mobility - Moved from abroad (%) - Hispanic or Latino
Geographical mobility - Moved from abroad (%) - American Indian and Alaska Native
Geographical mobility - Moved from abroad (%) - Multirace
Geographical mobility - Moved from abroad (%) - Other Race
Place of birth for the foreign-born population - Ireland (%)
Place of birth for the foreign-born population - Denmark (%)
Place of birth for the foreign-born population - Norway (%)
Place of birth for the foreign-born population - Sweden (%)
Place of birth for the foreign-born population - United Kingdom (%)
Place of birth for the foreign-born population - England (%)
Place of birth for the foreign-born population - Scotland (%)
Place of birth for the foreign-born population - Other Northern Europe (%)
Place of birth for the foreign-born population - Austria (%)
Place of birth for the foreign-born population - Belgium (%)
Place of birth for the foreign-born population - France (%)
Place of birth for the foreign-born population - Germany (%)
Place of birth for the foreign-born population - Netherlands (%)
Place of birth for the foreign-born population - Switzerland (%)
Place of birth for the foreign-born population - Other Western Europe (%)
Place of birth for the foreign-born population - Greece (%)
Place of birth for the foreign-born population - Italy (%)
Place of birth for the foreign-born population - Portugal (%)
Place of birth for the foreign-born population - Spain (%)
Place of birth for the foreign-born population - Other Southern Europe (%)
Place of birth for the foreign-born population - Albania (%)
Place of birth for the foreign-born population - Belarus (%)
Place of birth for the foreign-born population - Bosnia and Herzegovina (%)
Place of birth for the foreign-born population - Bulgaria (%)
Place of birth for the foreign-born population - Croatia (%)
Place of birth for the foreign-born population - Czechoslovakia (%)
Place of birth for the foreign-born population - Hungary (%)
Place of birth for the foreign-born population - Latvia (%)
Place of birth for the foreign-born population - Lithuania (%)
Place of birth for the foreign-born population - North Macedonia (Macedonia) (%)
Place of birth for the foreign-born population - Moldova (%)
Place of birth for the foreign-born population - Poland (%)
Place of birth for the foreign-born population - Romania (%)
Place of birth for the foreign-born population - Russia (%)
Place of birth for the foreign-born population - Serbia (%)
Place of birth for the foreign-born population - Ukraine (%)
Place of birth for the foreign-born population - Other Eastern Europe (%)
Place of birth for the foreign-born population - China (%)
Place of birth for the foreign-born population - Hong Kong (%)
Place of birth for the foreign-born population - Taiwan (%)
Place of birth for the foreign-born population - Japan (%)
Place of birth for the foreign-born population - Korea (%)
Place of birth for the foreign-born population - Other Eastern Asia (%)
Place of birth for the foreign-born population - Afghanistan (%)
Place of birth for the foreign-born population - Bangladesh (%)
Place of birth for the foreign-born population - India (%)
Place of birth for the foreign-born population - Iran (%)
Place of birth for the foreign-born population - Kazakhstan (%)
Place of birth for the foreign-born population - Nepal (%)
Place of birth for the foreign-born population - Pakistan (%)
Place of birth for the foreign-born population - Sri Lanka (%)
Place of birth for the foreign-born population - Uzbekistan (%)
Place of birth for the foreign-born population - Other South Central Asia (%)
Place of birth for the foreign-born population - Burma (%)
Place of birth for the foreign-born population - Cambodia (%)
Place of birth for the foreign-born population - Indonesia (%)
Place of birth for the foreign-born population - Laos (%)
Place of birth for the foreign-born population - Malaysia (%)
Place of birth for the foreign-born population - Philippines (%)
Place of birth for the foreign-born population - Singapore (%)
Place of birth for the foreign-born population - Thailand (%)
Place of birth for the foreign-born population - Vietnam (%)
Place of birth for the foreign-born population - Other South Eastern Asia (%)
Place of birth for the foreign-born population - Armenia (%)
Place of birth for the foreign-born population - Iraq (%)
Place of birth for the foreign-born population - Israel (%)
Place of birth for the foreign-born population - Jordan (%)
Place of birth for the foreign-born population - Kuwait (%)
Place of birth for the foreign-born population - Lebanon (%)
Place of birth for the foreign-born population - Saudi Arabia (%)
Place of birth for the foreign-born population - Syria (%)
Place of birth for the foreign-born population - Turkey (%)
Place of birth for the foreign-born population - Yemen (%)
Place of birth for the foreign-born population - Other Western Asia (%)
Place of birth for the foreign-born population - Eritrea (%)
Place of birth for the foreign-born population - Ethiopia (%)
Place of birth for the foreign-born population - Kenya (%)
Place of birth for the foreign-born population - Somalia (%)
Place of birth for the foreign-born population - Uganda (%)
Place of birth for the foreign-born population - Zimbabwe (%)
Place of birth for the foreign-born population - Other Eastern Africa (%)
Place of birth for the foreign-born population - Cameroon (%)
Place of birth for the foreign-born population - Congo (%)
Place of birth for the foreign-born population - Democratic Republic of Congo (Zaire) (%)
Place of birth for the foreign-born population - Other Middle Africa (%)
Place of birth for the foreign-born population - Egypt (%)
Place of birth for the foreign-born population - Morocco (%)
Place of birth for the foreign-born population - Sudan (%)
Place of birth for the foreign-born population - Other Northern Africa (%)
Place of birth for the foreign-born population - South Africa (%)
Place of birth for the foreign-born population - Other Southern Africa (%)
Place of birth for the foreign-born population - Cabo Verde (%)
Place of birth for the foreign-born population - Ghana (%)
Place of birth for the foreign-born population - Liberia (%)
Place of birth for the foreign-born population - Nigeria (%)
Place of birth for the foreign-born population - Senegal (%)
Place of birth for the foreign-born population - Sierra Leone (%)
Place of birth for the foreign-born population - Other Western Africa (%)
Place of birth for the foreign-born population - Australia (%)
Place of birth for the foreign-born population - New Zealand (%)
Place of birth for the foreign-born population - Fiji (%)
Place of birth for the foreign-born population - Micronesia (%)
Place of birth for the foreign-born population - Bahamas (%)
Place of birth for the foreign-born population - Barbados (%)
Place of birth for the foreign-born population - Cuba (%)
Place of birth for the foreign-born population - Dominica (%)
Place of birth for the foreign-born population - Dominican Republic (%)
Place of birth for the foreign-born population - Grenada (%)
Place of birth for the foreign-born population - Haiti (%)
Place of birth for the foreign-born population - Jamaica (%)
Place of birth for the foreign-born population - St. Vincent and the Grenadines (%)
Place of birth for the foreign-born population - Trinidad and Tobago (%)
Place of birth for the foreign-born population - West Indies (%)
Place of birth for the foreign-born population - Other Caribbean (%)
Place of birth for the foreign-born population - Belize (%)
Place of birth for the foreign-born population - Costa Rica (%)
Place of birth for the foreign-born population - El Salvador (%)
Place of birth for the foreign-born population - Guatemala (%)
Place of birth for the foreign-born population - Honduras (%)
Place of birth for the foreign-born population - Mexico (%)
Place of birth for the foreign-born population - Nicaragua (%)
Place of birth for the foreign-born population - Panama (%)
Place of birth for the foreign-born population - Other Central America (%)
Place of birth for the foreign-born population - Argentina (%)
Place of birth for the foreign-born population - Bolivia (%)
Place of birth for the foreign-born population - Brazil (%)
Place of birth for the foreign-born population - Chile (%)
Place of birth for the foreign-born population - Colombia (%)
Place of birth for the foreign-born population - Ecuador (%)
Place of birth for the foreign-born population - Guyana (%)
Place of birth for the foreign-born population - Peru (%)
Place of birth for the foreign-born population - Uruguay (%)
Place of birth for the foreign-born population - Venezuela (%)
Place of birth for the foreign-born population - Other South America (%)
Place of birth for the foreign-born population - Canada (%)
Place of birth for the foreign-born population - Other Northern America (%)
Place of birth for the foreign-born population - Other (%)
Latest news about races in Middletown, CT collected exclusively by city-data.com from local newspapers, TV, and radio stations
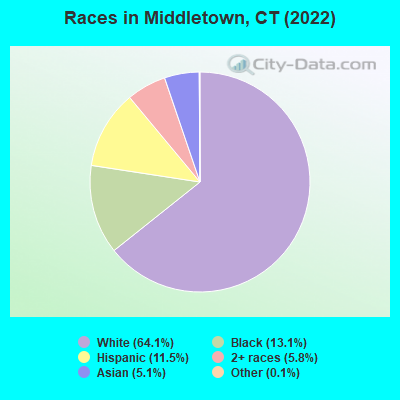
According to 2022 data, the most numerous races in Middletown, CT are White alone (30,985 residents), Hispanic (5,555 residents), and Black alone (6,340 residents). 83.3% of Middletown residents speak English at home. 12.1% of Middletown, CT residents are foreign-born (3.6% born in Asia, 3.5% born in Europe, 3.4% born in Latin America), which is 23.7% less than the foreign-born rate of 15.0% across the entire state of Connecticut.
Race distribution in Middletown
2000 2022
33,435 77.5% White alone 5,111 11.8% Black alone 2,287 5.3% Hispanic 1,135 2.6% Asian alone 1,036 2.4% Two or more races 83 0.2% American Indian alone 61 0.1% Other race alone 19 0.04% Native Hawaiian and Other
30,985 64.1% White alone 6,340 13.1% Black alone 5,555 11.5% Hispanic 2,784 5.8% Two or more races 2,468 5.1% Asian alone 64 0.1% Other race alone 30 0.06% American Indian alone
2000 2022
2,638,845 77.5% White alone 320,323 9.4% Hispanic 295,571 8.7% Black alone 81,564 2.4% Asian alone 52,896 1.6% Two or more races 8,141 0.2% Other race alone 7,267 0.2% American Indian alone 958 0.03% Native Hawaiian and Other
2,246,913 62.0% White alone 658,978 18.2% Hispanic 353,973 9.8% Black alone 172,929 4.8% Asian alone 159,631 4.4% Two or more races 29,761 0.8% Other race alone 3,428 0.09% American Indian alone 592 0.02% Native Hawaiian and Other
Income and house value in Middletown Median household income in 2022 $77,949 White non-Hispanic householders$57,584 Black householders$77,289 Asian householders$56,989 Some other race householders$57,664 Two or more races householders$52,714 Hispanic or Latino race householdersMedian 2022 house value $293,798 White Non-Hispanic householders$225,903 Black or African American householders $357,166 Asian householders$294,003 Some other race householders$205,740 Two or more races householders$330,214 Hispanic or Latino householders
Median age by race in Middletown
42.8 Median age for White residents42.0 44.3 34.1 Median age for Black or African American residents31.7 35.2 34.1 Median age for American Indian / Alaska Native residents31.1 32.4 34.2 Median age for Asian residents34.4 30.2 -641,269,840.6 Median age for Native Hawaiian / Pacific Islander residents-414,239,481.8 -691,588,784.4 34.1 Median age for Other race residents30.6 37.1 25.7 Median age for Two or more races residents24.8 28.8 43.5 Median age for White alone residents42.0 45.1 28.4 Median age for Hispanic or Latino residents26.5 29.1
Owner/renter occupied households by race in Middletown
House owners and renters - White residents 8,814 61.7% Owner occupied5,465 38.3% Renter occupiedHouse owners and renters - Black or African American residents 1,121 40.2% Owner occupied1,668 59.8% Renter occupiedHouse owners and renters - American Indian / Alaska Native residents 102 100.0% Renter occupiedHouse owners and renters - Asian residents 376 36.6% Owner occupied651 63.4% Renter occupiedHouse owners and renters - Other race residents 133 35.0% Owner occupied247 65.0% Renter occupiedHouse owners and renters - Two or more races residents 835 39.0% Owner occupied1,305 61.0% Renter occupiedHouse owners and renters - White alone residents 8,604 60.4% Owner occupied5,653 39.6% Renter occupiedHouse owners and renters - Hispanic or Latino residents 780 41.1% Owner occupied1,119 58.9% Renter occupied
Language usage in Middletown
English speakers - Total 83.3% of residents of Middletown speak English at home.
5.9% of residents speak Spanish at home 1,946 70.3% Speak English very well821 29.7% Speak English less than very well10.3% of residents speak other language at home 3,308 68.7% Speak English very well1,507 31.3% Speak English less than very well
English speakers - Born in the United States 89.3% of residents of Middletown speak English at home.
4.6% of residents speak Spanish at home 588 91.3% Speak English very well56 8.7% Speak English less than very well5.8% of residents speak other language at home 787 96.4% Speak English very well29 3.6% Speak English less than very well
English speakers - Native, born elsewhere 32.1% of residents of Middletown speak English at home.
59.5% of residents speak Spanish at home 286 52.6% Speak English very well258 47.4% Speak English less than very well10.1% of residents speak other language at home 92 100.0% Speak English very well
English speakers - Foreign-born 28.9% of residents of Middletown speak English at home.
11.7% of residents speak Spanish at home 331 48.2% Speak English very well356 51.8% Speak English less than very well58.4% of residents speak other language at home 1,981 57.9% Speak English very well1,438 42.1% Speak English less than very well
White (Caucasian) - Speak only English Native:
96.8% (28,159)Foreign-born:
29.7% (488)
White (Caucasian) - Speak another language Native:
3.8% (1,114)Foreign-born:
70.1% (1,154)
Black or African American - Speak only English Native:
92.4% (4,832)Foreign-born:
58.5% (860)
Black or African American - Speak another language Native:
7.4% (389)Foreign-born:
39.7% (583)
Asian - Speak only English Native:
66.0% (457)Foreign-born:
18.1% (321)
Asian - Speak another language Native:
34.7% (240)Foreign-born:
81.7% (1,450)
Other race - Speak only English Native:
22.4% (138)Foreign-born:
2.4% (5)
Other race - Speak another language Native:
75.9% (467)Foreign-born:
98.3% (209)
Two or more races - Speak only English Native:
73.1% (3,360)Foreign-born:
8.1% (41)
Two or more races - Speak another language Native:
25.0% (1,151)Foreign-born:
92.7% (477)
White alone - Speak only English Native:
96.4% (27,413)Foreign-born:
26.9% (474)
White alone - Speak another language Native:
3.6% (1,011)Foreign-born:
72.9% (1,281)
Hispanic or Latino - Speak only English Native:
60.3% (2,588)Foreign-born:
6.1% (47)
Hispanic or Latino - Speak another language Native:
41.0% (1,760)Foreign-born:
93.9% (717)
Foreign-born residents in Middletown 5,861 residents are foreign born (3.6% Asia , 3.5% Europe , 3.4% Latin America ).
This city:
12.1%Connecticut:
15.0%
Marital status for residents in Middletown Marital status - White (Caucasian) population 15 years and over
Males 44.1% Never married41.6% Now married0.9% Separated2.4% Widowed11.0% DivorcedFemales 36.8% Never married41.4% Now married0.2% Separated8.2% Widowed13.3% DivorcedWomen who gave birth in the past 12 months Now married:
56.1% (155)Unmarried:
43.9% (121)
Women who did not give birth in the past 12 months Now married:
31.5% (2,421)Unmarried:
68.5% (5,267)
Marital status - Black or African American population 15 years and over
Males 58.7% Never married34.0% Now married2.0% Separated0.0% Widowed5.3% DivorcedFemales 50.0% Never married23.9% Now married2.2% Separated7.7% Widowed16.1% DivorcedWomen who gave birth in the past 12 months Now married:
0.0% (0)Unmarried:
100.0% (93)
Women who did not give birth in the past 12 months Now married:
21.4% (348)Unmarried:
78.6% (1,277)
Marital status - American Indian / Alaska Native population 15 years and over
Males 45.6% Never married24.6% Now married0.0% Separated0.0% Widowed29.8% DivorcedFemales 0.0% Never married59.7% Now married0.0% Separated0.0% Widowed40.3% DivorcedWomen who did not give birth in the past 12 months Now married:
100.0% (40)Unmarried:
0.0% (0)
Marital status - Asian population 15 years and over
Males 34.5% Never married54.8% Now married0.0% Separated1.1% Widowed9.6% DivorcedFemales 48.1% Never married35.6% Now married0.0% Separated7.8% Widowed8.5% DivorcedWomen who gave birth in the past 12 months Now married:
100.0% (45)Unmarried:
0.0% (0)
Women who did not give birth in the past 12 months Now married:
23.9% (184)Unmarried:
76.1% (587)
Marital status - Other race population 15 years and over
Males 49.4% Never married50.6% Now married0.0% Separated0.0% Widowed0.0% DivorcedFemales 32.1% Never married29.8% Now married0.9% Separated0.0% Widowed37.2% DivorcedWomen who did not give birth in the past 12 months Now married:
35.6% (108)Unmarried:
64.4% (195)
Marital status - Two or more races population 15 years and over
Males 54.6% Never married34.2% Now married0.0% Separated0.0% Widowed11.3% DivorcedFemales 54.9% Never married32.3% Now married0.0% Separated1.4% Widowed11.5% DivorcedWomen who gave birth in the past 12 months Now married:
100.0% (18)Unmarried:
0.0% (0)
Women who did not give birth in the past 12 months Now married:
31.6% (602)Unmarried:
68.4% (1,305)
Marital status - White alone, not Hispanic / Latino population 15 years and over
Males 43.7% Never married42.2% Now married0.7% Separated2.3% Widowed11.2% DivorcedFemales 35.5% Never married42.0% Now married0.2% Separated8.4% Widowed13.9% DivorcedWomen who gave birth in the past 12 months Now married:
55.0% (143)Unmarried:
45.0% (117)
Women who did not give birth in the past 12 months Now married:
32.0% (2,393)Unmarried:
68.0% (5,080)
Marital status - Hispanic or Latino population 15 years and over
Males 51.0% Never married39.4% Now married2.1% Separated1.9% Widowed5.7% DivorcedFemales 48.4% Never married31.7% Now married0.1% Separated3.6% Widowed16.2% DivorcedWomen who gave birth in the past 12 months Now married:
25.9% (22)Unmarried:
74.1% (63)
Women who did not give birth in the past 12 months Now married:
31.5% (490)Unmarried:
68.5% (1,063)
Ancestries in Middletown
3,356 15.6% Italian1,732 8.1% Irish1,458 6.8% Polish1,411 6.6% American1,139 5.3% Jamaican757 3.5% German730 3.4% English422 2.0% French404 1.9% Ghanaian361 1.7% European297 1.4% French Canadian219 1.0% Albanian155 0.7% Nigerian117 0.5% Portuguese113 0.5% Austrian106 0.5% Norwegian95 0.4% Greek86 0.4% Canadian69 0.3% Turkish58 0.3% Ukrainian57 0.3% Russian53 0.2% Scottish52 0.2% Danish47 0.2% Welsh46 0.2% Palestinian46 0.2% Brazilian46 0.2% Bulgarian41 0.2% Arab39 0.2% Hungarian39 0.2% Ethiopian37 0.2% Dutch36 0.2% Eastern European35 0.2% Haitian32 0.1% Northern European30 0.1% Croatian30 0.1% Scotch-Irish26 0.1% Slovak26 0.1% British25 0.1% Ugandan23 0.1% Romanian19 0.09% Swedish13 0.06% Barbadian12 0.06% Scandinavian12 0.06% Egyptian8 0.04% Czechoslovakian5 0.02% Lebanese4 0.02% Czech2 0.01% African
Geographical mobility in Middletown Same house 1 year ago 26,044 83.2% White (Caucasian)5,697 81.2% Black or African American152 94.2% American Indian / Alaska Native1,613 65.0% Asian666 80.3% Other race4,173 73.7% Two or more races25,595 82.9% White alone, not Hispanic / Latino4,265 79.1% Hispanic or LatinoMoved within same county 1,088 3.5% White / Caucasian320 4.6% Black or African American161 6.5% Asian9 1.1% Other race117 2.1% Two or more races1,147 3.7% White alone, not Hispanic / Latino116 2.1% Hispanic or LatinoMoved within same state 1,796 5.7% White / Caucasian731 10.4% Black or African American45 1.8% Asian29 3.5% Other race1,169 20.6% Two or more races1,821 5.9% White alone, not Hispanic / Latino617 11.4% Hispanic or LatinoMoved from different state 2,477 7.9% White / Caucasian253 3.6% Black or African American2 1.2% American Indian / Alaska Native338 13.6% Asian40 4.8% Other race311 5.5% Two or more races2,389 7.7% White alone, not Hispanic / Latino294 5.4% Hispanic or LatinoMoved from abroad 208 0.7% White3 0.0% Black or African American426 17.2% Asian74 8.9% Other race193 0.6% White alone, not Hispanic / Latino95 1.8% Hispanic or Latino
Children Nativity (place of birth) in Middletown
Children under 6 years - Living with two parents Both parents native 953 100.0% NativeBoth parents foreign-born 96 94.3% Native6 5.7% Foreign-bornOne native, one foreign-born parent 140 100.0% NativeChildren under 6 years - Living with one parent Native parent 782 100.0% NativeForeign-born parent 125 100.0% NativeChildren 6 to 17 years - Living with two parents Both parents native 2,039 100.0% NativeBoth parents foreign-born 215 76.4% Native66 23.6% Foreign-bornOne native, one foreign-born parent 214 100.0% NativeChildren 6 to 17 years - Living with one parent Native parent 1,520 100.0% NativeForeign-born parent 446 53.5% Native388 46.5% Foreign-born
Grandparents responsible for own grandchildren in Middletown
Grandparents (30 to 59 years) White / Caucasian 96 72.7% Responsible for grandchildren36 27.3% Not responsible for grandchildrenBlack or African American 21 42.9% Responsible for grandchildren28 57.1% Not responsible for grandchildrenAmerican Indian / Alaska Native 25 100.0% Responsible for grandchildrenTwo or more races 62 100.0% Responsible for grandchildrenWhite alone, not Hispanic / Latino 109 69.3% Responsible for grandchildren48 30.7% Not responsible for grandchildrenHispanic or Latino 54 100.0% Responsible for grandchildrenGrandparents (60 years and over) White / Caucasian 5 3.1% Responsible for grandchildren152 96.9% Not responsible for grandchildrenBlack or African American 47 47.8% Responsible for grandchildren52 52.2% Not responsible for grandchildrenWhite alone, not Hispanic / Latino 5 3.2% Responsible for grandchildren160 96.8% Not responsible for grandchildren