Races in Mercerville, New Jersey (NJ) Detailed Stats
Data:
Races - White alone (%)
Races - White alone (% change since 2000)
Races - Black alone (%)
Races - Black alone (% change since 2000)
Races - American Indian alone (%)
Races - American Indian alone (% change since 2000)
Races - Asian alone (%)
Races - Asian alone (% change since 2000)
Races - Hispanic (%)
Races - Hispanic (% change since 2000)
Races - Native Hawaiian and Other Pacific Islander alone (%)
Races - Native Hawaiian and Other Pacific Islander alone (% change since 2000)
Races - Two or more races(%)
Races - Two or more races(% change since 2000)
Races - Other race alone (%)
Races - Other race alone (% change since 2000)
Racial diversity
Place of birth - Born in state of residence (%)
Place of birth - Born in state of residence (%) - White
Place of birth - Born in state of residence (%) - Black or African American
Place of birth - Born in state of residence (%) - Asian
Place of birth - Born in state of residence (%) - Hispanic or Latino
Place of birth - Born in state of residence (%) - American Indian and Alaska Native
Place of birth - Born in state of residence (%) - Multirace
Place of birth - Born in state of residence (%) - Other Race
Place of birth - Born in other state (%)
Place of birth - Born in other state (%) - White
Place of birth - Born in other state (%) - Black or African American
Place of birth - Born in other state (%) - Asian
Place of birth - Born in other state (%) - Hispanic or Latino
Place of birth - Born in other state (%) - American Indian and Alaska Native
Place of birth - Born in other state (%) - Multirace
Place of birth - Born in other state (%) - Other Race
Place of birth - Native, outside of US (%)
Place of birth - Native, outside of US (%) - White
Place of birth - Native, outside of US (%) - Black or African American
Place of birth - Native, outside of US (%) - Asian
Place of birth - Native, outside of US (%) - Hispanic or Latino
Place of birth - Native, outside of US (%) - American Indian and Alaska Native
Place of birth - Native, outside of US (%) - Multirace
Place of birth - Native, outside of US (%) - Other Race
Place of birth - Foreign born (%)
Place of birth - Foreign born (%) - White
Place of birth - Foreign born (%) - Black or African American
Place of birth - Foreign born (%) - Asian
Place of birth - Foreign born (%) - Hispanic or Latino
Place of birth - Foreign born (%) - American Indian and Alaska Native
Place of birth - Foreign born (%) - Multirace
Place of birth - Foreign born (%) - Other Race
Residents speaking English at home (%)
Residents speaking English at home - Born in the United States (%)
Residents speaking English at home - Native, born elsewhere (%)
Residents speaking English at home - Foreign born (%)
Residents speaking Spanish at home (%)
Residents speaking Spanish at home - Born in the United States (%)
Residents speaking Spanish at home - Native, born elsewhere (%)
Residents speaking Spanish at home - Foreign born (%)
Residents speaking other language at home (%)
Residents speaking other language at home - Born in the United States (%)
Residents speaking other language at home - Native, born elsewhere (%)
Residents speaking other language at home - Foreign born (%)
Marital status - Never married (%)
Marital status - Now married (%)
Marital status - Separated (%)
Marital status - Widowed (%)
Marital status - Divorced (%)
Ancestries Reported - Arab (%)
Ancestries Reported - Czech (%)
Ancestries Reported - Danish (%)
Ancestries Reported - Dutch (%)
Ancestries Reported - English (%)
Ancestries Reported - French (%)
Ancestries Reported - French Canadian (%)
Ancestries Reported - German (%)
Ancestries Reported - Greek (%)
Ancestries Reported - Hungarian (%)
Ancestries Reported - Irish (%)
Ancestries Reported - Italian (%)
Ancestries Reported - Lithuanian (%)
Ancestries Reported - Norwegian (%)
Ancestries Reported - Polish (%)
Ancestries Reported - Portuguese (%)
Ancestries Reported - Russian (%)
Ancestries Reported - Scotch-Irish (%)
Ancestries Reported - Scottish (%)
Ancestries Reported - Slovak (%)
Ancestries Reported - Subsaharan African (%)
Ancestries Reported - Swedish (%)
Ancestries Reported - Swiss (%)
Ancestries Reported - Ukrainian (%)
Ancestries Reported - United States (%)
Ancestries Reported - Welsh (%)
Ancestries Reported - West Indian (%)
Ancestries Reported - Other (%)
Geographical mobility - Same house 1 year ago (%)
Geographical mobility - Same house 1 year ago (%) - White
Geographical mobility - Same house 1 year ago (%) - Black or African American
Geographical mobility - Same house 1 year ago (%) - Asian
Geographical mobility - Same house 1 year ago (%) - Hispanic or Latino
Geographical mobility - Same house 1 year ago (%) - American Indian and Alaska Native
Geographical mobility - Same house 1 year ago (%) - Multirace
Geographical mobility - Same house 1 year ago (%) - Other Race
Geographical mobility - Moved within same county (%)
Geographical mobility - Moved within same county (%) - White
Geographical mobility - Moved within same county (%) - Black or African American
Geographical mobility - Moved within same county (%) - Asian
Geographical mobility - Moved within same county (%) - Hispanic or Latino
Geographical mobility - Moved within same county (%) - American Indian and Alaska Native
Geographical mobility - Moved within same county (%) - Multirace
Geographical mobility - Moved within same county (%) - Other Race
Geographical mobility - Moved from different county within same state (%)
Geographical mobility - Moved from different county within same state (%) - White
Geographical mobility - Moved from different county within same state (%) - Black or African American
Geographical mobility - Moved from different county within same state (%) - Asian
Geographical mobility - Moved from different county within same state (%) - Hispanic or Latino
Geographical mobility - Moved from different county within same state (%) - American Indian and Alaska Native
Geographical mobility - Moved from different county within same state (%) - Multirace
Geographical mobility - Moved from different county within same state (%) - Other Race
Geographical mobility - Moved from different state (%)
Geographical mobility - Moved from different state (%) - White
Geographical mobility - Moved from different state (%) - Black or African American
Geographical mobility - Moved from different state (%) - Asian
Geographical mobility - Moved from different state (%) - Hispanic or Latino
Geographical mobility - Moved from different state (%) - American Indian and Alaska Native
Geographical mobility - Moved from different state (%) - Multirace
Geographical mobility - Moved from different state (%) - Other Race
Geographical mobility - Moved from abroad (%)
Geographical mobility - Moved from abroad (%) - White
Geographical mobility - Moved from abroad (%) - Black or African American
Geographical mobility - Moved from abroad (%) - Asian
Geographical mobility - Moved from abroad (%) - Hispanic or Latino
Geographical mobility - Moved from abroad (%) - American Indian and Alaska Native
Geographical mobility - Moved from abroad (%) - Multirace
Geographical mobility - Moved from abroad (%) - Other Race
Place of birth for the foreign-born population - Ireland (%)
Place of birth for the foreign-born population - Denmark (%)
Place of birth for the foreign-born population - Norway (%)
Place of birth for the foreign-born population - Sweden (%)
Place of birth for the foreign-born population - United Kingdom (%)
Place of birth for the foreign-born population - England (%)
Place of birth for the foreign-born population - Scotland (%)
Place of birth for the foreign-born population - Other Northern Europe (%)
Place of birth for the foreign-born population - Austria (%)
Place of birth for the foreign-born population - Belgium (%)
Place of birth for the foreign-born population - France (%)
Place of birth for the foreign-born population - Germany (%)
Place of birth for the foreign-born population - Netherlands (%)
Place of birth for the foreign-born population - Switzerland (%)
Place of birth for the foreign-born population - Other Western Europe (%)
Place of birth for the foreign-born population - Greece (%)
Place of birth for the foreign-born population - Italy (%)
Place of birth for the foreign-born population - Portugal (%)
Place of birth for the foreign-born population - Spain (%)
Place of birth for the foreign-born population - Other Southern Europe (%)
Place of birth for the foreign-born population - Albania (%)
Place of birth for the foreign-born population - Belarus (%)
Place of birth for the foreign-born population - Bosnia and Herzegovina (%)
Place of birth for the foreign-born population - Bulgaria (%)
Place of birth for the foreign-born population - Croatia (%)
Place of birth for the foreign-born population - Czechoslovakia (%)
Place of birth for the foreign-born population - Hungary (%)
Place of birth for the foreign-born population - Latvia (%)
Place of birth for the foreign-born population - Lithuania (%)
Place of birth for the foreign-born population - North Macedonia (Macedonia) (%)
Place of birth for the foreign-born population - Moldova (%)
Place of birth for the foreign-born population - Poland (%)
Place of birth for the foreign-born population - Romania (%)
Place of birth for the foreign-born population - Russia (%)
Place of birth for the foreign-born population - Serbia (%)
Place of birth for the foreign-born population - Ukraine (%)
Place of birth for the foreign-born population - Other Eastern Europe (%)
Place of birth for the foreign-born population - China (%)
Place of birth for the foreign-born population - Hong Kong (%)
Place of birth for the foreign-born population - Taiwan (%)
Place of birth for the foreign-born population - Japan (%)
Place of birth for the foreign-born population - Korea (%)
Place of birth for the foreign-born population - Other Eastern Asia (%)
Place of birth for the foreign-born population - Afghanistan (%)
Place of birth for the foreign-born population - Bangladesh (%)
Place of birth for the foreign-born population - India (%)
Place of birth for the foreign-born population - Iran (%)
Place of birth for the foreign-born population - Kazakhstan (%)
Place of birth for the foreign-born population - Nepal (%)
Place of birth for the foreign-born population - Pakistan (%)
Place of birth for the foreign-born population - Sri Lanka (%)
Place of birth for the foreign-born population - Uzbekistan (%)
Place of birth for the foreign-born population - Other South Central Asia (%)
Place of birth for the foreign-born population - Burma (%)
Place of birth for the foreign-born population - Cambodia (%)
Place of birth for the foreign-born population - Indonesia (%)
Place of birth for the foreign-born population - Laos (%)
Place of birth for the foreign-born population - Malaysia (%)
Place of birth for the foreign-born population - Philippines (%)
Place of birth for the foreign-born population - Singapore (%)
Place of birth for the foreign-born population - Thailand (%)
Place of birth for the foreign-born population - Vietnam (%)
Place of birth for the foreign-born population - Other South Eastern Asia (%)
Place of birth for the foreign-born population - Armenia (%)
Place of birth for the foreign-born population - Iraq (%)
Place of birth for the foreign-born population - Israel (%)
Place of birth for the foreign-born population - Jordan (%)
Place of birth for the foreign-born population - Kuwait (%)
Place of birth for the foreign-born population - Lebanon (%)
Place of birth for the foreign-born population - Saudi Arabia (%)
Place of birth for the foreign-born population - Syria (%)
Place of birth for the foreign-born population - Turkey (%)
Place of birth for the foreign-born population - Yemen (%)
Place of birth for the foreign-born population - Other Western Asia (%)
Place of birth for the foreign-born population - Eritrea (%)
Place of birth for the foreign-born population - Ethiopia (%)
Place of birth for the foreign-born population - Kenya (%)
Place of birth for the foreign-born population - Somalia (%)
Place of birth for the foreign-born population - Uganda (%)
Place of birth for the foreign-born population - Zimbabwe (%)
Place of birth for the foreign-born population - Other Eastern Africa (%)
Place of birth for the foreign-born population - Cameroon (%)
Place of birth for the foreign-born population - Congo (%)
Place of birth for the foreign-born population - Democratic Republic of Congo (Zaire) (%)
Place of birth for the foreign-born population - Other Middle Africa (%)
Place of birth for the foreign-born population - Egypt (%)
Place of birth for the foreign-born population - Morocco (%)
Place of birth for the foreign-born population - Sudan (%)
Place of birth for the foreign-born population - Other Northern Africa (%)
Place of birth for the foreign-born population - South Africa (%)
Place of birth for the foreign-born population - Other Southern Africa (%)
Place of birth for the foreign-born population - Cabo Verde (%)
Place of birth for the foreign-born population - Ghana (%)
Place of birth for the foreign-born population - Liberia (%)
Place of birth for the foreign-born population - Nigeria (%)
Place of birth for the foreign-born population - Senegal (%)
Place of birth for the foreign-born population - Sierra Leone (%)
Place of birth for the foreign-born population - Other Western Africa (%)
Place of birth for the foreign-born population - Australia (%)
Place of birth for the foreign-born population - New Zealand (%)
Place of birth for the foreign-born population - Fiji (%)
Place of birth for the foreign-born population - Micronesia (%)
Place of birth for the foreign-born population - Bahamas (%)
Place of birth for the foreign-born population - Barbados (%)
Place of birth for the foreign-born population - Cuba (%)
Place of birth for the foreign-born population - Dominica (%)
Place of birth for the foreign-born population - Dominican Republic (%)
Place of birth for the foreign-born population - Grenada (%)
Place of birth for the foreign-born population - Haiti (%)
Place of birth for the foreign-born population - Jamaica (%)
Place of birth for the foreign-born population - St. Vincent and the Grenadines (%)
Place of birth for the foreign-born population - Trinidad and Tobago (%)
Place of birth for the foreign-born population - West Indies (%)
Place of birth for the foreign-born population - Other Caribbean (%)
Place of birth for the foreign-born population - Belize (%)
Place of birth for the foreign-born population - Costa Rica (%)
Place of birth for the foreign-born population - El Salvador (%)
Place of birth for the foreign-born population - Guatemala (%)
Place of birth for the foreign-born population - Honduras (%)
Place of birth for the foreign-born population - Mexico (%)
Place of birth for the foreign-born population - Nicaragua (%)
Place of birth for the foreign-born population - Panama (%)
Place of birth for the foreign-born population - Other Central America (%)
Place of birth for the foreign-born population - Argentina (%)
Place of birth for the foreign-born population - Bolivia (%)
Place of birth for the foreign-born population - Brazil (%)
Place of birth for the foreign-born population - Chile (%)
Place of birth for the foreign-born population - Colombia (%)
Place of birth for the foreign-born population - Ecuador (%)
Place of birth for the foreign-born population - Guyana (%)
Place of birth for the foreign-born population - Peru (%)
Place of birth for the foreign-born population - Uruguay (%)
Place of birth for the foreign-born population - Venezuela (%)
Place of birth for the foreign-born population - Other South America (%)
Place of birth for the foreign-born population - Canada (%)
Place of birth for the foreign-born population - Other Northern America (%)
Place of birth for the foreign-born population - Other (%)
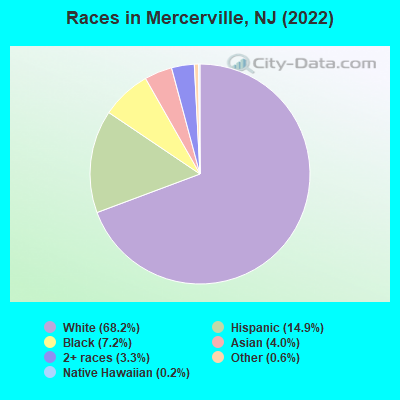
According to 2022 data, the most numerous races in Mercerville, NJ are White alone (9,717 residents), Hispanic (2,121 residents), and Black alone (1,025 residents). 80.6% of Mercerville residents speak English at home.
Race distribution in Mercerville 9,717 68.2% White alone 2,121 14.9% Hispanic 1,025 7.2% Black alone 565 4.0% Asian alone 472 3.3% Two or more races 92 0.6% Other race alone 30 0.2% Native Hawaiian and Other
2000 2022
5,557,209 66.0% White alone 1,117,191 13.3% Hispanic 1,096,171 13.0% Black alone 477,012 5.7% Asian alone 133,689 1.6% Two or more races 19,565 0.2% Other race alone 11,338 0.1% American Indian alone 2,175 0.03% Native Hawaiian and Other
4,766,476 51.5% White alone 2,028,470 21.9% Hispanic 1,111,632 12.0% Black alone 923,546 10.0% Asian alone 332,237 3.6% Two or more races 89,847 1.0% Other race alone 8,557 0.09% American Indian alone 934 0.01% Native Hawaiian and Other
Income and house value in Mercerville Median household income in 2022 $113,562 White non-Hispanic householders$97,192 Black householders$84,908 Asian householders$139,133 Two or more races householders$140,335 Hispanic or Latino race householders
Median age by race in Mercerville
48.7 Median age for White residents48.5 49.9 34.4 Median age for Black or African American residents35.4 26.5 -1,134,860,049.8 Median age for American Indian / Alaska Native residents-862,632,083.7 -1,562,962,961.4 37.9 Median age for Asian residents37.2 38.6 -804,177,544.9 Median age for Native Hawaiian / Pacific Islander residents-860,335,194.7 -713,070,378.3 36.4 Median age for Other race residents35.2 37.1 20.0 Median age for Two or more races residents31.5 18.6 50.4 Median age for White alone residents49.4 52.1 16.3 Median age for Hispanic or Latino residents16.3 16.1
Owner/renter occupied households by race in Mercerville
House owners and renters - White residents 3,599 87.3% Owner occupied521 12.7% Renter occupiedHouse owners and renters - Black or African American residents 163 53.4% Owner occupied142 46.6% Renter occupiedHouse owners and renters - Asian residents 124 67.9% Owner occupied58 32.1% Renter occupiedHouse owners and renters - Other race residents 169 100.0% Owner occupiedHouse owners and renters - Two or more races residents 292 100.0% Owner occupiedHouse owners and renters - White alone residents 3,531 86.5% Owner occupied550 13.5% Renter occupiedHouse owners and renters - Hispanic or Latino residents 512 94.6% Owner occupied29 5.4% Renter occupied
Language usage in Mercerville
English speakers - Total 80.6% of residents of Mercerville speak English at home.
9.0% of residents speak Spanish at home 926 76.2% Speak English very well289 23.8% Speak English less than very well8.3% of residents speak other language at home 611 54.2% Speak English very well517 45.8% Speak English less than very well
English speakers - Born in the United States 93.2% of residents of Mercerville speak English at home.
4.4% of residents speak Spanish at home 107 100.0% Speak English very well1.6% of residents speak other language at home 38 100.0% Speak English very well
English speakers - Native, born elsewhere 43.7% of residents of Mercerville speak English at home.
36.8% of residents speak Spanish at home 26 81.2% Speak English very well6 18.8% Speak English less than very well34.5% of residents speak other language at home 30 100.0% Speak English very well
English speakers - Foreign-born 24.6% of residents of Mercerville speak English at home.
25.4% of residents speak Spanish at home 243 63.1% Speak English very well142 36.9% Speak English less than very well52.7% of residents speak other language at home 302 37.8% Speak English very well498 62.2% Speak English less than very well
White (Caucasian) - Speak only English Native:
94.1% (8,722)Foreign-born:
44.9% (244)
White (Caucasian) - Speak another language Native:
6.4% (594)Foreign-born:
58.1% (316)
Black or African American - Speak only English Native:
93.9% (843)Foreign-born:
4.8% (7)
Black or African American - Speak another language Native:
5.3% (48)Foreign-born:
100.0% (151)
Asian - Speak only English Native:
69.2% (92)Foreign-born:
8.4% (28)
Asian - Speak another language Native:
30.6% (41)Foreign-born:
92.4% (313)
Other race - Speak another language Native:
28.8% (122)Foreign-born:
94.6% (71)
Two or more races - Speak only English Native:
67.7% (535)Foreign-born:
22.1% (45)
Two or more races - Speak another language Native:
26.0% (205)Foreign-born:
80.6% (163)
White alone - Speak only English Native:
95.4% (8,447)Foreign-born:
47.4% (255)
White alone - Speak another language Native:
4.2% (369)Foreign-born:
47.1% (253)
Hispanic or Latino - Speak only English Native:
53.9% (751)Foreign-born:
11.1% (45)
Hispanic or Latino - Speak another language Native:
46.9% (653)Foreign-born:
89.8% (361)
Foreign-born residents in Mercerville
Marital status for residents in Mercerville Marital status - White (Caucasian) population 15 years and over
Males 27.2% Never married62.2% Now married0.8% Separated3.4% Widowed6.4% DivorcedFemales 23.3% Never married55.4% Now married3.3% Separated9.8% Widowed8.2% DivorcedWomen who gave birth in the past 12 months Now married:
100.0% (117)Unmarried:
0.0% (0)
Women who did not give birth in the past 12 months Now married:
51.1% (1,034)Unmarried:
48.9% (990)
Marital status - Black or African American population 15 years and over
Males 30.4% Never married63.4% Now married6.2% Separated0.0% Widowed0.0% DivorcedFemales 49.1% Never married45.3% Now married0.0% Separated4.2% Widowed1.5% DivorcedWomen who did not give birth in the past 12 months Now married:
41.0% (145)Unmarried:
59.0% (209)
Marital status - Asian population 15 years and over
Males 11.9% Never married82.7% Now married0.0% Separated5.4% Widowed0.0% DivorcedFemales 9.0% Never married60.7% Now married0.0% Separated11.9% Widowed18.4% DivorcedWomen who gave birth in the past 12 months Now married:
100.0% (17)Unmarried:
0.0% (0)
Women who did not give birth in the past 12 months Now married:
67.9% (94)Unmarried:
32.1% (44)
Marital status - Other race population 15 years and over
Males 45.9% Never married54.1% Now married0.0% Separated0.0% Widowed0.0% DivorcedFemales 23.5% Never married36.4% Now married0.0% Separated5.9% Widowed34.2% DivorcedWomen who did not give birth in the past 12 months Now married:
42.3% (59)Unmarried:
57.7% (81)
Marital status - Two or more races population 15 years and over
Males 22.0% Never married78.0% Now married0.0% Separated0.0% Widowed0.0% DivorcedFemales 24.8% Never married63.4% Now married0.0% Separated0.0% Widowed11.8% DivorcedWomen who did not give birth in the past 12 months Now married:
68.3% (160)Unmarried:
31.7% (74)
Marital status - White alone, not Hispanic / Latino population 15 years and over
Males 26.6% Never married62.7% Now married0.9% Separated3.6% Widowed6.3% DivorcedFemales 23.6% Never married55.9% Now married3.5% Separated8.8% Widowed8.1% DivorcedWomen who gave birth in the past 12 months Now married:
100.0% (125)Unmarried:
0.0% (0)
Women who did not give birth in the past 12 months Now married:
50.9% (975)Unmarried:
49.1% (941)
Marital status - Hispanic or Latino population 15 years and over
Males 31.6% Never married65.5% Now married0.0% Separated0.0% Widowed2.9% DivorcedFemales 20.4% Never married44.0% Now married0.0% Separated18.4% Widowed17.2% DivorcedWomen who did not give birth in the past 12 months Now married:
52.1% (233)Unmarried:
47.9% (214)
Ancestries in Mercerville
1,487 23.2% Italian728 11.4% German416 6.5% Polish372 5.8% Irish206 3.2% American172 2.7% English101 1.6% European88 1.4% Ukrainian73 1.1% Haitian58 0.9% Dutch50 0.8% Hungarian45 0.7% Egyptian39 0.6% Scottish30 0.5% African27 0.4% Portuguese25 0.4% Ghanaian24 0.4% Greek20 0.3% Brazilian20 0.3% Slavic14 0.2% Norwegian10 0.2% French7 0.1% Slovak7 0.1% Turkish
Children Nativity (place of birth) in Mercerville
Children under 6 years - Living with two parents Both parents native 452 100.0% NativeBoth parents foreign-born 101 84.3% Native19 15.7% Foreign-bornOne native, one foreign-born parent 98 100.0% NativeChildren under 6 years - Living with one parent Native parent 47 100.0% NativeChildren 6 to 17 years - Living with two parents Both parents native 1,243 100.0% NativeBoth parents foreign-born 249 97.1% Native8 2.9% Foreign-bornOne native, one foreign-born parent 193 100.0% NativeChildren 6 to 17 years - Living with one parent Native parent 261 100.0% NativeForeign-born parent 159 48.1% Native171 51.9% Foreign-born
Grandparents responsible for own grandchildren in Mercerville
Grandparents (30 to 59 years) White / Caucasian 26 100.0% Responsible for grandchildrenWhite alone, not Hispanic / Latino 31 100.0% Responsible for grandchildrenGrandparents (60 years and over) White / Caucasian 66 61.7% Responsible for grandchildren41 38.3% Not responsible for grandchildrenWhite alone, not Hispanic / Latino 43 54.9% Responsible for grandchildren35 45.1% Not responsible for grandchildren