Races in McNair, Virginia (VA) Detailed Stats
Data:
Races - White alone (%)
Races - White alone (% change since 2000)
Races - Black alone (%)
Races - Black alone (% change since 2000)
Races - American Indian alone (%)
Races - American Indian alone (% change since 2000)
Races - Asian alone (%)
Races - Asian alone (% change since 2000)
Races - Hispanic (%)
Races - Hispanic (% change since 2000)
Races - Native Hawaiian and Other Pacific Islander alone (%)
Races - Native Hawaiian and Other Pacific Islander alone (% change since 2000)
Races - Two or more races(%)
Races - Two or more races(% change since 2000)
Races - Other race alone (%)
Races - Other race alone (% change since 2000)
Racial diversity
Place of birth - Born in state of residence (%)
Place of birth - Born in state of residence (%) - White
Place of birth - Born in state of residence (%) - Black or African American
Place of birth - Born in state of residence (%) - Asian
Place of birth - Born in state of residence (%) - Hispanic or Latino
Place of birth - Born in state of residence (%) - American Indian and Alaska Native
Place of birth - Born in state of residence (%) - Multirace
Place of birth - Born in state of residence (%) - Other Race
Place of birth - Born in other state (%)
Place of birth - Born in other state (%) - White
Place of birth - Born in other state (%) - Black or African American
Place of birth - Born in other state (%) - Asian
Place of birth - Born in other state (%) - Hispanic or Latino
Place of birth - Born in other state (%) - American Indian and Alaska Native
Place of birth - Born in other state (%) - Multirace
Place of birth - Born in other state (%) - Other Race
Place of birth - Native, outside of US (%)
Place of birth - Native, outside of US (%) - White
Place of birth - Native, outside of US (%) - Black or African American
Place of birth - Native, outside of US (%) - Asian
Place of birth - Native, outside of US (%) - Hispanic or Latino
Place of birth - Native, outside of US (%) - American Indian and Alaska Native
Place of birth - Native, outside of US (%) - Multirace
Place of birth - Native, outside of US (%) - Other Race
Place of birth - Foreign born (%)
Place of birth - Foreign born (%) - White
Place of birth - Foreign born (%) - Black or African American
Place of birth - Foreign born (%) - Asian
Place of birth - Foreign born (%) - Hispanic or Latino
Place of birth - Foreign born (%) - American Indian and Alaska Native
Place of birth - Foreign born (%) - Multirace
Place of birth - Foreign born (%) - Other Race
Residents speaking English at home (%)
Residents speaking English at home - Born in the United States (%)
Residents speaking English at home - Native, born elsewhere (%)
Residents speaking English at home - Foreign born (%)
Residents speaking Spanish at home (%)
Residents speaking Spanish at home - Born in the United States (%)
Residents speaking Spanish at home - Native, born elsewhere (%)
Residents speaking Spanish at home - Foreign born (%)
Residents speaking other language at home (%)
Residents speaking other language at home - Born in the United States (%)
Residents speaking other language at home - Native, born elsewhere (%)
Residents speaking other language at home - Foreign born (%)
Marital status - Never married (%)
Marital status - Now married (%)
Marital status - Separated (%)
Marital status - Widowed (%)
Marital status - Divorced (%)
Ancestries Reported - Arab (%)
Ancestries Reported - Czech (%)
Ancestries Reported - Danish (%)
Ancestries Reported - Dutch (%)
Ancestries Reported - English (%)
Ancestries Reported - French (%)
Ancestries Reported - French Canadian (%)
Ancestries Reported - German (%)
Ancestries Reported - Greek (%)
Ancestries Reported - Hungarian (%)
Ancestries Reported - Irish (%)
Ancestries Reported - Italian (%)
Ancestries Reported - Lithuanian (%)
Ancestries Reported - Norwegian (%)
Ancestries Reported - Polish (%)
Ancestries Reported - Portuguese (%)
Ancestries Reported - Russian (%)
Ancestries Reported - Scotch-Irish (%)
Ancestries Reported - Scottish (%)
Ancestries Reported - Slovak (%)
Ancestries Reported - Subsaharan African (%)
Ancestries Reported - Swedish (%)
Ancestries Reported - Swiss (%)
Ancestries Reported - Ukrainian (%)
Ancestries Reported - United States (%)
Ancestries Reported - Welsh (%)
Ancestries Reported - West Indian (%)
Ancestries Reported - Other (%)
Geographical mobility - Same house 1 year ago (%)
Geographical mobility - Same house 1 year ago (%) - White
Geographical mobility - Same house 1 year ago (%) - Black or African American
Geographical mobility - Same house 1 year ago (%) - Asian
Geographical mobility - Same house 1 year ago (%) - Hispanic or Latino
Geographical mobility - Same house 1 year ago (%) - American Indian and Alaska Native
Geographical mobility - Same house 1 year ago (%) - Multirace
Geographical mobility - Same house 1 year ago (%) - Other Race
Geographical mobility - Moved within same county (%)
Geographical mobility - Moved within same county (%) - White
Geographical mobility - Moved within same county (%) - Black or African American
Geographical mobility - Moved within same county (%) - Asian
Geographical mobility - Moved within same county (%) - Hispanic or Latino
Geographical mobility - Moved within same county (%) - American Indian and Alaska Native
Geographical mobility - Moved within same county (%) - Multirace
Geographical mobility - Moved within same county (%) - Other Race
Geographical mobility - Moved from different county within same state (%)
Geographical mobility - Moved from different county within same state (%) - White
Geographical mobility - Moved from different county within same state (%) - Black or African American
Geographical mobility - Moved from different county within same state (%) - Asian
Geographical mobility - Moved from different county within same state (%) - Hispanic or Latino
Geographical mobility - Moved from different county within same state (%) - American Indian and Alaska Native
Geographical mobility - Moved from different county within same state (%) - Multirace
Geographical mobility - Moved from different county within same state (%) - Other Race
Geographical mobility - Moved from different state (%)
Geographical mobility - Moved from different state (%) - White
Geographical mobility - Moved from different state (%) - Black or African American
Geographical mobility - Moved from different state (%) - Asian
Geographical mobility - Moved from different state (%) - Hispanic or Latino
Geographical mobility - Moved from different state (%) - American Indian and Alaska Native
Geographical mobility - Moved from different state (%) - Multirace
Geographical mobility - Moved from different state (%) - Other Race
Geographical mobility - Moved from abroad (%)
Geographical mobility - Moved from abroad (%) - White
Geographical mobility - Moved from abroad (%) - Black or African American
Geographical mobility - Moved from abroad (%) - Asian
Geographical mobility - Moved from abroad (%) - Hispanic or Latino
Geographical mobility - Moved from abroad (%) - American Indian and Alaska Native
Geographical mobility - Moved from abroad (%) - Multirace
Geographical mobility - Moved from abroad (%) - Other Race
Place of birth for the foreign-born population - Ireland (%)
Place of birth for the foreign-born population - Denmark (%)
Place of birth for the foreign-born population - Norway (%)
Place of birth for the foreign-born population - Sweden (%)
Place of birth for the foreign-born population - United Kingdom (%)
Place of birth for the foreign-born population - England (%)
Place of birth for the foreign-born population - Scotland (%)
Place of birth for the foreign-born population - Other Northern Europe (%)
Place of birth for the foreign-born population - Austria (%)
Place of birth for the foreign-born population - Belgium (%)
Place of birth for the foreign-born population - France (%)
Place of birth for the foreign-born population - Germany (%)
Place of birth for the foreign-born population - Netherlands (%)
Place of birth for the foreign-born population - Switzerland (%)
Place of birth for the foreign-born population - Other Western Europe (%)
Place of birth for the foreign-born population - Greece (%)
Place of birth for the foreign-born population - Italy (%)
Place of birth for the foreign-born population - Portugal (%)
Place of birth for the foreign-born population - Spain (%)
Place of birth for the foreign-born population - Other Southern Europe (%)
Place of birth for the foreign-born population - Albania (%)
Place of birth for the foreign-born population - Belarus (%)
Place of birth for the foreign-born population - Bosnia and Herzegovina (%)
Place of birth for the foreign-born population - Bulgaria (%)
Place of birth for the foreign-born population - Croatia (%)
Place of birth for the foreign-born population - Czechoslovakia (%)
Place of birth for the foreign-born population - Hungary (%)
Place of birth for the foreign-born population - Latvia (%)
Place of birth for the foreign-born population - Lithuania (%)
Place of birth for the foreign-born population - North Macedonia (Macedonia) (%)
Place of birth for the foreign-born population - Moldova (%)
Place of birth for the foreign-born population - Poland (%)
Place of birth for the foreign-born population - Romania (%)
Place of birth for the foreign-born population - Russia (%)
Place of birth for the foreign-born population - Serbia (%)
Place of birth for the foreign-born population - Ukraine (%)
Place of birth for the foreign-born population - Other Eastern Europe (%)
Place of birth for the foreign-born population - China (%)
Place of birth for the foreign-born population - Hong Kong (%)
Place of birth for the foreign-born population - Taiwan (%)
Place of birth for the foreign-born population - Japan (%)
Place of birth for the foreign-born population - Korea (%)
Place of birth for the foreign-born population - Other Eastern Asia (%)
Place of birth for the foreign-born population - Afghanistan (%)
Place of birth for the foreign-born population - Bangladesh (%)
Place of birth for the foreign-born population - India (%)
Place of birth for the foreign-born population - Iran (%)
Place of birth for the foreign-born population - Kazakhstan (%)
Place of birth for the foreign-born population - Nepal (%)
Place of birth for the foreign-born population - Pakistan (%)
Place of birth for the foreign-born population - Sri Lanka (%)
Place of birth for the foreign-born population - Uzbekistan (%)
Place of birth for the foreign-born population - Other South Central Asia (%)
Place of birth for the foreign-born population - Burma (%)
Place of birth for the foreign-born population - Cambodia (%)
Place of birth for the foreign-born population - Indonesia (%)
Place of birth for the foreign-born population - Laos (%)
Place of birth for the foreign-born population - Malaysia (%)
Place of birth for the foreign-born population - Philippines (%)
Place of birth for the foreign-born population - Singapore (%)
Place of birth for the foreign-born population - Thailand (%)
Place of birth for the foreign-born population - Vietnam (%)
Place of birth for the foreign-born population - Other South Eastern Asia (%)
Place of birth for the foreign-born population - Armenia (%)
Place of birth for the foreign-born population - Iraq (%)
Place of birth for the foreign-born population - Israel (%)
Place of birth for the foreign-born population - Jordan (%)
Place of birth for the foreign-born population - Kuwait (%)
Place of birth for the foreign-born population - Lebanon (%)
Place of birth for the foreign-born population - Saudi Arabia (%)
Place of birth for the foreign-born population - Syria (%)
Place of birth for the foreign-born population - Turkey (%)
Place of birth for the foreign-born population - Yemen (%)
Place of birth for the foreign-born population - Other Western Asia (%)
Place of birth for the foreign-born population - Eritrea (%)
Place of birth for the foreign-born population - Ethiopia (%)
Place of birth for the foreign-born population - Kenya (%)
Place of birth for the foreign-born population - Somalia (%)
Place of birth for the foreign-born population - Uganda (%)
Place of birth for the foreign-born population - Zimbabwe (%)
Place of birth for the foreign-born population - Other Eastern Africa (%)
Place of birth for the foreign-born population - Cameroon (%)
Place of birth for the foreign-born population - Congo (%)
Place of birth for the foreign-born population - Democratic Republic of Congo (Zaire) (%)
Place of birth for the foreign-born population - Other Middle Africa (%)
Place of birth for the foreign-born population - Egypt (%)
Place of birth for the foreign-born population - Morocco (%)
Place of birth for the foreign-born population - Sudan (%)
Place of birth for the foreign-born population - Other Northern Africa (%)
Place of birth for the foreign-born population - South Africa (%)
Place of birth for the foreign-born population - Other Southern Africa (%)
Place of birth for the foreign-born population - Cabo Verde (%)
Place of birth for the foreign-born population - Ghana (%)
Place of birth for the foreign-born population - Liberia (%)
Place of birth for the foreign-born population - Nigeria (%)
Place of birth for the foreign-born population - Senegal (%)
Place of birth for the foreign-born population - Sierra Leone (%)
Place of birth for the foreign-born population - Other Western Africa (%)
Place of birth for the foreign-born population - Australia (%)
Place of birth for the foreign-born population - New Zealand (%)
Place of birth for the foreign-born population - Fiji (%)
Place of birth for the foreign-born population - Micronesia (%)
Place of birth for the foreign-born population - Bahamas (%)
Place of birth for the foreign-born population - Barbados (%)
Place of birth for the foreign-born population - Cuba (%)
Place of birth for the foreign-born population - Dominica (%)
Place of birth for the foreign-born population - Dominican Republic (%)
Place of birth for the foreign-born population - Grenada (%)
Place of birth for the foreign-born population - Haiti (%)
Place of birth for the foreign-born population - Jamaica (%)
Place of birth for the foreign-born population - St. Vincent and the Grenadines (%)
Place of birth for the foreign-born population - Trinidad and Tobago (%)
Place of birth for the foreign-born population - West Indies (%)
Place of birth for the foreign-born population - Other Caribbean (%)
Place of birth for the foreign-born population - Belize (%)
Place of birth for the foreign-born population - Costa Rica (%)
Place of birth for the foreign-born population - El Salvador (%)
Place of birth for the foreign-born population - Guatemala (%)
Place of birth for the foreign-born population - Honduras (%)
Place of birth for the foreign-born population - Mexico (%)
Place of birth for the foreign-born population - Nicaragua (%)
Place of birth for the foreign-born population - Panama (%)
Place of birth for the foreign-born population - Other Central America (%)
Place of birth for the foreign-born population - Argentina (%)
Place of birth for the foreign-born population - Bolivia (%)
Place of birth for the foreign-born population - Brazil (%)
Place of birth for the foreign-born population - Chile (%)
Place of birth for the foreign-born population - Colombia (%)
Place of birth for the foreign-born population - Ecuador (%)
Place of birth for the foreign-born population - Guyana (%)
Place of birth for the foreign-born population - Peru (%)
Place of birth for the foreign-born population - Uruguay (%)
Place of birth for the foreign-born population - Venezuela (%)
Place of birth for the foreign-born population - Other South America (%)
Place of birth for the foreign-born population - Canada (%)
Place of birth for the foreign-born population - Other Northern America (%)
Place of birth for the foreign-born population - Other (%)
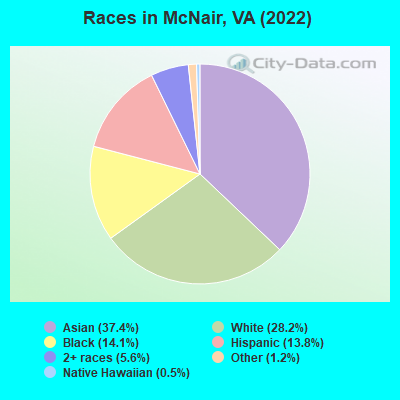
According to 2022 data, the most numerous races in McNair, VA are White alone (6,215 residents), Black alone (3,117 residents), and Hispanic (3,041 residents). 43.8% of McNair residents speak English at home.
Race distribution in McNair 8,251 37.4% Asian alone 6,215 28.2% White alone 3,117 14.1% Black alone 3,041 13.8% Hispanic 1,230 5.6% Two or more races 264 1.2% Other race alone 116 0.5% Native Hawaiian and Other 11 0.05% American Indian alone
2000 2022
4,965,637 70.2% White alone 1,376,378 19.4% Black alone 329,540 4.7% Hispanic 259,277 3.7% Asian alone 114,022 1.6% Two or more races 18,596 0.3% American Indian alone 11,685 0.2% Other race alone 3,380 0.05% Native Hawaiian and Other
5,095,130 58.7% White alone 1,594,785 18.4% Black alone 905,750 10.4% Hispanic 602,881 6.9% Asian alone 406,047 4.7% Two or more races 60,419 0.7% Other race alone 11,738 0.1% American Indian alone 6,869 0.08% Native Hawaiian and Other
Income and house value in McNair Median household income in 2022 $109,549 White non-Hispanic householders$85,880 Black householders$129,322 Asian householders$67,542 Some other race householders$102,630 Two or more races householders$95,429 Hispanic or Latino race householders
Median age by race in McNair
30.8 Median age for White residents30.8 29.8 31.5 Median age for Black or African American residents34.6 31.6 -754,182,753.4 Median age for American Indian / Alaska Native residents-964,539,006.1 -669,005,847.3 34.8 Median age for Asian residents33.1 35.5 33.7 Median age for Native Hawaiian / Pacific Islander residents-558,791,801.0 31.1 27.7 Median age for Other race residents25.6 30.4 32.6 Median age for Two or more races residents31.8 41.5 30.8 Median age for White alone residents31.0 30.3 28.8 Median age for Hispanic or Latino residents27.1 36.6
Owner/renter occupied households by race in McNair
House owners and renters - White residents 672 19.7% Owner occupied2,732 80.3% Renter occupiedHouse owners and renters - Black or African American residents 146 11.8% Owner occupied1,091 88.2% Renter occupiedHouse owners and renters - Asian residents 1,059 35.5% Owner occupied1,921 64.5% Renter occupiedHouse owners and renters - Native Hawaiian / Pacific Islander residents 22 41.2% Owner occupied31 58.8% Renter occupiedHouse owners and renters - Other race residents 45 17.6% Owner occupied212 82.4% Renter occupiedHouse owners and renters - Two or more races residents 43 3.7% Owner occupied1,100 96.3% Renter occupiedHouse owners and renters - White alone residents 696 20.8% Owner occupied2,651 79.2% Renter occupiedHouse owners and renters - Hispanic or Latino residents 28 2.8% Owner occupied964 97.2% Renter occupied
Language usage in McNair
English speakers - Total 43.8% of residents of McNair speak English at home.
9.9% of residents speak Spanish at home 1,022 50.6% Speak English very well997 49.4% Speak English less than very well46.0% of residents speak other language at home 7,050 75.0% Speak English very well2,344 25.0% Speak English less than very well
English speakers - Born in the United States 81.3% of residents of McNair speak English at home.
4.7% of residents speak Spanish at home 238 80.7% Speak English very well57 19.3% Speak English less than very well13.5% of residents speak other language at home 781 92.0% Speak English very well68 8.0% Speak English less than very well
English speakers - Native, born elsewhere 44.5% of residents of McNair speak English at home.
5.9% of residents speak Spanish at home 28 60.9% Speak English very well18 39.1% Speak English less than very well52.3% of residents speak other language at home 406 100.0% Speak English very well
English speakers - Foreign-born 9.6% of residents of McNair speak English at home.
13.1% of residents speak Spanish at home 355 28.2% Speak English very well906 71.8% Speak English less than very well76.4% of residents speak other language at home 5,080 69.2% Speak English very well2,257 30.8% Speak English less than very well
White (Caucasian) - Speak only English Native:
87.2% (5,097)Foreign-born:
14.1% (78)
White (Caucasian) - Speak another language Native:
11.0% (644)Foreign-born:
81.7% (454)
Black or African American - Speak only English Native:
73.0% (1,226)Foreign-born:
7.5% (90)
Black or African American - Speak another language Native:
30.3% (509)Foreign-born:
88.7% (1,068)
Asian - Speak only English Native:
37.6% (593)Foreign-born:
8.5% (522)
Asian - Speak another language Native:
63.4% (1,000)Foreign-born:
90.8% (5,561)
Native Hawaiian / Pacific Islander - Speak only English Native:
48.3% (38)Foreign-born:
47.9% (27)
Other race - Speak only English Native:
84.0% (307)Foreign-born:
41.2% (191)
Other race - Speak another language Native:
28.4% (104)Foreign-born:
66.1% (305)
Two or more races - Speak only English Native:
61.4% (838)Foreign-born:
4.4% (80)
Two or more races - Speak another language Native:
39.5% (540)Foreign-born:
95.6% (1,722)
White alone - Speak only English Native:
89.4% (4,836)Foreign-born:
15.6% (77)
White alone - Speak another language Native:
10.0% (543)Foreign-born:
82.6% (409)
Hispanic or Latino - Speak only English Native:
52.5% (799)Foreign-born:
4.9% (65)
Hispanic or Latino - Speak another language Native:
48.5% (739)Foreign-born:
95.1% (1,263)
Foreign-born residents in McNair
Marital status for residents in McNair Marital status - White (Caucasian) population 15 years and over
Males 52.3% Never married38.3% Now married0.0% Separated0.8% Widowed8.7% DivorcedFemales 46.4% Never married40.2% Now married2.1% Separated2.0% Widowed9.3% DivorcedWomen who gave birth in the past 12 months Now married:
100.0% (87)Unmarried:
0.0% (0)
Women who did not give birth in the past 12 months Now married:
37.4% (732)Unmarried:
62.6% (1,224)
Marital status - Black or African American population 15 years and over
Males 36.5% Never married49.7% Now married0.0% Separated1.1% Widowed12.6% DivorcedFemales 51.5% Never married31.3% Now married12.2% Separated0.0% Widowed5.0% DivorcedWomen who gave birth in the past 12 months Now married:
100.0% (45)Unmarried:
0.0% (0)
Women who did not give birth in the past 12 months Now married:
40.2% (438)Unmarried:
59.8% (651)
Marital status - Asian population 15 years and over
Males 31.7% Never married66.4% Now married0.6% Separated0.3% Widowed1.0% DivorcedFemales 17.9% Never married75.6% Now married0.6% Separated4.2% Widowed1.6% DivorcedWomen who gave birth in the past 12 months Now married:
100.0% (253)Unmarried:
0.0% (0)
Women who did not give birth in the past 12 months Now married:
77.0% (1,707)Unmarried:
23.0% (511)
Marital status - Native Hawaiian / Pacific Islander population 15 years and over
Males 100.0% Never married0.0% Now married0.0% Separated0.0% Widowed0.0% DivorcedFemales 100.0% Never married0.0% Now married0.0% Separated0.0% Widowed0.0% DivorcedWomen who did not give birth in the past 12 months Now married:
0.0% (0)Unmarried:
100.0% (52)
Marital status - Other race population 15 years and over
Males 46.3% Never married39.2% Now married6.8% Separated0.0% Widowed7.7% DivorcedFemales 25.3% Never married61.7% Now married0.4% Separated0.0% Widowed12.6% DivorcedWomen who did not give birth in the past 12 months Now married:
68.7% (203)Unmarried:
31.2% (92)
Marital status - Two or more races population 15 years and over
Males 56.0% Never married40.9% Now married0.5% Separated0.0% Widowed2.6% DivorcedFemales 30.3% Never married57.8% Now married4.3% Separated1.4% Widowed6.1% DivorcedWomen who gave birth in the past 12 months Now married:
100.0% (19)Unmarried:
0.0% (0)
Women who did not give birth in the past 12 months Now married:
60.7% (662)Unmarried:
39.3% (429)
Marital status - White alone, not Hispanic / Latino population 15 years and over
Males 49.1% Never married40.6% Now married0.0% Separated0.9% Widowed9.5% DivorcedFemales 47.8% Never married41.0% Now married0.3% Separated2.1% Widowed8.8% DivorcedWomen who gave birth in the past 12 months Now married:
100.0% (95)Unmarried:
0.0% (0)
Women who did not give birth in the past 12 months Now married:
35.8% (686)Unmarried:
64.2% (1,232)
Marital status - Hispanic or Latino population 15 years and over
Males 62.6% Never married32.8% Now married1.5% Separated0.0% Widowed3.2% DivorcedFemales 27.0% Never married56.2% Now married6.1% Separated1.4% Widowed9.2% DivorcedWomen who did not give birth in the past 12 months Now married:
64.8% (541)Unmarried:
35.2% (294)
Ancestries in McNair
673 4.8% Ethiopian502 3.6% Irish329 2.3% Italian318 2.3% German313 2.2% Afghan306 2.2% Sudanese161 1.1% European151 1.1% American141 1.0% African116 0.8% English99 0.7% French Canadian93 0.7% Eastern European89 0.6% British80 0.6% Dutch74 0.5% Palestinian70 0.5% Jordanian64 0.5% Scottish64 0.5% Polish52 0.4% Sierra Leonean40 0.3% Arab37 0.3% Hungarian35 0.2% Welsh32 0.2% Liberian30 0.2% Jamaican30 0.2% Egyptian27 0.2% Scandinavian24 0.2% Serbian17 0.1% Nigerian13 0.09% Ukrainian12 0.09% Celtic12 0.09% Russian10 0.07% Haitian9 0.06% Romanian9 0.06% Latvian8 0.06% Pennsylvania German8 0.06% Croatian7 0.05% Lebanese7 0.05% Slovak5 0.04% Brazilian5 0.04% Northern European4 0.03% Scotch-Irish3 0.02% Canadian
Geographical mobility in McNair Same house 1 year ago 4,565 68.8% White (Caucasian)2,645 85.8% Black or African American9 96.1% American Indian / Alaska Native5,608 69.6% Asian144 95.3% Native Hawaiian / Pacific Islander875 96.4% Other race2,523 73.7% Two or more races4,036 65.9% White alone, not Hispanic / Latino2,647 86.9% Hispanic or LatinoMoved within same county 1,132 17.0% White / Caucasian104 3.4% Black or African American996 12.4% Asian602 17.6% Two or more races1,131 18.5% White alone, not Hispanic / Latino181 5.9% Hispanic or LatinoMoved within same state 423 6.4% White / Caucasian102 3.3% Black or African American299 3.7% Asian49 5.4% Other race94 2.8% Two or more races447 7.3% White alone, not Hispanic / Latino71 2.3% Hispanic or LatinoMoved from different state 501 7.5% White / Caucasian168 5.5% Black or African American769 9.5% Asian271 7.9% Two or more races500 8.2% White alone, not Hispanic / Latino118 3.9% Hispanic or LatinoMoved from abroad 44 0.7% White65 2.1% Black or African American443 5.5% Asian13 1.5% Other race49 0.8% White alone, not Hispanic / Latino14 0.4% Hispanic or Latino
Children Nativity (place of birth) in McNair
Children under 6 years - Living with two parents Both parents native 224 99.8% Native0 0.2% Foreign-bornBoth parents foreign-born 1,031 95.6% Native48 4.4% Foreign-bornOne native, one foreign-born parent 289 96.7% Native10 3.3% Foreign-bornChildren under 6 years - Living with one parent Native parent 257 100.0% NativeForeign-born parent 64 27.3% Native169 72.7% Foreign-bornChildren 6 to 17 years - Living with two parents Both parents native 222 100.0% Native0 0.0% Foreign-bornBoth parents foreign-born 755 60.7% Native489 39.3% Foreign-bornOne native, one foreign-born parent 375 96.4% Native14 3.6% Foreign-bornChildren 6 to 17 years - Living with one parent Native parent 81 100.0% NativeForeign-born parent 125 51.3% Native119 48.7% Foreign-born
Grandparents responsible for own grandchildren in McNair
Grandparents (30 to 59 years) White / Caucasian 33 100.0% Not responsible for grandchildrenAsian 22 100.0% Not responsible for grandchildrenTwo or more races 11 100.0% Not responsible for grandchildrenWhite alone, not Hispanic / Latino 30 100.0% Not responsible for grandchildrenHispanic or Latino 32 100.0% Not responsible for grandchildren
Grandparents (60 years and over) White / Caucasian 21 100.0% Not responsible for grandchildrenAsian 75 100.0% Not responsible for grandchildrenTwo or more races 22 100.0% Not responsible for grandchildrenWhite alone, not Hispanic / Latino 24 100.0% Not responsible for grandchildrenHispanic or Latino 23 100.0% Not responsible for grandchildren