Races in McLean, Virginia (VA) Detailed Stats
Data:
Races - White alone (%)
Races - White alone (% change since 2000)
Races - Black alone (%)
Races - Black alone (% change since 2000)
Races - American Indian alone (%)
Races - American Indian alone (% change since 2000)
Races - Asian alone (%)
Races - Asian alone (% change since 2000)
Races - Hispanic (%)
Races - Hispanic (% change since 2000)
Races - Native Hawaiian and Other Pacific Islander alone (%)
Races - Native Hawaiian and Other Pacific Islander alone (% change since 2000)
Races - Two or more races(%)
Races - Two or more races(% change since 2000)
Races - Other race alone (%)
Races - Other race alone (% change since 2000)
Racial diversity
Place of birth - Born in state of residence (%)
Place of birth - Born in state of residence (%) - White
Place of birth - Born in state of residence (%) - Black or African American
Place of birth - Born in state of residence (%) - Asian
Place of birth - Born in state of residence (%) - Hispanic or Latino
Place of birth - Born in state of residence (%) - American Indian and Alaska Native
Place of birth - Born in state of residence (%) - Multirace
Place of birth - Born in state of residence (%) - Other Race
Place of birth - Born in other state (%)
Place of birth - Born in other state (%) - White
Place of birth - Born in other state (%) - Black or African American
Place of birth - Born in other state (%) - Asian
Place of birth - Born in other state (%) - Hispanic or Latino
Place of birth - Born in other state (%) - American Indian and Alaska Native
Place of birth - Born in other state (%) - Multirace
Place of birth - Born in other state (%) - Other Race
Place of birth - Native, outside of US (%)
Place of birth - Native, outside of US (%) - White
Place of birth - Native, outside of US (%) - Black or African American
Place of birth - Native, outside of US (%) - Asian
Place of birth - Native, outside of US (%) - Hispanic or Latino
Place of birth - Native, outside of US (%) - American Indian and Alaska Native
Place of birth - Native, outside of US (%) - Multirace
Place of birth - Native, outside of US (%) - Other Race
Place of birth - Foreign born (%)
Place of birth - Foreign born (%) - White
Place of birth - Foreign born (%) - Black or African American
Place of birth - Foreign born (%) - Asian
Place of birth - Foreign born (%) - Hispanic or Latino
Place of birth - Foreign born (%) - American Indian and Alaska Native
Place of birth - Foreign born (%) - Multirace
Place of birth - Foreign born (%) - Other Race
Residents speaking English at home (%)
Residents speaking English at home - Born in the United States (%)
Residents speaking English at home - Native, born elsewhere (%)
Residents speaking English at home - Foreign born (%)
Residents speaking Spanish at home (%)
Residents speaking Spanish at home - Born in the United States (%)
Residents speaking Spanish at home - Native, born elsewhere (%)
Residents speaking Spanish at home - Foreign born (%)
Residents speaking other language at home (%)
Residents speaking other language at home - Born in the United States (%)
Residents speaking other language at home - Native, born elsewhere (%)
Residents speaking other language at home - Foreign born (%)
Marital status - Never married (%)
Marital status - Now married (%)
Marital status - Separated (%)
Marital status - Widowed (%)
Marital status - Divorced (%)
Ancestries Reported - Arab (%)
Ancestries Reported - Czech (%)
Ancestries Reported - Danish (%)
Ancestries Reported - Dutch (%)
Ancestries Reported - English (%)
Ancestries Reported - French (%)
Ancestries Reported - French Canadian (%)
Ancestries Reported - German (%)
Ancestries Reported - Greek (%)
Ancestries Reported - Hungarian (%)
Ancestries Reported - Irish (%)
Ancestries Reported - Italian (%)
Ancestries Reported - Lithuanian (%)
Ancestries Reported - Norwegian (%)
Ancestries Reported - Polish (%)
Ancestries Reported - Portuguese (%)
Ancestries Reported - Russian (%)
Ancestries Reported - Scotch-Irish (%)
Ancestries Reported - Scottish (%)
Ancestries Reported - Slovak (%)
Ancestries Reported - Subsaharan African (%)
Ancestries Reported - Swedish (%)
Ancestries Reported - Swiss (%)
Ancestries Reported - Ukrainian (%)
Ancestries Reported - United States (%)
Ancestries Reported - Welsh (%)
Ancestries Reported - West Indian (%)
Ancestries Reported - Other (%)
Geographical mobility - Same house 1 year ago (%)
Geographical mobility - Same house 1 year ago (%) - White
Geographical mobility - Same house 1 year ago (%) - Black or African American
Geographical mobility - Same house 1 year ago (%) - Asian
Geographical mobility - Same house 1 year ago (%) - Hispanic or Latino
Geographical mobility - Same house 1 year ago (%) - American Indian and Alaska Native
Geographical mobility - Same house 1 year ago (%) - Multirace
Geographical mobility - Same house 1 year ago (%) - Other Race
Geographical mobility - Moved within same county (%)
Geographical mobility - Moved within same county (%) - White
Geographical mobility - Moved within same county (%) - Black or African American
Geographical mobility - Moved within same county (%) - Asian
Geographical mobility - Moved within same county (%) - Hispanic or Latino
Geographical mobility - Moved within same county (%) - American Indian and Alaska Native
Geographical mobility - Moved within same county (%) - Multirace
Geographical mobility - Moved within same county (%) - Other Race
Geographical mobility - Moved from different county within same state (%)
Geographical mobility - Moved from different county within same state (%) - White
Geographical mobility - Moved from different county within same state (%) - Black or African American
Geographical mobility - Moved from different county within same state (%) - Asian
Geographical mobility - Moved from different county within same state (%) - Hispanic or Latino
Geographical mobility - Moved from different county within same state (%) - American Indian and Alaska Native
Geographical mobility - Moved from different county within same state (%) - Multirace
Geographical mobility - Moved from different county within same state (%) - Other Race
Geographical mobility - Moved from different state (%)
Geographical mobility - Moved from different state (%) - White
Geographical mobility - Moved from different state (%) - Black or African American
Geographical mobility - Moved from different state (%) - Asian
Geographical mobility - Moved from different state (%) - Hispanic or Latino
Geographical mobility - Moved from different state (%) - American Indian and Alaska Native
Geographical mobility - Moved from different state (%) - Multirace
Geographical mobility - Moved from different state (%) - Other Race
Geographical mobility - Moved from abroad (%)
Geographical mobility - Moved from abroad (%) - White
Geographical mobility - Moved from abroad (%) - Black or African American
Geographical mobility - Moved from abroad (%) - Asian
Geographical mobility - Moved from abroad (%) - Hispanic or Latino
Geographical mobility - Moved from abroad (%) - American Indian and Alaska Native
Geographical mobility - Moved from abroad (%) - Multirace
Geographical mobility - Moved from abroad (%) - Other Race
Place of birth for the foreign-born population - Ireland (%)
Place of birth for the foreign-born population - Denmark (%)
Place of birth for the foreign-born population - Norway (%)
Place of birth for the foreign-born population - Sweden (%)
Place of birth for the foreign-born population - United Kingdom (%)
Place of birth for the foreign-born population - England (%)
Place of birth for the foreign-born population - Scotland (%)
Place of birth for the foreign-born population - Other Northern Europe (%)
Place of birth for the foreign-born population - Austria (%)
Place of birth for the foreign-born population - Belgium (%)
Place of birth for the foreign-born population - France (%)
Place of birth for the foreign-born population - Germany (%)
Place of birth for the foreign-born population - Netherlands (%)
Place of birth for the foreign-born population - Switzerland (%)
Place of birth for the foreign-born population - Other Western Europe (%)
Place of birth for the foreign-born population - Greece (%)
Place of birth for the foreign-born population - Italy (%)
Place of birth for the foreign-born population - Portugal (%)
Place of birth for the foreign-born population - Spain (%)
Place of birth for the foreign-born population - Other Southern Europe (%)
Place of birth for the foreign-born population - Albania (%)
Place of birth for the foreign-born population - Belarus (%)
Place of birth for the foreign-born population - Bosnia and Herzegovina (%)
Place of birth for the foreign-born population - Bulgaria (%)
Place of birth for the foreign-born population - Croatia (%)
Place of birth for the foreign-born population - Czechoslovakia (%)
Place of birth for the foreign-born population - Hungary (%)
Place of birth for the foreign-born population - Latvia (%)
Place of birth for the foreign-born population - Lithuania (%)
Place of birth for the foreign-born population - North Macedonia (Macedonia) (%)
Place of birth for the foreign-born population - Moldova (%)
Place of birth for the foreign-born population - Poland (%)
Place of birth for the foreign-born population - Romania (%)
Place of birth for the foreign-born population - Russia (%)
Place of birth for the foreign-born population - Serbia (%)
Place of birth for the foreign-born population - Ukraine (%)
Place of birth for the foreign-born population - Other Eastern Europe (%)
Place of birth for the foreign-born population - China (%)
Place of birth for the foreign-born population - Hong Kong (%)
Place of birth for the foreign-born population - Taiwan (%)
Place of birth for the foreign-born population - Japan (%)
Place of birth for the foreign-born population - Korea (%)
Place of birth for the foreign-born population - Other Eastern Asia (%)
Place of birth for the foreign-born population - Afghanistan (%)
Place of birth for the foreign-born population - Bangladesh (%)
Place of birth for the foreign-born population - India (%)
Place of birth for the foreign-born population - Iran (%)
Place of birth for the foreign-born population - Kazakhstan (%)
Place of birth for the foreign-born population - Nepal (%)
Place of birth for the foreign-born population - Pakistan (%)
Place of birth for the foreign-born population - Sri Lanka (%)
Place of birth for the foreign-born population - Uzbekistan (%)
Place of birth for the foreign-born population - Other South Central Asia (%)
Place of birth for the foreign-born population - Burma (%)
Place of birth for the foreign-born population - Cambodia (%)
Place of birth for the foreign-born population - Indonesia (%)
Place of birth for the foreign-born population - Laos (%)
Place of birth for the foreign-born population - Malaysia (%)
Place of birth for the foreign-born population - Philippines (%)
Place of birth for the foreign-born population - Singapore (%)
Place of birth for the foreign-born population - Thailand (%)
Place of birth for the foreign-born population - Vietnam (%)
Place of birth for the foreign-born population - Other South Eastern Asia (%)
Place of birth for the foreign-born population - Armenia (%)
Place of birth for the foreign-born population - Iraq (%)
Place of birth for the foreign-born population - Israel (%)
Place of birth for the foreign-born population - Jordan (%)
Place of birth for the foreign-born population - Kuwait (%)
Place of birth for the foreign-born population - Lebanon (%)
Place of birth for the foreign-born population - Saudi Arabia (%)
Place of birth for the foreign-born population - Syria (%)
Place of birth for the foreign-born population - Turkey (%)
Place of birth for the foreign-born population - Yemen (%)
Place of birth for the foreign-born population - Other Western Asia (%)
Place of birth for the foreign-born population - Eritrea (%)
Place of birth for the foreign-born population - Ethiopia (%)
Place of birth for the foreign-born population - Kenya (%)
Place of birth for the foreign-born population - Somalia (%)
Place of birth for the foreign-born population - Uganda (%)
Place of birth for the foreign-born population - Zimbabwe (%)
Place of birth for the foreign-born population - Other Eastern Africa (%)
Place of birth for the foreign-born population - Cameroon (%)
Place of birth for the foreign-born population - Congo (%)
Place of birth for the foreign-born population - Democratic Republic of Congo (Zaire) (%)
Place of birth for the foreign-born population - Other Middle Africa (%)
Place of birth for the foreign-born population - Egypt (%)
Place of birth for the foreign-born population - Morocco (%)
Place of birth for the foreign-born population - Sudan (%)
Place of birth for the foreign-born population - Other Northern Africa (%)
Place of birth for the foreign-born population - South Africa (%)
Place of birth for the foreign-born population - Other Southern Africa (%)
Place of birth for the foreign-born population - Cabo Verde (%)
Place of birth for the foreign-born population - Ghana (%)
Place of birth for the foreign-born population - Liberia (%)
Place of birth for the foreign-born population - Nigeria (%)
Place of birth for the foreign-born population - Senegal (%)
Place of birth for the foreign-born population - Sierra Leone (%)
Place of birth for the foreign-born population - Other Western Africa (%)
Place of birth for the foreign-born population - Australia (%)
Place of birth for the foreign-born population - New Zealand (%)
Place of birth for the foreign-born population - Fiji (%)
Place of birth for the foreign-born population - Micronesia (%)
Place of birth for the foreign-born population - Bahamas (%)
Place of birth for the foreign-born population - Barbados (%)
Place of birth for the foreign-born population - Cuba (%)
Place of birth for the foreign-born population - Dominica (%)
Place of birth for the foreign-born population - Dominican Republic (%)
Place of birth for the foreign-born population - Grenada (%)
Place of birth for the foreign-born population - Haiti (%)
Place of birth for the foreign-born population - Jamaica (%)
Place of birth for the foreign-born population - St. Vincent and the Grenadines (%)
Place of birth for the foreign-born population - Trinidad and Tobago (%)
Place of birth for the foreign-born population - West Indies (%)
Place of birth for the foreign-born population - Other Caribbean (%)
Place of birth for the foreign-born population - Belize (%)
Place of birth for the foreign-born population - Costa Rica (%)
Place of birth for the foreign-born population - El Salvador (%)
Place of birth for the foreign-born population - Guatemala (%)
Place of birth for the foreign-born population - Honduras (%)
Place of birth for the foreign-born population - Mexico (%)
Place of birth for the foreign-born population - Nicaragua (%)
Place of birth for the foreign-born population - Panama (%)
Place of birth for the foreign-born population - Other Central America (%)
Place of birth for the foreign-born population - Argentina (%)
Place of birth for the foreign-born population - Bolivia (%)
Place of birth for the foreign-born population - Brazil (%)
Place of birth for the foreign-born population - Chile (%)
Place of birth for the foreign-born population - Colombia (%)
Place of birth for the foreign-born population - Ecuador (%)
Place of birth for the foreign-born population - Guyana (%)
Place of birth for the foreign-born population - Peru (%)
Place of birth for the foreign-born population - Uruguay (%)
Place of birth for the foreign-born population - Venezuela (%)
Place of birth for the foreign-born population - Other South America (%)
Place of birth for the foreign-born population - Canada (%)
Place of birth for the foreign-born population - Other Northern America (%)
Place of birth for the foreign-born population - Other (%)
Latest news about races in McLean, VA collected exclusively by city-data.com from local newspapers, TV, and radio stations
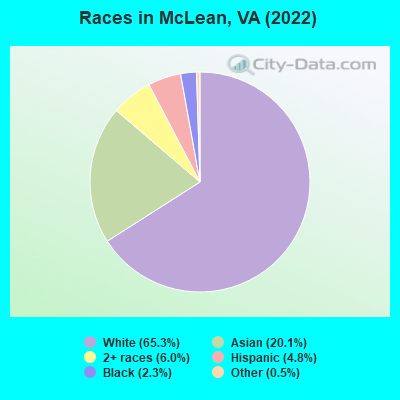
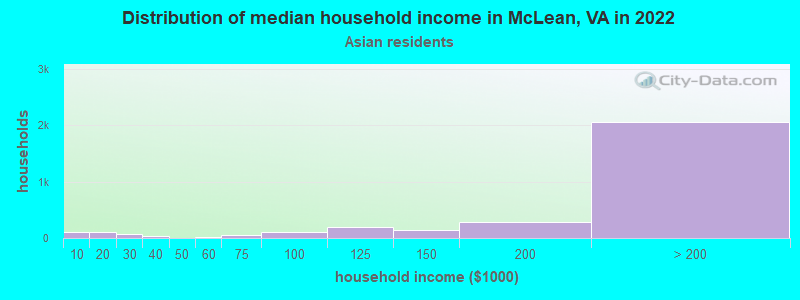
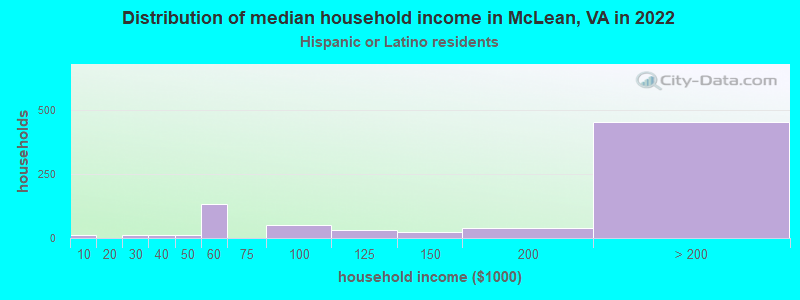
According to 2022 data, the most numerous races in McLean, VA are White alone (32,179 residents), Black alone (1,124 residents), and Hispanic (2,370 residents). 74.3% of McLean residents speak English at home. 23.6% of McLean, VA residents are foreign-born (15.1% born in Asia, 4.5% born in Europe), which is 49.2% greater than the foreign-born rate of 12.0% across the entire state of Virginia.
Race distribution in McLean
2000 2022
4,965,637 70.2% White alone 1,376,378 19.4% Black alone 329,540 4.7% Hispanic 259,277 3.7% Asian alone 114,022 1.6% Two or more races 18,596 0.3% American Indian alone 11,685 0.2% Other race alone 3,380 0.05% Native Hawaiian and Other
5,095,130 58.7% White alone 1,594,785 18.4% Black alone 905,750 10.4% Hispanic 602,881 6.9% Asian alone 406,047 4.7% Two or more races 60,419 0.7% Other race alone 11,738 0.1% American Indian alone 6,869 0.08% Native Hawaiian and Other
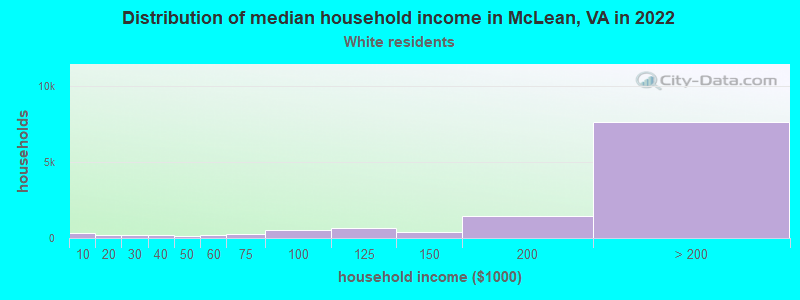
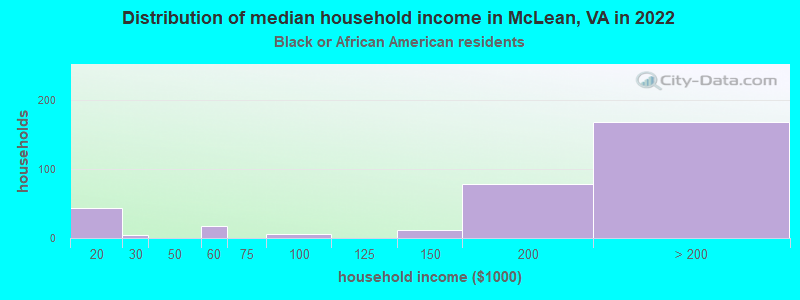
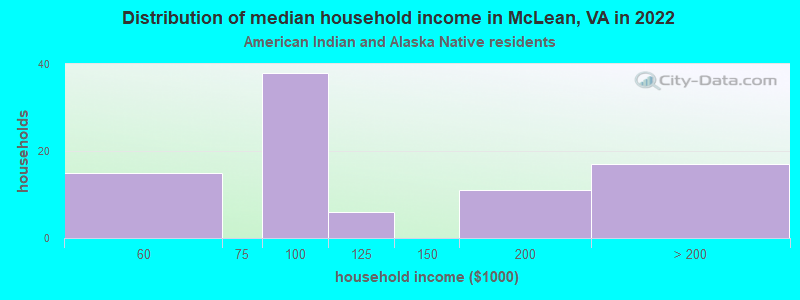
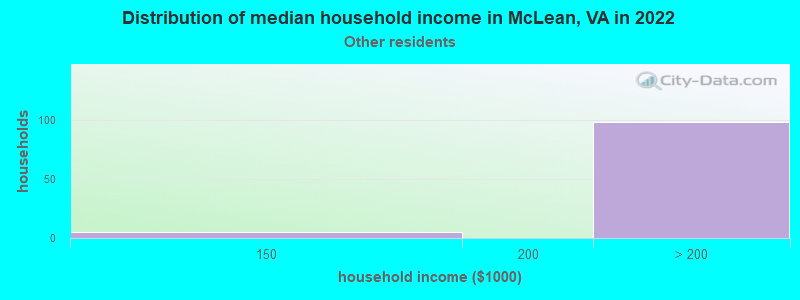
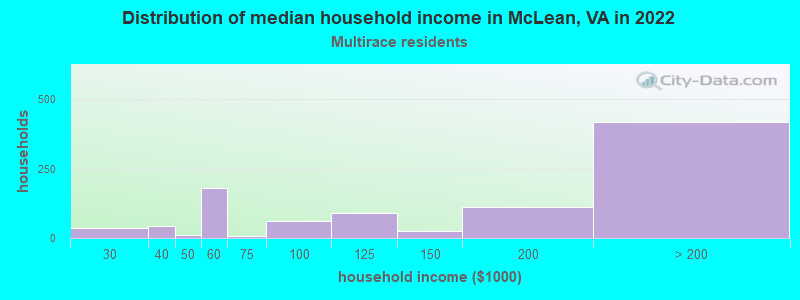
Income and house value in McLean Median household income in 2022 over $200,000 White non-Hispanic householders$192,863 Black householdersover $200,000 Asian householdersover $200,000 Some other race householders$156,306 Two or more races householders$186,358 Hispanic or Latino race householdersMedian 2022 house value over $1,000,000 White Non-Hispanic householdersover $1,000,000 Black or African American householders$579,675 American Indian or Alaska Native householders over $1,000,000 Asian householders$639,348 Native Hawaiian and other Pacific Islander householders$603,885 Some other race householdersover $1,000,000 Two or more races householdersover $1,000,000 Hispanic or Latino householders
Median age by race in McLean
49.8 Median age for White residents49.5 49.9 56.1 Median age for Black or African American residents44.1 59.9 22.3 Median age for American Indian / Alaska Native residents30.5 19.8 47.2 Median age for Asian residents47.1 46.8 -666,666,666.0 Median age for Native Hawaiian / Pacific Islander residents-558,791,801.0 -584,518,166.9 39.2 Median age for Other race residents56.1 36.7 20.5 Median age for Two or more races residents19.4 22.2 49.2 Median age for White alone residents49.0 48.9 46.9 Median age for Hispanic or Latino residents46.4 48.4
Owner/renter occupied households by race in McLean
House owners and renters - White residents 10,725 88.6% Owner occupied1,385 11.4% Renter occupiedHouse owners and renters - Black or African American residents 163 49.3% Owner occupied168 50.7% Renter occupiedHouse owners and renters - American Indian / Alaska Native residents 98 100.0% Owner occupiedHouse owners and renters - Asian residents 2,884 89.1% Owner occupied353 10.9% Renter occupiedHouse owners and renters - Native Hawaiian / Pacific Islander residents 9 100.0% Owner occupiedHouse owners and renters - Other race residents 60 83.1% Owner occupied12 16.9% Renter occupiedHouse owners and renters - Two or more races residents 789 82.4% Owner occupied168 17.6% Renter occupiedHouse owners and renters - White alone residents 10,866 88.1% Owner occupied1,471 11.9% Renter occupiedHouse owners and renters - Hispanic or Latino residents 610 86.9% Owner occupied92 13.1% Renter occupied
Language usage in McLean
English speakers - Total 74.3% of residents of McLean speak English at home.
2.1% of residents speak Spanish at home 821 81.4% Speak English very well187 18.6% Speak English less than very well24.1% of residents speak other language at home 8,961 78.4% Speak English very well2,473 21.6% Speak English less than very well
English speakers - Born in the United States 90.2% of residents of McLean speak English at home.
1.0% of residents speak Spanish at home 259 100.0% Speak English very well8.3% of residents speak other language at home 2,003 97.0% Speak English very well61 3.0% Speak English less than very well
English speakers - Native, born elsewhere 61.8% of residents of McLean speak English at home.
13.3% of residents speak Spanish at home 184 97.9% Speak English very well4 2.1% Speak English less than very well25.2% of residents speak other language at home 302 84.8% Speak English very well54 15.2% Speak English less than very well
English speakers - Foreign-born 28.1% of residents of McLean speak English at home.
4.4% of residents speak Spanish at home 338 65.3% Speak English very well180 34.7% Speak English less than very well69.0% of residents speak other language at home 5,693 70.8% Speak English very well2,350 29.2% Speak English less than very well
White (Caucasian) - Speak only English Native:
95.7% (25,751)Foreign-born:
58.5% (1,744)
White (Caucasian) - Speak another language Native:
4.9% (1,326)Foreign-born:
53.4% (1,593)
Black or African American - Speak only English Native:
92.2% (809)Foreign-born:
21.4% (40)
Black or African American - Speak another language Native:
6.9% (61)Foreign-born:
78.0% (147)
American Indian / Alaska Native - Speak another language Native:
6.0% (16)Foreign-born:
100.0% (62)
Asian - Speak only English Native:
55.8% (1,972)Foreign-born:
14.7% (916)
Asian - Speak another language Native:
43.6% (1,540)Foreign-born:
85.5% (5,337)
Other race - Speak only English Native:
100.0% (398)Foreign-born:
46.8% (134)
Other race - Speak another language Native:
3.5% (14)Foreign-born:
61.7% (177)
Two or more races - Speak only English Native:
79.9% (2,523)Foreign-born:
19.1% (161)
Two or more races - Speak another language Native:
19.7% (621)Foreign-born:
80.7% (684)
White alone - Speak only English Native:
94.3% (25,730)Foreign-born:
45.9% (1,763)
White alone - Speak another language Native:
5.6% (1,541)Foreign-born:
56.7% (2,177)
Hispanic or Latino - Speak only English Native:
80.0% (1,216)Foreign-born:
31.3% (227)
Hispanic or Latino - Speak another language Native:
25.9% (394)Foreign-born:
69.1% (502)
Foreign-born residents in McLean 11,642 residents are foreign born (15.1% Asia , 4.5% Europe ).
This city:
23.6%Virginia:
12.6%
Marital status for residents in McLean Marital status - White (Caucasian) population 15 years and over
Males 25.1% Never married66.1% Now married0.8% Separated2.6% Widowed5.5% DivorcedFemales 21.0% Never married61.9% Now married0.6% Separated9.4% Widowed7.0% DivorcedWomen who gave birth in the past 12 months Now married:
86.4% (96)Unmarried:
13.6% (15)
Women who did not give birth in the past 12 months Now married:
54.6% (2,997)Unmarried:
45.4% (2,490)
Marital status - Black or African American population 15 years and over
Males 52.8% Never married36.0% Now married0.0% Separated1.4% Widowed9.9% DivorcedFemales 32.8% Never married26.3% Now married0.0% Separated19.4% Widowed21.5% DivorcedWomen who gave birth in the past 12 months Now married:
0.0% (0)Unmarried:
100.0% (26)
Women who did not give birth in the past 12 months Now married:
14.3% (25)Unmarried:
85.7% (148)
Marital status - American Indian / Alaska Native population 15 years and over
Males 65.6% Never married34.4% Now married0.0% Separated0.0% Widowed0.0% DivorcedFemales 70.8% Never married23.9% Now married0.0% Separated0.0% Widowed5.3% DivorcedWomen who did not give birth in the past 12 months Now married:
11.4% (20)Unmarried:
88.6% (157)
Marital status - Asian population 15 years and over
Males 27.7% Never married67.4% Now married0.4% Separated1.2% Widowed3.3% DivorcedFemales 16.3% Never married71.1% Now married0.0% Separated7.9% Widowed4.6% DivorcedWomen who gave birth in the past 12 months Now married:
100.0% (46)Unmarried:
0.0% (0)
Women who did not give birth in the past 12 months Now married:
69.3% (1,615)Unmarried:
30.7% (714)
Marital status - Other race population 15 years and over
Males 35.2% Never married64.8% Now married0.0% Separated0.0% Widowed0.0% DivorcedFemales 27.8% Never married59.8% Now married0.0% Separated10.0% Widowed2.5% DivorcedWomen who gave birth in the past 12 months Now married:
100.0% (7)Unmarried:
0.0% (0)
Women who did not give birth in the past 12 months Now married:
52.5% (116)Unmarried:
47.5% (104)
Marital status - Two or more races population 15 years and over
Males 47.9% Never married48.9% Now married0.0% Separated0.0% Widowed3.2% DivorcedFemales 34.3% Never married48.7% Now married0.0% Separated14.3% Widowed2.8% DivorcedWomen who gave birth in the past 12 months Now married:
100.0% (12)Unmarried:
0.0% (0)
Women who did not give birth in the past 12 months Now married:
42.3% (346)Unmarried:
57.7% (473)
Marital status - White alone, not Hispanic / Latino population 15 years and over
Males 25.4% Never married66.1% Now married0.8% Separated2.6% Widowed5.1% DivorcedFemales 20.9% Never married61.8% Now married0.6% Separated9.5% Widowed7.2% DivorcedWomen who gave birth in the past 12 months Now married:
87.1% (105)Unmarried:
12.9% (16)
Women who did not give birth in the past 12 months Now married:
54.5% (3,189)Unmarried:
45.5% (2,659)
Marital status - Hispanic or Latino population 15 years and over
Males 29.0% Never married63.2% Now married0.0% Separated0.0% Widowed7.9% DivorcedFemales 29.0% Never married50.1% Now married0.0% Separated19.2% Widowed1.6% DivorcedWomen who gave birth in the past 12 months Now married:
0.0% (0)Unmarried:
99.5% (1)
Women who did not give birth in the past 12 months Now married:
38.2% (179)Unmarried:
61.8% (289)
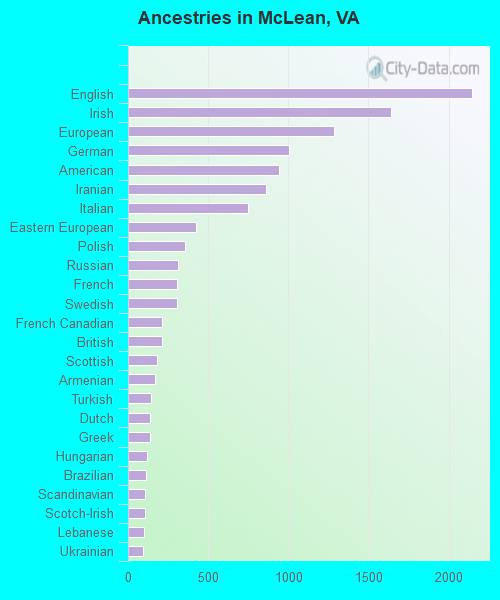
Ancestries in McLean
2,145 8.5% English1,642 6.5% Irish1,285 5.1% European1,005 4.0% German940 3.7% American862 3.4% Iranian748 3.0% Italian427 1.7% Eastern European354 1.4% Polish315 1.3% Russian308 1.2% French304 1.2% Swedish211 0.8% French Canadian210 0.8% British183 0.7% Scottish168 0.7% Armenian143 0.6% Turkish140 0.6% Dutch136 0.5% Greek119 0.5% Hungarian111 0.4% Brazilian108 0.4% Scandinavian104 0.4% Scotch-Irish98 0.4% Lebanese94 0.4% Ukrainian80 0.3% Syrian77 0.3% Ethiopian75 0.3% Danish73 0.3% Palestinian73 0.3% Northern European67 0.3% Serbian62 0.2% African50 0.2% Iraqi50 0.2% Romanian46 0.2% Arab45 0.2% Egyptian45 0.2% Belgian40 0.2% Kenyan37 0.1% Austrian34 0.1% Australian34 0.1% Welsh32 0.1% Slovak32 0.1% Czech29 0.1% Czechoslovakian24 0.10% Canadian24 0.10% Norwegian21 0.08% Portuguese19 0.08% Estonian17 0.07% Lithuanian14 0.06% Carpatho Rusyn14 0.06% Moroccan13 0.05% Jordanian12 0.05% Guyanese11 0.04% Croatian9 0.04% Pennsylvania German6 0.02% Latvian5 0.02% Swiss5 0.02% Israeli2 0.01% Haitian
Geographical mobility in McLean Same house 1 year ago 27,798 90.8% White (Caucasian)1,019 92.0% Black or African American292 76.4% American Indian / Alaska Native8,393 83.5% Asian11 95.3% Native Hawaiian / Pacific Islander622 89.6% Other race3,501 79.4% Two or more races29,136 90.9% White alone, not Hispanic / Latino1,941 82.4% Hispanic or LatinoMoved within same county 876 2.9% White / Caucasian25 2.3% Black or African American730 7.3% Asian18 2.5% Other race260 5.9% Two or more races906 2.8% White alone, not Hispanic / Latino123 5.2% Hispanic or LatinoMoved within same state 445 1.5% White / Caucasian5 0.5% Black or African American74 19.4% American Indian / Alaska Native214 2.1% Asian9 1.4% Other race343 7.8% Two or more races422 1.3% White alone, not Hispanic / Latino135 5.7% Hispanic or LatinoMoved from different state 878 2.9% White / Caucasian404 4.0% Asian58 8.4% Other race96 2.2% Two or more races905 2.8% White alone, not Hispanic / Latino87 3.7% Hispanic or LatinoMoved from abroad 527 1.7% White48 4.3% Black or African American331 3.3% Asian230 5.2% Two or more races573 1.8% White alone, not Hispanic / Latino73 3.1% Hispanic or Latino
Children Nativity (place of birth) in McLean
Children under 6 years - Living with two parents Both parents native 1,266 100.0% NativeBoth parents foreign-born 418 95.9% Native18 4.1% Foreign-bornOne native, one foreign-born parent 502 100.0% NativeChildren under 6 years - Living with one parent Native parent 163 100.0% NativeForeign-born parent 27 100.0% NativeChildren 6 to 17 years - Living with two parents Both parents native 4,827 98.4% Native78 1.6% Foreign-bornBoth parents foreign-born 1,390 70.5% Native581 29.5% Foreign-bornOne native, one foreign-born parent 1,644 97.8% Native36 2.2% Foreign-bornChildren 6 to 17 years - Living with one parent Native parent 919 100.0% NativeForeign-born parent 346 54.2% Native292 45.8% Foreign-born
Place of birth for residents in McLean
Grandparents responsible for own grandchildren in McLean
Grandparents (30 to 59 years) White / Caucasian 15 100.0% Not responsible for grandchildrenWhite alone, not Hispanic / Latino 36 100.0% Not responsible for grandchildrenGrandparents (60 years and over) White / Caucasian 74 22.4% Responsible for grandchildren256 77.6% Not responsible for grandchildrenWhite alone, not Hispanic / Latino 81 22.0% Responsible for grandchildren285 78.0% Not responsible for grandchildren