Races in McHenry, Illinois (IL) Detailed Stats
Data:
Races - White alone (%)
Races - White alone (% change since 2000)
Races - Black alone (%)
Races - Black alone (% change since 2000)
Races - American Indian alone (%)
Races - American Indian alone (% change since 2000)
Races - Asian alone (%)
Races - Asian alone (% change since 2000)
Races - Hispanic (%)
Races - Hispanic (% change since 2000)
Races - Native Hawaiian and Other Pacific Islander alone (%)
Races - Native Hawaiian and Other Pacific Islander alone (% change since 2000)
Races - Two or more races(%)
Races - Two or more races(% change since 2000)
Races - Other race alone (%)
Races - Other race alone (% change since 2000)
Racial diversity
Place of birth - Born in state of residence (%)
Place of birth - Born in state of residence (%) - White
Place of birth - Born in state of residence (%) - Black or African American
Place of birth - Born in state of residence (%) - Asian
Place of birth - Born in state of residence (%) - Hispanic or Latino
Place of birth - Born in state of residence (%) - American Indian and Alaska Native
Place of birth - Born in state of residence (%) - Multirace
Place of birth - Born in state of residence (%) - Other Race
Place of birth - Born in other state (%)
Place of birth - Born in other state (%) - White
Place of birth - Born in other state (%) - Black or African American
Place of birth - Born in other state (%) - Asian
Place of birth - Born in other state (%) - Hispanic or Latino
Place of birth - Born in other state (%) - American Indian and Alaska Native
Place of birth - Born in other state (%) - Multirace
Place of birth - Born in other state (%) - Other Race
Place of birth - Native, outside of US (%)
Place of birth - Native, outside of US (%) - White
Place of birth - Native, outside of US (%) - Black or African American
Place of birth - Native, outside of US (%) - Asian
Place of birth - Native, outside of US (%) - Hispanic or Latino
Place of birth - Native, outside of US (%) - American Indian and Alaska Native
Place of birth - Native, outside of US (%) - Multirace
Place of birth - Native, outside of US (%) - Other Race
Place of birth - Foreign born (%)
Place of birth - Foreign born (%) - White
Place of birth - Foreign born (%) - Black or African American
Place of birth - Foreign born (%) - Asian
Place of birth - Foreign born (%) - Hispanic or Latino
Place of birth - Foreign born (%) - American Indian and Alaska Native
Place of birth - Foreign born (%) - Multirace
Place of birth - Foreign born (%) - Other Race
Residents speaking English at home (%)
Residents speaking English at home - Born in the United States (%)
Residents speaking English at home - Native, born elsewhere (%)
Residents speaking English at home - Foreign born (%)
Residents speaking Spanish at home (%)
Residents speaking Spanish at home - Born in the United States (%)
Residents speaking Spanish at home - Native, born elsewhere (%)
Residents speaking Spanish at home - Foreign born (%)
Residents speaking other language at home (%)
Residents speaking other language at home - Born in the United States (%)
Residents speaking other language at home - Native, born elsewhere (%)
Residents speaking other language at home - Foreign born (%)
Marital status - Never married (%)
Marital status - Now married (%)
Marital status - Separated (%)
Marital status - Widowed (%)
Marital status - Divorced (%)
Ancestries Reported - Arab (%)
Ancestries Reported - Czech (%)
Ancestries Reported - Danish (%)
Ancestries Reported - Dutch (%)
Ancestries Reported - English (%)
Ancestries Reported - French (%)
Ancestries Reported - French Canadian (%)
Ancestries Reported - German (%)
Ancestries Reported - Greek (%)
Ancestries Reported - Hungarian (%)
Ancestries Reported - Irish (%)
Ancestries Reported - Italian (%)
Ancestries Reported - Lithuanian (%)
Ancestries Reported - Norwegian (%)
Ancestries Reported - Polish (%)
Ancestries Reported - Portuguese (%)
Ancestries Reported - Russian (%)
Ancestries Reported - Scotch-Irish (%)
Ancestries Reported - Scottish (%)
Ancestries Reported - Slovak (%)
Ancestries Reported - Subsaharan African (%)
Ancestries Reported - Swedish (%)
Ancestries Reported - Swiss (%)
Ancestries Reported - Ukrainian (%)
Ancestries Reported - United States (%)
Ancestries Reported - Welsh (%)
Ancestries Reported - West Indian (%)
Ancestries Reported - Other (%)
Geographical mobility - Same house 1 year ago (%)
Geographical mobility - Same house 1 year ago (%) - White
Geographical mobility - Same house 1 year ago (%) - Black or African American
Geographical mobility - Same house 1 year ago (%) - Asian
Geographical mobility - Same house 1 year ago (%) - Hispanic or Latino
Geographical mobility - Same house 1 year ago (%) - American Indian and Alaska Native
Geographical mobility - Same house 1 year ago (%) - Multirace
Geographical mobility - Same house 1 year ago (%) - Other Race
Geographical mobility - Moved within same county (%)
Geographical mobility - Moved within same county (%) - White
Geographical mobility - Moved within same county (%) - Black or African American
Geographical mobility - Moved within same county (%) - Asian
Geographical mobility - Moved within same county (%) - Hispanic or Latino
Geographical mobility - Moved within same county (%) - American Indian and Alaska Native
Geographical mobility - Moved within same county (%) - Multirace
Geographical mobility - Moved within same county (%) - Other Race
Geographical mobility - Moved from different county within same state (%)
Geographical mobility - Moved from different county within same state (%) - White
Geographical mobility - Moved from different county within same state (%) - Black or African American
Geographical mobility - Moved from different county within same state (%) - Asian
Geographical mobility - Moved from different county within same state (%) - Hispanic or Latino
Geographical mobility - Moved from different county within same state (%) - American Indian and Alaska Native
Geographical mobility - Moved from different county within same state (%) - Multirace
Geographical mobility - Moved from different county within same state (%) - Other Race
Geographical mobility - Moved from different state (%)
Geographical mobility - Moved from different state (%) - White
Geographical mobility - Moved from different state (%) - Black or African American
Geographical mobility - Moved from different state (%) - Asian
Geographical mobility - Moved from different state (%) - Hispanic or Latino
Geographical mobility - Moved from different state (%) - American Indian and Alaska Native
Geographical mobility - Moved from different state (%) - Multirace
Geographical mobility - Moved from different state (%) - Other Race
Geographical mobility - Moved from abroad (%)
Geographical mobility - Moved from abroad (%) - White
Geographical mobility - Moved from abroad (%) - Black or African American
Geographical mobility - Moved from abroad (%) - Asian
Geographical mobility - Moved from abroad (%) - Hispanic or Latino
Geographical mobility - Moved from abroad (%) - American Indian and Alaska Native
Geographical mobility - Moved from abroad (%) - Multirace
Geographical mobility - Moved from abroad (%) - Other Race
Place of birth for the foreign-born population - Ireland (%)
Place of birth for the foreign-born population - Denmark (%)
Place of birth for the foreign-born population - Norway (%)
Place of birth for the foreign-born population - Sweden (%)
Place of birth for the foreign-born population - United Kingdom (%)
Place of birth for the foreign-born population - England (%)
Place of birth for the foreign-born population - Scotland (%)
Place of birth for the foreign-born population - Other Northern Europe (%)
Place of birth for the foreign-born population - Austria (%)
Place of birth for the foreign-born population - Belgium (%)
Place of birth for the foreign-born population - France (%)
Place of birth for the foreign-born population - Germany (%)
Place of birth for the foreign-born population - Netherlands (%)
Place of birth for the foreign-born population - Switzerland (%)
Place of birth for the foreign-born population - Other Western Europe (%)
Place of birth for the foreign-born population - Greece (%)
Place of birth for the foreign-born population - Italy (%)
Place of birth for the foreign-born population - Portugal (%)
Place of birth for the foreign-born population - Spain (%)
Place of birth for the foreign-born population - Other Southern Europe (%)
Place of birth for the foreign-born population - Albania (%)
Place of birth for the foreign-born population - Belarus (%)
Place of birth for the foreign-born population - Bosnia and Herzegovina (%)
Place of birth for the foreign-born population - Bulgaria (%)
Place of birth for the foreign-born population - Croatia (%)
Place of birth for the foreign-born population - Czechoslovakia (%)
Place of birth for the foreign-born population - Hungary (%)
Place of birth for the foreign-born population - Latvia (%)
Place of birth for the foreign-born population - Lithuania (%)
Place of birth for the foreign-born population - North Macedonia (Macedonia) (%)
Place of birth for the foreign-born population - Moldova (%)
Place of birth for the foreign-born population - Poland (%)
Place of birth for the foreign-born population - Romania (%)
Place of birth for the foreign-born population - Russia (%)
Place of birth for the foreign-born population - Serbia (%)
Place of birth for the foreign-born population - Ukraine (%)
Place of birth for the foreign-born population - Other Eastern Europe (%)
Place of birth for the foreign-born population - China (%)
Place of birth for the foreign-born population - Hong Kong (%)
Place of birth for the foreign-born population - Taiwan (%)
Place of birth for the foreign-born population - Japan (%)
Place of birth for the foreign-born population - Korea (%)
Place of birth for the foreign-born population - Other Eastern Asia (%)
Place of birth for the foreign-born population - Afghanistan (%)
Place of birth for the foreign-born population - Bangladesh (%)
Place of birth for the foreign-born population - India (%)
Place of birth for the foreign-born population - Iran (%)
Place of birth for the foreign-born population - Kazakhstan (%)
Place of birth for the foreign-born population - Nepal (%)
Place of birth for the foreign-born population - Pakistan (%)
Place of birth for the foreign-born population - Sri Lanka (%)
Place of birth for the foreign-born population - Uzbekistan (%)
Place of birth for the foreign-born population - Other South Central Asia (%)
Place of birth for the foreign-born population - Burma (%)
Place of birth for the foreign-born population - Cambodia (%)
Place of birth for the foreign-born population - Indonesia (%)
Place of birth for the foreign-born population - Laos (%)
Place of birth for the foreign-born population - Malaysia (%)
Place of birth for the foreign-born population - Philippines (%)
Place of birth for the foreign-born population - Singapore (%)
Place of birth for the foreign-born population - Thailand (%)
Place of birth for the foreign-born population - Vietnam (%)
Place of birth for the foreign-born population - Other South Eastern Asia (%)
Place of birth for the foreign-born population - Armenia (%)
Place of birth for the foreign-born population - Iraq (%)
Place of birth for the foreign-born population - Israel (%)
Place of birth for the foreign-born population - Jordan (%)
Place of birth for the foreign-born population - Kuwait (%)
Place of birth for the foreign-born population - Lebanon (%)
Place of birth for the foreign-born population - Saudi Arabia (%)
Place of birth for the foreign-born population - Syria (%)
Place of birth for the foreign-born population - Turkey (%)
Place of birth for the foreign-born population - Yemen (%)
Place of birth for the foreign-born population - Other Western Asia (%)
Place of birth for the foreign-born population - Eritrea (%)
Place of birth for the foreign-born population - Ethiopia (%)
Place of birth for the foreign-born population - Kenya (%)
Place of birth for the foreign-born population - Somalia (%)
Place of birth for the foreign-born population - Uganda (%)
Place of birth for the foreign-born population - Zimbabwe (%)
Place of birth for the foreign-born population - Other Eastern Africa (%)
Place of birth for the foreign-born population - Cameroon (%)
Place of birth for the foreign-born population - Congo (%)
Place of birth for the foreign-born population - Democratic Republic of Congo (Zaire) (%)
Place of birth for the foreign-born population - Other Middle Africa (%)
Place of birth for the foreign-born population - Egypt (%)
Place of birth for the foreign-born population - Morocco (%)
Place of birth for the foreign-born population - Sudan (%)
Place of birth for the foreign-born population - Other Northern Africa (%)
Place of birth for the foreign-born population - South Africa (%)
Place of birth for the foreign-born population - Other Southern Africa (%)
Place of birth for the foreign-born population - Cabo Verde (%)
Place of birth for the foreign-born population - Ghana (%)
Place of birth for the foreign-born population - Liberia (%)
Place of birth for the foreign-born population - Nigeria (%)
Place of birth for the foreign-born population - Senegal (%)
Place of birth for the foreign-born population - Sierra Leone (%)
Place of birth for the foreign-born population - Other Western Africa (%)
Place of birth for the foreign-born population - Australia (%)
Place of birth for the foreign-born population - New Zealand (%)
Place of birth for the foreign-born population - Fiji (%)
Place of birth for the foreign-born population - Micronesia (%)
Place of birth for the foreign-born population - Bahamas (%)
Place of birth for the foreign-born population - Barbados (%)
Place of birth for the foreign-born population - Cuba (%)
Place of birth for the foreign-born population - Dominica (%)
Place of birth for the foreign-born population - Dominican Republic (%)
Place of birth for the foreign-born population - Grenada (%)
Place of birth for the foreign-born population - Haiti (%)
Place of birth for the foreign-born population - Jamaica (%)
Place of birth for the foreign-born population - St. Vincent and the Grenadines (%)
Place of birth for the foreign-born population - Trinidad and Tobago (%)
Place of birth for the foreign-born population - West Indies (%)
Place of birth for the foreign-born population - Other Caribbean (%)
Place of birth for the foreign-born population - Belize (%)
Place of birth for the foreign-born population - Costa Rica (%)
Place of birth for the foreign-born population - El Salvador (%)
Place of birth for the foreign-born population - Guatemala (%)
Place of birth for the foreign-born population - Honduras (%)
Place of birth for the foreign-born population - Mexico (%)
Place of birth for the foreign-born population - Nicaragua (%)
Place of birth for the foreign-born population - Panama (%)
Place of birth for the foreign-born population - Other Central America (%)
Place of birth for the foreign-born population - Argentina (%)
Place of birth for the foreign-born population - Bolivia (%)
Place of birth for the foreign-born population - Brazil (%)
Place of birth for the foreign-born population - Chile (%)
Place of birth for the foreign-born population - Colombia (%)
Place of birth for the foreign-born population - Ecuador (%)
Place of birth for the foreign-born population - Guyana (%)
Place of birth for the foreign-born population - Peru (%)
Place of birth for the foreign-born population - Uruguay (%)
Place of birth for the foreign-born population - Venezuela (%)
Place of birth for the foreign-born population - Other South America (%)
Place of birth for the foreign-born population - Canada (%)
Place of birth for the foreign-born population - Other Northern America (%)
Place of birth for the foreign-born population - Other (%)
Latest news about races in McHenry, IL collected exclusively by city-data.com from local newspapers, TV, and radio stations
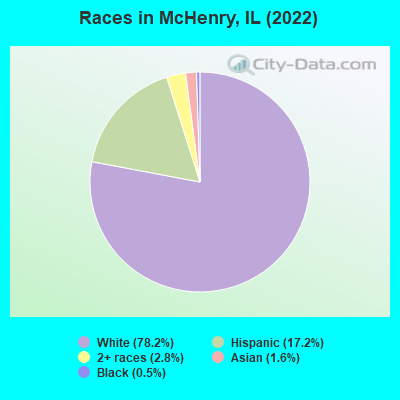
According to 2022 data, the most numerous races in McHenry, IL are White alone (21,548 residents), Hispanic (4,746 residents), and Black alone (142 residents). 82.7% of McHenry residents speak English at home. 8.1% of McHenry, IL residents are foreign-born (5.3% born in Latin America, 1.6% born in Europe, 1.0% born in Asia), which is 72.0% less than the foreign-born rate of 14.0% across the entire state of Illinois.
Race distribution in McHenry
2000 2022
8,424,140 67.8% White alone 1,856,152 14.9% Black alone 1,530,262 12.3% Hispanic 419,916 3.4% Asian alone 153,996 1.2% Two or more races 13,479 0.1% Other race alone 18,232 0.1% American Indian alone 3,116 0.03% Native Hawaiian and Other
7,356,301 58.5% White alone 2,299,726 18.3% Hispanic 1,660,423 13.2% Black alone 747,296 5.9% Asian alone 458,599 3.6% Two or more races 45,386 0.4% Other race alone 10,405 0.08% American Indian alone 3,896 0.03% Native Hawaiian and Other
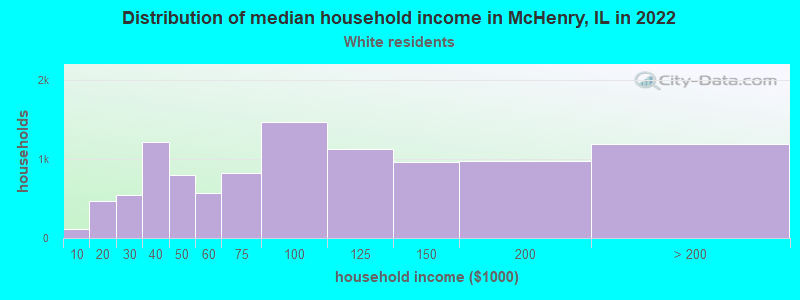
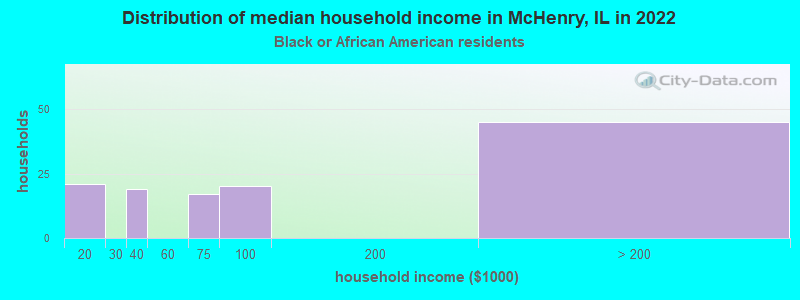
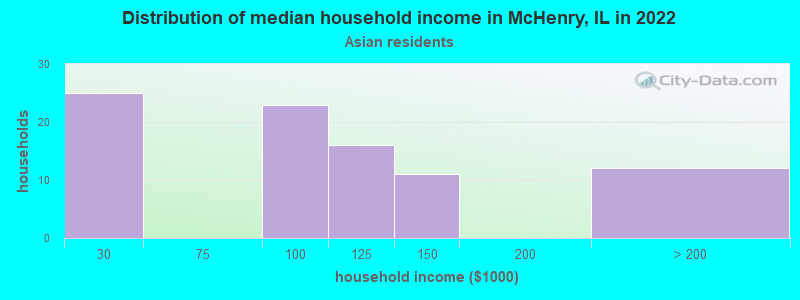
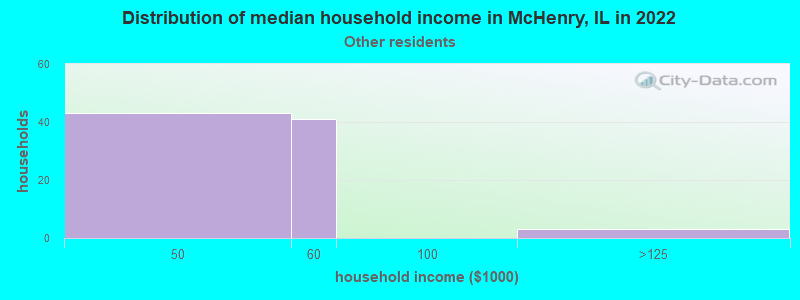
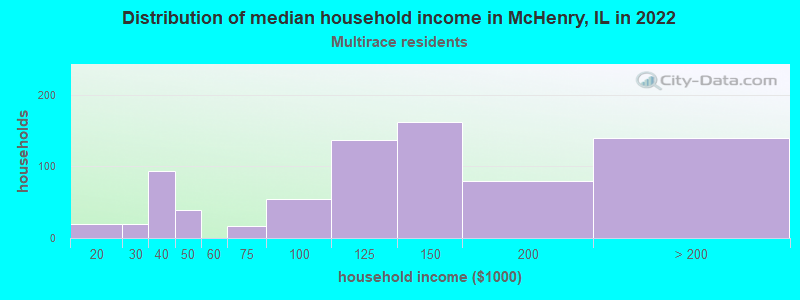
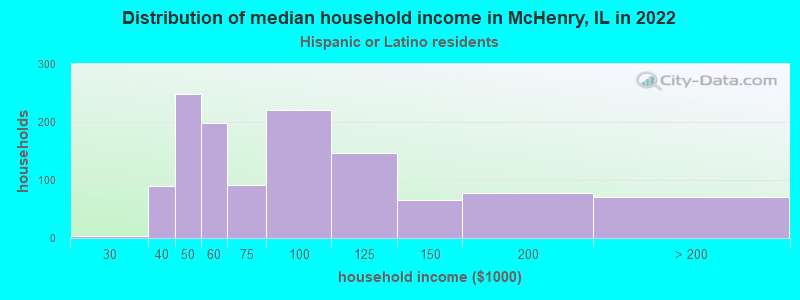
Income and house value in McHenry Median household income in 2022 $83,278 White non-Hispanic householders$102,131 Asian householders$38,823 Some other race householders$125,743 Two or more races householders$68,959 Hispanic or Latino race householdersMedian 2022 house value $250,787 White Non-Hispanic householders $311,397 Asian householders$232,421 Some other race householders$187,840 Two or more races householders$236,762 Hispanic or Latino householders
Median age by race in McHenry
46.0 Median age for White residents45.7 46.6 37.2 Median age for Black or African American residents32.9 40.8 -830,357,142.0 Median age for American Indian / Alaska Native residents-826,666,665.8 -863,095,237.2 50.2 Median age for Asian residents54.6 48.8 -666,666,666.0 Median age for Native Hawaiian / Pacific Islander residents-666,666,666.0 -666,666,666.0 36.0 Median age for Other race residents37.3 23.2 30.9 Median age for Two or more races residents21.9 42.2 47.5 Median age for White alone residents44.5 49.5 33.9 Median age for Hispanic or Latino residents34.0 33.7
Owner/renter occupied households by race in McHenry
House owners and renters - White residents 7,965 79.1% Owner occupied2,108 20.9% Renter occupiedHouse owners and renters - Black or African American residents 122 100.0% Renter occupiedHouse owners and renters - Asian residents 87 79.9% Owner occupied22 20.1% Renter occupiedHouse owners and renters - Other race residents 3 2.3% Owner occupied108 97.7% Renter occupiedHouse owners and renters - Two or more races residents 689 82.1% Owner occupied151 17.9% Renter occupiedHouse owners and renters - White alone residents 7,732 79.4% Owner occupied2,010 20.6% Renter occupiedHouse owners and renters - Hispanic or Latino residents 833 73.7% Owner occupied298 26.3% Renter occupied
Language usage in McHenry
English speakers - Total 82.7% of residents of McHenry speak English at home.
12.7% of residents speak Spanish at home 2,328 70.1% Speak English very well992 29.9% Speak English less than very well4.6% of residents speak other language at home 886 73.2% Speak English very well325 26.8% Speak English less than very well
English speakers - Born in the United States 92.8% of residents of McHenry speak English at home.
7.0% of residents speak Spanish at home 192 67.4% Speak English very well93 32.6% Speak English less than very well0.7% of residents speak other language at home 30 100.0% Speak English very well
English speakers - Native, born elsewhere 32.9% of residents of McHenry speak English at home.
84.0% of residents speak Spanish at home 277 73.3% Speak English very well101 26.7% Speak English less than very well
English speakers - Foreign-born 13.4% of residents of McHenry speak English at home.
61.6% of residents speak Spanish at home 706 47.4% Speak English very well782 52.6% Speak English less than very well24.8% of residents speak other language at home 289 48.2% Speak English very well310 51.8% Speak English less than very well
White (Caucasian) - Speak only English Native:
94.7% (19,551)Foreign-born:
17.5% (180)
White (Caucasian) - Speak another language Native:
4.9% (1,021)Foreign-born:
82.8% (850)
Black or African American - Speak only English Native:
89.0% (139)Foreign-born:
100.0% (14)
Asian - Speak only English Native:
44.2% (55)Foreign-born:
21.0% (68)
Asian - Speak another language Native:
56.5% (71)Foreign-born:
79.0% (258)
Other race - Speak only English Native:
36.4% (150)Foreign-born:
11.3% (44)
Other race - Speak another language Native:
64.3% (264)Foreign-born:
79.6% (310)
Two or more races - Speak only English Native:
60.6% (1,439)Foreign-born:
3.3% (21)
Two or more races - Speak another language Native:
39.1% (930)Foreign-born:
99.7% (634)
White alone - Speak only English Native:
96.7% (19,340)Foreign-born:
30.0% (160)
White alone - Speak another language Native:
3.4% (682)Foreign-born:
66.7% (356)
Hispanic or Latino - Speak only English Native:
41.9% (1,181)Foreign-born:
5.7% (92)
Hispanic or Latino - Speak another language Native:
59.2% (1,668)Foreign-born:
94.2% (1,500)
Foreign-born residents in McHenry 2,242 residents are foreign born (5.3% Latin America , 1.6% Europe , 1.0% Asia ).
This city:
8.1%Illinois:
14.1%
Marital status for residents in McHenry Marital status - White (Caucasian) population 15 years and over
Males 27.5% Never married57.9% Now married0.2% Separated3.0% Widowed11.5% DivorcedFemales 22.4% Never married51.7% Now married0.5% Separated11.0% Widowed14.3% DivorcedWomen who gave birth in the past 12 months Now married:
55.2% (174)Unmarried:
44.8% (141)
Women who did not give birth in the past 12 months Now married:
47.2% (2,014)Unmarried:
52.8% (2,252)
Marital status - Black or African American population 15 years and over
Males 65.8% Never married16.2% Now married0.0% Separated0.0% Widowed17.9% DivorcedFemales 41.7% Never married25.0% Now married30.0% Separated0.0% Widowed3.3% DivorcedWomen who did not give birth in the past 12 months Now married:
57.9% (31)Unmarried:
42.1% (23)
Marital status - Asian population 15 years and over
Males 28.6% Never married71.4% Now married0.0% Separated0.0% Widowed0.0% DivorcedFemales 26.5% Never married50.4% Now married0.0% Separated7.2% Widowed15.9% DivorcedWomen who did not give birth in the past 12 months Now married:
55.1% (87)Unmarried:
44.9% (71)
Marital status - Other race population 15 years and over
Males 31.3% Never married59.8% Now married0.0% Separated0.0% Widowed9.0% DivorcedFemales 29.9% Never married64.7% Now married0.0% Separated5.3% Widowed0.0% DivorcedWomen who did not give birth in the past 12 months Now married:
66.5% (124)Unmarried:
33.5% (63)
Marital status - Two or more races population 15 years and over
Males 51.1% Never married38.4% Now married0.0% Separated1.4% Widowed9.1% DivorcedFemales 29.8% Never married56.0% Now married0.0% Separated0.0% Widowed14.2% DivorcedWomen who gave birth in the past 12 months Now married:
100.0% (51)Unmarried:
0.0% (0)
Women who did not give birth in the past 12 months Now married:
46.6% (341)Unmarried:
53.4% (391)
Marital status - White alone, not Hispanic / Latino population 15 years and over
Males 28.0% Never married56.9% Now married0.2% Separated3.3% Widowed11.7% DivorcedFemales 19.7% Never married52.1% Now married0.3% Separated12.4% Widowed15.4% DivorcedWomen who gave birth in the past 12 months Now married:
50.5% (154)Unmarried:
49.5% (151)
Women who did not give birth in the past 12 months Now married:
49.4% (1,821)Unmarried:
50.6% (1,864)
Marital status - Hispanic or Latino population 15 years and over
Males 32.6% Never married60.2% Now married0.0% Separated0.0% Widowed7.2% DivorcedFemales 37.4% Never married54.2% Now married1.3% Separated0.5% Widowed6.5% DivorcedWomen who gave birth in the past 12 months Now married:
100.0% (69)Unmarried:
0.0% (0)
Women who did not give birth in the past 12 months Now married:
44.4% (664)Unmarried:
55.6% (832)
Ancestries in McHenry
1,576 15.3% German870 8.5% Polish821 8.0% Irish816 7.9% American804 7.8% English549 5.3% Italian262 2.5% European181 1.8% Norwegian121 1.2% Swedish106 1.0% Eastern European77 0.7% Lithuanian66 0.6% Czech64 0.6% Czechoslovakian54 0.5% Dutch51 0.5% Russian45 0.4% Scottish34 0.3% Croatian33 0.3% Swiss30 0.3% Greek29 0.3% Scotch-Irish28 0.3% Belgian28 0.3% Canadian27 0.3% British23 0.2% French21 0.2% Haitian19 0.2% Ukrainian18 0.2% Finnish18 0.2% Slavic11 0.1% Latvian11 0.1% Scandinavian9 0.09% Bulgarian7 0.07% Danish
Children Nativity (place of birth) in McHenry
Children under 6 years - Living with two parents Both parents native 972 100.0% NativeBoth parents foreign-born 157 100.0% NativeOne native, one foreign-born parent 79 100.0% NativeChildren under 6 years - Living with one parent Native parent 312 100.0% NativeChildren 6 to 17 years - Living with two parents Both parents native 1,466 94.9% Native80 5.1% Foreign-bornBoth parents foreign-born 538 100.0% NativeOne native, one foreign-born parent 657 100.0% NativeChildren 6 to 17 years - Living with one parent Native parent 903 98.7% Native11 1.3% Foreign-born
Grandparents responsible for own grandchildren in McHenry
Grandparents (30 to 59 years) White / Caucasian 14 11.5% Responsible for grandchildren111 88.5% Not responsible for grandchildrenWhite alone, not Hispanic / Latino 14 9.4% Responsible for grandchildren134 90.6% Not responsible for grandchildrenGrandparents (60 years and over) White / Caucasian 24 24.0% Responsible for grandchildren77 76.0% Not responsible for grandchildrenWhite alone, not Hispanic / Latino 28 25.3% Responsible for grandchildren83 74.7% Not responsible for grandchildren