Races in McDonough, Georgia (GA) Detailed Stats
Data:
Races - White alone (%)
Races - White alone (% change since 2000)
Races - Black alone (%)
Races - Black alone (% change since 2000)
Races - American Indian alone (%)
Races - American Indian alone (% change since 2000)
Races - Asian alone (%)
Races - Asian alone (% change since 2000)
Races - Hispanic (%)
Races - Hispanic (% change since 2000)
Races - Native Hawaiian and Other Pacific Islander alone (%)
Races - Native Hawaiian and Other Pacific Islander alone (% change since 2000)
Races - Two or more races(%)
Races - Two or more races(% change since 2000)
Races - Other race alone (%)
Races - Other race alone (% change since 2000)
Racial diversity
Place of birth - Born in state of residence (%)
Place of birth - Born in state of residence (%) - White
Place of birth - Born in state of residence (%) - Black or African American
Place of birth - Born in state of residence (%) - Asian
Place of birth - Born in state of residence (%) - Hispanic or Latino
Place of birth - Born in state of residence (%) - American Indian and Alaska Native
Place of birth - Born in state of residence (%) - Multirace
Place of birth - Born in state of residence (%) - Other Race
Place of birth - Born in other state (%)
Place of birth - Born in other state (%) - White
Place of birth - Born in other state (%) - Black or African American
Place of birth - Born in other state (%) - Asian
Place of birth - Born in other state (%) - Hispanic or Latino
Place of birth - Born in other state (%) - American Indian and Alaska Native
Place of birth - Born in other state (%) - Multirace
Place of birth - Born in other state (%) - Other Race
Place of birth - Native, outside of US (%)
Place of birth - Native, outside of US (%) - White
Place of birth - Native, outside of US (%) - Black or African American
Place of birth - Native, outside of US (%) - Asian
Place of birth - Native, outside of US (%) - Hispanic or Latino
Place of birth - Native, outside of US (%) - American Indian and Alaska Native
Place of birth - Native, outside of US (%) - Multirace
Place of birth - Native, outside of US (%) - Other Race
Place of birth - Foreign born (%)
Place of birth - Foreign born (%) - White
Place of birth - Foreign born (%) - Black or African American
Place of birth - Foreign born (%) - Asian
Place of birth - Foreign born (%) - Hispanic or Latino
Place of birth - Foreign born (%) - American Indian and Alaska Native
Place of birth - Foreign born (%) - Multirace
Place of birth - Foreign born (%) - Other Race
Residents speaking English at home (%)
Residents speaking English at home - Born in the United States (%)
Residents speaking English at home - Native, born elsewhere (%)
Residents speaking English at home - Foreign born (%)
Residents speaking Spanish at home (%)
Residents speaking Spanish at home - Born in the United States (%)
Residents speaking Spanish at home - Native, born elsewhere (%)
Residents speaking Spanish at home - Foreign born (%)
Residents speaking other language at home (%)
Residents speaking other language at home - Born in the United States (%)
Residents speaking other language at home - Native, born elsewhere (%)
Residents speaking other language at home - Foreign born (%)
Marital status - Never married (%)
Marital status - Now married (%)
Marital status - Separated (%)
Marital status - Widowed (%)
Marital status - Divorced (%)
Ancestries Reported - Arab (%)
Ancestries Reported - Czech (%)
Ancestries Reported - Danish (%)
Ancestries Reported - Dutch (%)
Ancestries Reported - English (%)
Ancestries Reported - French (%)
Ancestries Reported - French Canadian (%)
Ancestries Reported - German (%)
Ancestries Reported - Greek (%)
Ancestries Reported - Hungarian (%)
Ancestries Reported - Irish (%)
Ancestries Reported - Italian (%)
Ancestries Reported - Lithuanian (%)
Ancestries Reported - Norwegian (%)
Ancestries Reported - Polish (%)
Ancestries Reported - Portuguese (%)
Ancestries Reported - Russian (%)
Ancestries Reported - Scotch-Irish (%)
Ancestries Reported - Scottish (%)
Ancestries Reported - Slovak (%)
Ancestries Reported - Subsaharan African (%)
Ancestries Reported - Swedish (%)
Ancestries Reported - Swiss (%)
Ancestries Reported - Ukrainian (%)
Ancestries Reported - United States (%)
Ancestries Reported - Welsh (%)
Ancestries Reported - West Indian (%)
Ancestries Reported - Other (%)
Geographical mobility - Same house 1 year ago (%)
Geographical mobility - Same house 1 year ago (%) - White
Geographical mobility - Same house 1 year ago (%) - Black or African American
Geographical mobility - Same house 1 year ago (%) - Asian
Geographical mobility - Same house 1 year ago (%) - Hispanic or Latino
Geographical mobility - Same house 1 year ago (%) - American Indian and Alaska Native
Geographical mobility - Same house 1 year ago (%) - Multirace
Geographical mobility - Same house 1 year ago (%) - Other Race
Geographical mobility - Moved within same county (%)
Geographical mobility - Moved within same county (%) - White
Geographical mobility - Moved within same county (%) - Black or African American
Geographical mobility - Moved within same county (%) - Asian
Geographical mobility - Moved within same county (%) - Hispanic or Latino
Geographical mobility - Moved within same county (%) - American Indian and Alaska Native
Geographical mobility - Moved within same county (%) - Multirace
Geographical mobility - Moved within same county (%) - Other Race
Geographical mobility - Moved from different county within same state (%)
Geographical mobility - Moved from different county within same state (%) - White
Geographical mobility - Moved from different county within same state (%) - Black or African American
Geographical mobility - Moved from different county within same state (%) - Asian
Geographical mobility - Moved from different county within same state (%) - Hispanic or Latino
Geographical mobility - Moved from different county within same state (%) - American Indian and Alaska Native
Geographical mobility - Moved from different county within same state (%) - Multirace
Geographical mobility - Moved from different county within same state (%) - Other Race
Geographical mobility - Moved from different state (%)
Geographical mobility - Moved from different state (%) - White
Geographical mobility - Moved from different state (%) - Black or African American
Geographical mobility - Moved from different state (%) - Asian
Geographical mobility - Moved from different state (%) - Hispanic or Latino
Geographical mobility - Moved from different state (%) - American Indian and Alaska Native
Geographical mobility - Moved from different state (%) - Multirace
Geographical mobility - Moved from different state (%) - Other Race
Geographical mobility - Moved from abroad (%)
Geographical mobility - Moved from abroad (%) - White
Geographical mobility - Moved from abroad (%) - Black or African American
Geographical mobility - Moved from abroad (%) - Asian
Geographical mobility - Moved from abroad (%) - Hispanic or Latino
Geographical mobility - Moved from abroad (%) - American Indian and Alaska Native
Geographical mobility - Moved from abroad (%) - Multirace
Geographical mobility - Moved from abroad (%) - Other Race
Place of birth for the foreign-born population - Ireland (%)
Place of birth for the foreign-born population - Denmark (%)
Place of birth for the foreign-born population - Norway (%)
Place of birth for the foreign-born population - Sweden (%)
Place of birth for the foreign-born population - United Kingdom (%)
Place of birth for the foreign-born population - England (%)
Place of birth for the foreign-born population - Scotland (%)
Place of birth for the foreign-born population - Other Northern Europe (%)
Place of birth for the foreign-born population - Austria (%)
Place of birth for the foreign-born population - Belgium (%)
Place of birth for the foreign-born population - France (%)
Place of birth for the foreign-born population - Germany (%)
Place of birth for the foreign-born population - Netherlands (%)
Place of birth for the foreign-born population - Switzerland (%)
Place of birth for the foreign-born population - Other Western Europe (%)
Place of birth for the foreign-born population - Greece (%)
Place of birth for the foreign-born population - Italy (%)
Place of birth for the foreign-born population - Portugal (%)
Place of birth for the foreign-born population - Spain (%)
Place of birth for the foreign-born population - Other Southern Europe (%)
Place of birth for the foreign-born population - Albania (%)
Place of birth for the foreign-born population - Belarus (%)
Place of birth for the foreign-born population - Bosnia and Herzegovina (%)
Place of birth for the foreign-born population - Bulgaria (%)
Place of birth for the foreign-born population - Croatia (%)
Place of birth for the foreign-born population - Czechoslovakia (%)
Place of birth for the foreign-born population - Hungary (%)
Place of birth for the foreign-born population - Latvia (%)
Place of birth for the foreign-born population - Lithuania (%)
Place of birth for the foreign-born population - North Macedonia (Macedonia) (%)
Place of birth for the foreign-born population - Moldova (%)
Place of birth for the foreign-born population - Poland (%)
Place of birth for the foreign-born population - Romania (%)
Place of birth for the foreign-born population - Russia (%)
Place of birth for the foreign-born population - Serbia (%)
Place of birth for the foreign-born population - Ukraine (%)
Place of birth for the foreign-born population - Other Eastern Europe (%)
Place of birth for the foreign-born population - China (%)
Place of birth for the foreign-born population - Hong Kong (%)
Place of birth for the foreign-born population - Taiwan (%)
Place of birth for the foreign-born population - Japan (%)
Place of birth for the foreign-born population - Korea (%)
Place of birth for the foreign-born population - Other Eastern Asia (%)
Place of birth for the foreign-born population - Afghanistan (%)
Place of birth for the foreign-born population - Bangladesh (%)
Place of birth for the foreign-born population - India (%)
Place of birth for the foreign-born population - Iran (%)
Place of birth for the foreign-born population - Kazakhstan (%)
Place of birth for the foreign-born population - Nepal (%)
Place of birth for the foreign-born population - Pakistan (%)
Place of birth for the foreign-born population - Sri Lanka (%)
Place of birth for the foreign-born population - Uzbekistan (%)
Place of birth for the foreign-born population - Other South Central Asia (%)
Place of birth for the foreign-born population - Burma (%)
Place of birth for the foreign-born population - Cambodia (%)
Place of birth for the foreign-born population - Indonesia (%)
Place of birth for the foreign-born population - Laos (%)
Place of birth for the foreign-born population - Malaysia (%)
Place of birth for the foreign-born population - Philippines (%)
Place of birth for the foreign-born population - Singapore (%)
Place of birth for the foreign-born population - Thailand (%)
Place of birth for the foreign-born population - Vietnam (%)
Place of birth for the foreign-born population - Other South Eastern Asia (%)
Place of birth for the foreign-born population - Armenia (%)
Place of birth for the foreign-born population - Iraq (%)
Place of birth for the foreign-born population - Israel (%)
Place of birth for the foreign-born population - Jordan (%)
Place of birth for the foreign-born population - Kuwait (%)
Place of birth for the foreign-born population - Lebanon (%)
Place of birth for the foreign-born population - Saudi Arabia (%)
Place of birth for the foreign-born population - Syria (%)
Place of birth for the foreign-born population - Turkey (%)
Place of birth for the foreign-born population - Yemen (%)
Place of birth for the foreign-born population - Other Western Asia (%)
Place of birth for the foreign-born population - Eritrea (%)
Place of birth for the foreign-born population - Ethiopia (%)
Place of birth for the foreign-born population - Kenya (%)
Place of birth for the foreign-born population - Somalia (%)
Place of birth for the foreign-born population - Uganda (%)
Place of birth for the foreign-born population - Zimbabwe (%)
Place of birth for the foreign-born population - Other Eastern Africa (%)
Place of birth for the foreign-born population - Cameroon (%)
Place of birth for the foreign-born population - Congo (%)
Place of birth for the foreign-born population - Democratic Republic of Congo (Zaire) (%)
Place of birth for the foreign-born population - Other Middle Africa (%)
Place of birth for the foreign-born population - Egypt (%)
Place of birth for the foreign-born population - Morocco (%)
Place of birth for the foreign-born population - Sudan (%)
Place of birth for the foreign-born population - Other Northern Africa (%)
Place of birth for the foreign-born population - South Africa (%)
Place of birth for the foreign-born population - Other Southern Africa (%)
Place of birth for the foreign-born population - Cabo Verde (%)
Place of birth for the foreign-born population - Ghana (%)
Place of birth for the foreign-born population - Liberia (%)
Place of birth for the foreign-born population - Nigeria (%)
Place of birth for the foreign-born population - Senegal (%)
Place of birth for the foreign-born population - Sierra Leone (%)
Place of birth for the foreign-born population - Other Western Africa (%)
Place of birth for the foreign-born population - Australia (%)
Place of birth for the foreign-born population - New Zealand (%)
Place of birth for the foreign-born population - Fiji (%)
Place of birth for the foreign-born population - Micronesia (%)
Place of birth for the foreign-born population - Bahamas (%)
Place of birth for the foreign-born population - Barbados (%)
Place of birth for the foreign-born population - Cuba (%)
Place of birth for the foreign-born population - Dominica (%)
Place of birth for the foreign-born population - Dominican Republic (%)
Place of birth for the foreign-born population - Grenada (%)
Place of birth for the foreign-born population - Haiti (%)
Place of birth for the foreign-born population - Jamaica (%)
Place of birth for the foreign-born population - St. Vincent and the Grenadines (%)
Place of birth for the foreign-born population - Trinidad and Tobago (%)
Place of birth for the foreign-born population - West Indies (%)
Place of birth for the foreign-born population - Other Caribbean (%)
Place of birth for the foreign-born population - Belize (%)
Place of birth for the foreign-born population - Costa Rica (%)
Place of birth for the foreign-born population - El Salvador (%)
Place of birth for the foreign-born population - Guatemala (%)
Place of birth for the foreign-born population - Honduras (%)
Place of birth for the foreign-born population - Mexico (%)
Place of birth for the foreign-born population - Nicaragua (%)
Place of birth for the foreign-born population - Panama (%)
Place of birth for the foreign-born population - Other Central America (%)
Place of birth for the foreign-born population - Argentina (%)
Place of birth for the foreign-born population - Bolivia (%)
Place of birth for the foreign-born population - Brazil (%)
Place of birth for the foreign-born population - Chile (%)
Place of birth for the foreign-born population - Colombia (%)
Place of birth for the foreign-born population - Ecuador (%)
Place of birth for the foreign-born population - Guyana (%)
Place of birth for the foreign-born population - Peru (%)
Place of birth for the foreign-born population - Uruguay (%)
Place of birth for the foreign-born population - Venezuela (%)
Place of birth for the foreign-born population - Other South America (%)
Place of birth for the foreign-born population - Canada (%)
Place of birth for the foreign-born population - Other Northern America (%)
Place of birth for the foreign-born population - Other (%)
Latest news about races in McDonough, GA collected exclusively by city-data.com from local newspapers, TV, and radio stations
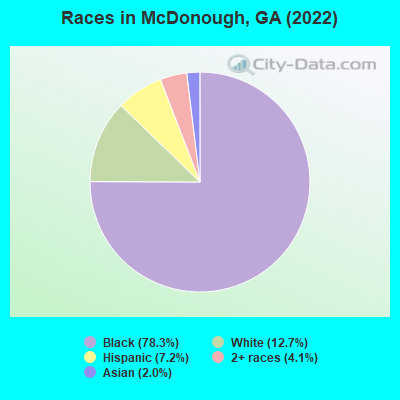
According to 2022 data, the most numerous races in McDonough, GA are White alone (3,813 residents), Black alone (23,515 residents), and Hispanic (2,151 residents). 89.1% of McDonough residents speak English at home. 10.6% of McDonough, GA residents are foreign-born (6.8% born in Latin America, 2.2% born in Africa), which is 5.3% greater than the foreign-born rate of 10.0% across the entire state of Georgia.
Race distribution in McDonough
2000 2022
5,128,661 62.6% White alone 2,331,465 28.5% Black alone 435,227 5.3% Hispanic 171,513 2.1% Asian alone 87,364 1.1% Two or more races 17,670 0.2% American Indian alone 11,275 0.1% Other race alone 3,278 0.04% Native Hawaiian and Other
5,415,657 49.6% White alone 3,349,240 30.7% Black alone 1,132,604 10.4% Hispanic 479,156 4.4% Asian alone 462,923 4.2% Two or more races 54,416 0.5% Other race alone 11,923 0.1% American Indian alone 6,957 0.06% Native Hawaiian and Other
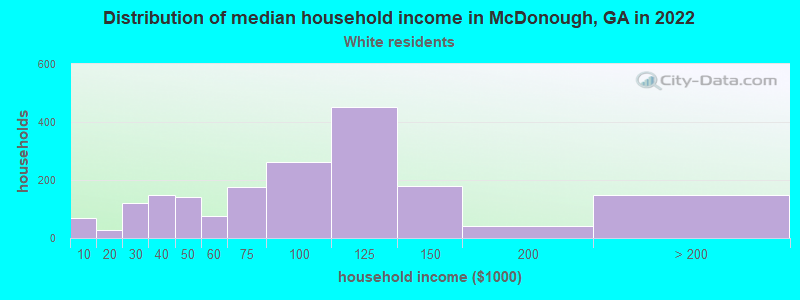
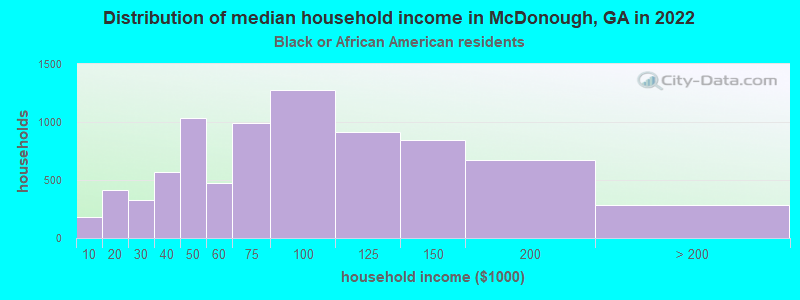
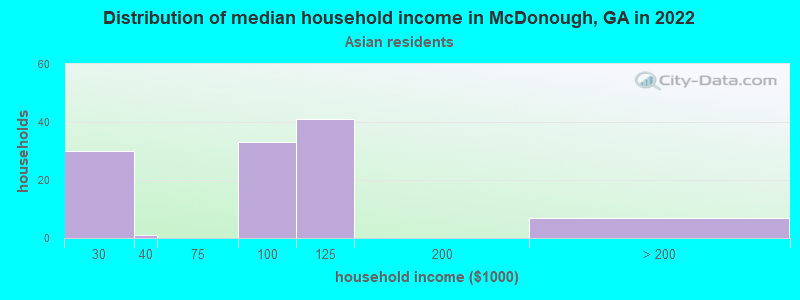
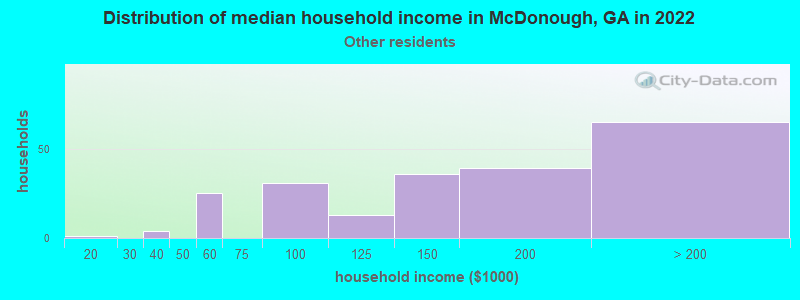
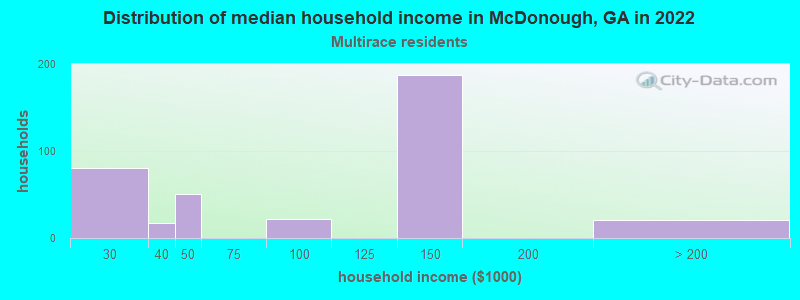
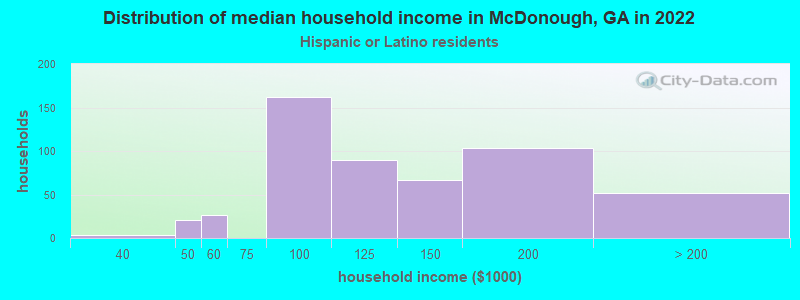
Income and house value in McDonough Median household income in 2022 $91,500 White non-Hispanic householders$74,148 Black householders$96,363 Asian householders$140,046 Some other race householders$119,309 Hispanic or Latino race householdersMedian 2022 house value $314,953 White Non-Hispanic householders$213,064 Black or African American householders $375,595 Asian householders$122,922 Some other race householders$232,186 Two or more races householders$328,611 Hispanic or Latino householders
Median age by race in McDonough
45.6 Median age for White residents38.3 51.8 30.5 Median age for Black or African American residents27.1 35.3 -649,999,999.4 Median age for American Indian / Alaska Native residents-545,119,704.8 -508,737,863.6 34.0 Median age for Asian residents36.8 28.5 -657,243,815.6 Median age for Native Hawaiian / Pacific Islander residents-666,666,666.0 -662,857,142.2 35.7 Median age for Other race residents34.7 35.5 25.4 Median age for Two or more races residents14.7 32.2 45.4 Median age for White alone residents34.3 52.9 28.0 Median age for Hispanic or Latino residents15.2 36.4
Owner/renter occupied households by race in McDonough
House owners and renters - White residents 921 53.5% Owner occupied800 46.5% Renter occupiedHouse owners and renters - Black or African American residents 4,160 53.6% Owner occupied3,599 46.4% Renter occupiedHouse owners and renters - Asian residents 115 94.3% Owner occupied7 5.7% Renter occupiedHouse owners and renters - Other race residents 182 93.1% Owner occupied14 6.9% Renter occupiedHouse owners and renters - Two or more races residents 337 89.0% Owner occupied42 11.0% Renter occupiedHouse owners and renters - White alone residents 768 49.6% Owner occupied781 50.4% Renter occupiedHouse owners and renters - Hispanic or Latino residents 434 70.6% Owner occupied180 29.4% Renter occupied
Language usage in McDonough
English speakers - Total 89.1% of residents of McDonough speak English at home.
4.0% of residents speak Spanish at home 824 73.3% Speak English very well300 26.7% Speak English less than very well7.6% of residents speak other language at home 1,924 90.5% Speak English very well203 9.5% Speak English less than very well
English speakers - Born in the United States 95.0% of residents of McDonough speak English at home.
2.4% of residents speak Spanish at home 267 96.4% Speak English very well10 3.6% Speak English less than very well2.2% of residents speak other language at home 250 96.2% Speak English very well10 3.8% Speak English less than very well
English speakers - Native, born elsewhere 35.9% of residents of McDonough speak English at home.
48.9% of residents speak Spanish at home 142 72.4% Speak English very well54 27.6% Speak English less than very well5.2% of residents speak other language at home 21 100.0% Speak English very well
English speakers - Foreign-born 43.5% of residents of McDonough speak English at home.
10.1% of residents speak Spanish at home 124 35.3% Speak English very well227 64.7% Speak English less than very well49.0% of residents speak other language at home 1,499 88.4% Speak English very well197 11.6% Speak English less than very well
White (Caucasian) - Speak only English Native:
97.2% (3,552)Foreign-born:
20.3% (35)
White (Caucasian) - Speak another language Native:
4.6% (167)Foreign-born:
77.4% (135)
Black or African American - Speak only English Native:
97.8% (19,216)Foreign-born:
55.5% (1,407)
Black or African American - Speak another language Native:
2.1% (420)Foreign-born:
44.7% (1,132)
Asian - Speak only English Native:
100.0% (186)Foreign-born:
17.4% (70)
Asian - Speak another language Native:
21.4% (40)Foreign-born:
80.0% (320)
Other race - Speak only English Native:
25.4% (66)Foreign-born:
4.0% (3)
Other race - Speak another language Native:
78.0% (203)Foreign-born:
100.0% (75)
Two or more races - Speak another language Native:
6.8% (177)Foreign-born:
88.3% (206)
White alone - Speak only English Native:
98.3% (3,518)Foreign-born:
51.1% (35)
White alone - Speak another language Native:
1.7% (60)Foreign-born:
29.2% (20)
Hispanic or Latino - Speak only English Native:
66.9% (1,156)Foreign-born:
1.2% (5)
Hispanic or Latino - Speak another language Native:
35.8% (619)Foreign-born:
100.0% (421)
Foreign-born residents in McDonough 3,172 residents are foreign born (6.8% Latin America , 2.2% Africa ).
This city:
10.6%Georgia:
10.4%
Marital status for residents in McDonough Marital status - White (Caucasian) population 15 years and over
Males 35.4% Never married55.1% Now married0.3% Separated2.8% Widowed6.4% DivorcedFemales 19.5% Never married40.4% Now married0.5% Separated18.2% Widowed21.4% DivorcedWomen who gave birth in the past 12 months Now married:
100.0% (29)Unmarried:
0.0% (0)
Women who did not give birth in the past 12 months Now married:
43.4% (289)Unmarried:
56.6% (377)
Marital status - Black or African American population 15 years and over
Males 48.4% Never married43.6% Now married3.3% Separated1.0% Widowed3.7% DivorcedFemales 40.5% Never married32.8% Now married5.2% Separated5.8% Widowed15.6% DivorcedWomen who gave birth in the past 12 months Now married:
54.4% (438)Unmarried:
45.6% (368)
Women who did not give birth in the past 12 months Now married:
33.9% (1,887)Unmarried:
66.1% (3,677)
Marital status - Asian population 15 years and over
Males 32.0% Never married62.7% Now married0.0% Separated1.2% Widowed4.1% DivorcedFemales 35.4% Never married59.7% Now married0.0% Separated2.5% Widowed2.5% DivorcedWomen who gave birth in the past 12 months Now married:
100.0% (73)Unmarried:
0.0% (0)
Women who did not give birth in the past 12 months Now married:
32.8% (44)Unmarried:
67.2% (91)
Marital status - Other race population 15 years and over
Males 56.4% Never married43.6% Now married0.0% Separated0.0% Widowed0.0% DivorcedFemales 0.0% Never married52.6% Now married0.0% Separated14.6% Widowed32.9% DivorcedWomen who did not give birth in the past 12 months Now married:
82.1% (124)Unmarried:
17.9% (27)
Marital status - Two or more races population 15 years and over
Males 39.6% Never married58.2% Now married0.3% Separated0.0% Widowed1.9% DivorcedFemales 62.1% Never married32.9% Now married1.7% Separated1.4% Widowed1.8% DivorcedWomen who did not give birth in the past 12 months Now married:
30.8% (336)Unmarried:
69.2% (753)
Marital status - White alone, not Hispanic / Latino population 15 years and over
Males 37.6% Never married51.5% Now married0.3% Separated3.2% Widowed7.4% DivorcedFemales 16.9% Never married40.0% Now married0.6% Separated19.5% Widowed23.0% DivorcedWomen who gave birth in the past 12 months Now married:
100.0% (30)Unmarried:
0.0% (0)
Women who did not give birth in the past 12 months Now married:
43.9% (263)Unmarried:
56.1% (336)
Marital status - Hispanic or Latino population 15 years and over
Males 54.9% Never married45.1% Now married0.0% Separated0.0% Widowed0.0% DivorcedFemales 43.4% Never married42.0% Now married0.0% Separated4.1% Widowed10.6% DivorcedWomen who did not give birth in the past 12 months Now married:
44.7% (307)Unmarried:
55.3% (380)
Ancestries in McDonough
1,658 11.4% Jamaican952 6.5% Haitian806 5.5% Ethiopian703 4.8% African628 4.3% American408 2.8% English265 1.8% Italian246 1.7% German216 1.5% Irish168 1.2% Trinidadian and Tobagonian163 1.1% Nigerian139 1.0% Scottish122 0.8% Dutch83 0.6% French80 0.5% West Indian73 0.5% European73 0.5% Barbadian56 0.4% Egyptian47 0.3% Canadian41 0.3% Bahamian39 0.3% Liberian34 0.2% Polish26 0.2% Ghanaian15 0.1% Scandinavian12 0.08% British12 0.08% Guyanese9 0.06% Moroccan8 0.05% Norwegian7 0.05% Czech5 0.03% Scotch-Irish4 0.03% British West Indian
Geographical mobility in McDonough Same house 1 year ago 2,727 68.5% White (Caucasian)19,523 84.4% Black or African American450 81.8% Asian530 93.1% Other race2,555 83.2% Two or more races2,466 65.6% White alone, not Hispanic / Latino1,829 84.9% Hispanic or LatinoMoved within same county 747 18.8% White / Caucasian670 2.9% Black or African American30 88.9% American Indian / Alaska Native22 4.0% Asian34 6.0% Other race191 6.2% Two or more races791 21.0% White alone, not Hispanic / Latino313 14.5% Hispanic or LatinoMoved within same state 101 2.5% White / Caucasian2,140 9.2% Black or African American28 5.0% Asian5 0.8% Other race11 0.4% Two or more races98 2.6% White alone, not Hispanic / Latino27 1.2% Hispanic or LatinoMoved from different state 251 6.3% White / Caucasian732 3.2% Black or African American55 10.0% Asian191 6.2% Two or more races251 6.7% White alone, not Hispanic / Latino6 0.3% Hispanic or LatinoMoved from abroad 13 0.1% Black or African American
Children Nativity (place of birth) in McDonough
Children under 6 years - Living with two parents Both parents native 590 100.0% NativeBoth parents foreign-born 133 100.0% NativeOne native, one foreign-born parent 618 100.0% NativeChildren under 6 years - Living with one parent Native parent 806 100.0% NativeForeign-born parent 75 100.0% NativeChildren 6 to 17 years - Living with two parents Both parents native 2,473 98.5% Native37 1.5% Foreign-bornBoth parents foreign-born 272 100.0% NativeOne native, one foreign-born parent 341 96.7% Native12 3.3% Foreign-bornChildren 6 to 17 years - Living with one parent Native parent 1,352 100.0% NativeForeign-born parent 987 51.1% Native944 48.9% Foreign-born
Grandparents responsible for own grandchildren in McDonough
Grandparents (30 to 59 years) Black or African American 69 76.0% Responsible for grandchildren22 24.0% Not responsible for grandchildrenAsian 3 100.0% Not responsible for grandchildrenGrandparents (60 years and over) Black or African American 16 10.5% Responsible for grandchildren132 89.5% Not responsible for grandchildrenAsian 5 100.0% Not responsible for grandchildren