Races in Maywood, New Jersey (NJ) Detailed Stats
Data:
Races - White alone (%)
Races - White alone (% change since 2000)
Races - Black alone (%)
Races - Black alone (% change since 2000)
Races - American Indian alone (%)
Races - American Indian alone (% change since 2000)
Races - Asian alone (%)
Races - Asian alone (% change since 2000)
Races - Hispanic (%)
Races - Hispanic (% change since 2000)
Races - Native Hawaiian and Other Pacific Islander alone (%)
Races - Native Hawaiian and Other Pacific Islander alone (% change since 2000)
Races - Two or more races(%)
Races - Two or more races(% change since 2000)
Races - Other race alone (%)
Races - Other race alone (% change since 2000)
Racial diversity
Place of birth - Born in state of residence (%)
Place of birth - Born in state of residence (%) - White
Place of birth - Born in state of residence (%) - Black or African American
Place of birth - Born in state of residence (%) - Asian
Place of birth - Born in state of residence (%) - Hispanic or Latino
Place of birth - Born in state of residence (%) - American Indian and Alaska Native
Place of birth - Born in state of residence (%) - Multirace
Place of birth - Born in state of residence (%) - Other Race
Place of birth - Born in other state (%)
Place of birth - Born in other state (%) - White
Place of birth - Born in other state (%) - Black or African American
Place of birth - Born in other state (%) - Asian
Place of birth - Born in other state (%) - Hispanic or Latino
Place of birth - Born in other state (%) - American Indian and Alaska Native
Place of birth - Born in other state (%) - Multirace
Place of birth - Born in other state (%) - Other Race
Place of birth - Native, outside of US (%)
Place of birth - Native, outside of US (%) - White
Place of birth - Native, outside of US (%) - Black or African American
Place of birth - Native, outside of US (%) - Asian
Place of birth - Native, outside of US (%) - Hispanic or Latino
Place of birth - Native, outside of US (%) - American Indian and Alaska Native
Place of birth - Native, outside of US (%) - Multirace
Place of birth - Native, outside of US (%) - Other Race
Place of birth - Foreign born (%)
Place of birth - Foreign born (%) - White
Place of birth - Foreign born (%) - Black or African American
Place of birth - Foreign born (%) - Asian
Place of birth - Foreign born (%) - Hispanic or Latino
Place of birth - Foreign born (%) - American Indian and Alaska Native
Place of birth - Foreign born (%) - Multirace
Place of birth - Foreign born (%) - Other Race
Residents speaking English at home (%)
Residents speaking English at home - Born in the United States (%)
Residents speaking English at home - Native, born elsewhere (%)
Residents speaking English at home - Foreign born (%)
Residents speaking Spanish at home (%)
Residents speaking Spanish at home - Born in the United States (%)
Residents speaking Spanish at home - Native, born elsewhere (%)
Residents speaking Spanish at home - Foreign born (%)
Residents speaking other language at home (%)
Residents speaking other language at home - Born in the United States (%)
Residents speaking other language at home - Native, born elsewhere (%)
Residents speaking other language at home - Foreign born (%)
Marital status - Never married (%)
Marital status - Now married (%)
Marital status - Separated (%)
Marital status - Widowed (%)
Marital status - Divorced (%)
Ancestries Reported - Arab (%)
Ancestries Reported - Czech (%)
Ancestries Reported - Danish (%)
Ancestries Reported - Dutch (%)
Ancestries Reported - English (%)
Ancestries Reported - French (%)
Ancestries Reported - French Canadian (%)
Ancestries Reported - German (%)
Ancestries Reported - Greek (%)
Ancestries Reported - Hungarian (%)
Ancestries Reported - Irish (%)
Ancestries Reported - Italian (%)
Ancestries Reported - Lithuanian (%)
Ancestries Reported - Norwegian (%)
Ancestries Reported - Polish (%)
Ancestries Reported - Portuguese (%)
Ancestries Reported - Russian (%)
Ancestries Reported - Scotch-Irish (%)
Ancestries Reported - Scottish (%)
Ancestries Reported - Slovak (%)
Ancestries Reported - Subsaharan African (%)
Ancestries Reported - Swedish (%)
Ancestries Reported - Swiss (%)
Ancestries Reported - Ukrainian (%)
Ancestries Reported - United States (%)
Ancestries Reported - Welsh (%)
Ancestries Reported - West Indian (%)
Ancestries Reported - Other (%)
Geographical mobility - Same house 1 year ago (%)
Geographical mobility - Same house 1 year ago (%) - White
Geographical mobility - Same house 1 year ago (%) - Black or African American
Geographical mobility - Same house 1 year ago (%) - Asian
Geographical mobility - Same house 1 year ago (%) - Hispanic or Latino
Geographical mobility - Same house 1 year ago (%) - American Indian and Alaska Native
Geographical mobility - Same house 1 year ago (%) - Multirace
Geographical mobility - Same house 1 year ago (%) - Other Race
Geographical mobility - Moved within same county (%)
Geographical mobility - Moved within same county (%) - White
Geographical mobility - Moved within same county (%) - Black or African American
Geographical mobility - Moved within same county (%) - Asian
Geographical mobility - Moved within same county (%) - Hispanic or Latino
Geographical mobility - Moved within same county (%) - American Indian and Alaska Native
Geographical mobility - Moved within same county (%) - Multirace
Geographical mobility - Moved within same county (%) - Other Race
Geographical mobility - Moved from different county within same state (%)
Geographical mobility - Moved from different county within same state (%) - White
Geographical mobility - Moved from different county within same state (%) - Black or African American
Geographical mobility - Moved from different county within same state (%) - Asian
Geographical mobility - Moved from different county within same state (%) - Hispanic or Latino
Geographical mobility - Moved from different county within same state (%) - American Indian and Alaska Native
Geographical mobility - Moved from different county within same state (%) - Multirace
Geographical mobility - Moved from different county within same state (%) - Other Race
Geographical mobility - Moved from different state (%)
Geographical mobility - Moved from different state (%) - White
Geographical mobility - Moved from different state (%) - Black or African American
Geographical mobility - Moved from different state (%) - Asian
Geographical mobility - Moved from different state (%) - Hispanic or Latino
Geographical mobility - Moved from different state (%) - American Indian and Alaska Native
Geographical mobility - Moved from different state (%) - Multirace
Geographical mobility - Moved from different state (%) - Other Race
Geographical mobility - Moved from abroad (%)
Geographical mobility - Moved from abroad (%) - White
Geographical mobility - Moved from abroad (%) - Black or African American
Geographical mobility - Moved from abroad (%) - Asian
Geographical mobility - Moved from abroad (%) - Hispanic or Latino
Geographical mobility - Moved from abroad (%) - American Indian and Alaska Native
Geographical mobility - Moved from abroad (%) - Multirace
Geographical mobility - Moved from abroad (%) - Other Race
Place of birth for the foreign-born population - Ireland (%)
Place of birth for the foreign-born population - Denmark (%)
Place of birth for the foreign-born population - Norway (%)
Place of birth for the foreign-born population - Sweden (%)
Place of birth for the foreign-born population - United Kingdom (%)
Place of birth for the foreign-born population - England (%)
Place of birth for the foreign-born population - Scotland (%)
Place of birth for the foreign-born population - Other Northern Europe (%)
Place of birth for the foreign-born population - Austria (%)
Place of birth for the foreign-born population - Belgium (%)
Place of birth for the foreign-born population - France (%)
Place of birth for the foreign-born population - Germany (%)
Place of birth for the foreign-born population - Netherlands (%)
Place of birth for the foreign-born population - Switzerland (%)
Place of birth for the foreign-born population - Other Western Europe (%)
Place of birth for the foreign-born population - Greece (%)
Place of birth for the foreign-born population - Italy (%)
Place of birth for the foreign-born population - Portugal (%)
Place of birth for the foreign-born population - Spain (%)
Place of birth for the foreign-born population - Other Southern Europe (%)
Place of birth for the foreign-born population - Albania (%)
Place of birth for the foreign-born population - Belarus (%)
Place of birth for the foreign-born population - Bosnia and Herzegovina (%)
Place of birth for the foreign-born population - Bulgaria (%)
Place of birth for the foreign-born population - Croatia (%)
Place of birth for the foreign-born population - Czechoslovakia (%)
Place of birth for the foreign-born population - Hungary (%)
Place of birth for the foreign-born population - Latvia (%)
Place of birth for the foreign-born population - Lithuania (%)
Place of birth for the foreign-born population - North Macedonia (Macedonia) (%)
Place of birth for the foreign-born population - Moldova (%)
Place of birth for the foreign-born population - Poland (%)
Place of birth for the foreign-born population - Romania (%)
Place of birth for the foreign-born population - Russia (%)
Place of birth for the foreign-born population - Serbia (%)
Place of birth for the foreign-born population - Ukraine (%)
Place of birth for the foreign-born population - Other Eastern Europe (%)
Place of birth for the foreign-born population - China (%)
Place of birth for the foreign-born population - Hong Kong (%)
Place of birth for the foreign-born population - Taiwan (%)
Place of birth for the foreign-born population - Japan (%)
Place of birth for the foreign-born population - Korea (%)
Place of birth for the foreign-born population - Other Eastern Asia (%)
Place of birth for the foreign-born population - Afghanistan (%)
Place of birth for the foreign-born population - Bangladesh (%)
Place of birth for the foreign-born population - India (%)
Place of birth for the foreign-born population - Iran (%)
Place of birth for the foreign-born population - Kazakhstan (%)
Place of birth for the foreign-born population - Nepal (%)
Place of birth for the foreign-born population - Pakistan (%)
Place of birth for the foreign-born population - Sri Lanka (%)
Place of birth for the foreign-born population - Uzbekistan (%)
Place of birth for the foreign-born population - Other South Central Asia (%)
Place of birth for the foreign-born population - Burma (%)
Place of birth for the foreign-born population - Cambodia (%)
Place of birth for the foreign-born population - Indonesia (%)
Place of birth for the foreign-born population - Laos (%)
Place of birth for the foreign-born population - Malaysia (%)
Place of birth for the foreign-born population - Philippines (%)
Place of birth for the foreign-born population - Singapore (%)
Place of birth for the foreign-born population - Thailand (%)
Place of birth for the foreign-born population - Vietnam (%)
Place of birth for the foreign-born population - Other South Eastern Asia (%)
Place of birth for the foreign-born population - Armenia (%)
Place of birth for the foreign-born population - Iraq (%)
Place of birth for the foreign-born population - Israel (%)
Place of birth for the foreign-born population - Jordan (%)
Place of birth for the foreign-born population - Kuwait (%)
Place of birth for the foreign-born population - Lebanon (%)
Place of birth for the foreign-born population - Saudi Arabia (%)
Place of birth for the foreign-born population - Syria (%)
Place of birth for the foreign-born population - Turkey (%)
Place of birth for the foreign-born population - Yemen (%)
Place of birth for the foreign-born population - Other Western Asia (%)
Place of birth for the foreign-born population - Eritrea (%)
Place of birth for the foreign-born population - Ethiopia (%)
Place of birth for the foreign-born population - Kenya (%)
Place of birth for the foreign-born population - Somalia (%)
Place of birth for the foreign-born population - Uganda (%)
Place of birth for the foreign-born population - Zimbabwe (%)
Place of birth for the foreign-born population - Other Eastern Africa (%)
Place of birth for the foreign-born population - Cameroon (%)
Place of birth for the foreign-born population - Congo (%)
Place of birth for the foreign-born population - Democratic Republic of Congo (Zaire) (%)
Place of birth for the foreign-born population - Other Middle Africa (%)
Place of birth for the foreign-born population - Egypt (%)
Place of birth for the foreign-born population - Morocco (%)
Place of birth for the foreign-born population - Sudan (%)
Place of birth for the foreign-born population - Other Northern Africa (%)
Place of birth for the foreign-born population - South Africa (%)
Place of birth for the foreign-born population - Other Southern Africa (%)
Place of birth for the foreign-born population - Cabo Verde (%)
Place of birth for the foreign-born population - Ghana (%)
Place of birth for the foreign-born population - Liberia (%)
Place of birth for the foreign-born population - Nigeria (%)
Place of birth for the foreign-born population - Senegal (%)
Place of birth for the foreign-born population - Sierra Leone (%)
Place of birth for the foreign-born population - Other Western Africa (%)
Place of birth for the foreign-born population - Australia (%)
Place of birth for the foreign-born population - New Zealand (%)
Place of birth for the foreign-born population - Fiji (%)
Place of birth for the foreign-born population - Micronesia (%)
Place of birth for the foreign-born population - Bahamas (%)
Place of birth for the foreign-born population - Barbados (%)
Place of birth for the foreign-born population - Cuba (%)
Place of birth for the foreign-born population - Dominica (%)
Place of birth for the foreign-born population - Dominican Republic (%)
Place of birth for the foreign-born population - Grenada (%)
Place of birth for the foreign-born population - Haiti (%)
Place of birth for the foreign-born population - Jamaica (%)
Place of birth for the foreign-born population - St. Vincent and the Grenadines (%)
Place of birth for the foreign-born population - Trinidad and Tobago (%)
Place of birth for the foreign-born population - West Indies (%)
Place of birth for the foreign-born population - Other Caribbean (%)
Place of birth for the foreign-born population - Belize (%)
Place of birth for the foreign-born population - Costa Rica (%)
Place of birth for the foreign-born population - El Salvador (%)
Place of birth for the foreign-born population - Guatemala (%)
Place of birth for the foreign-born population - Honduras (%)
Place of birth for the foreign-born population - Mexico (%)
Place of birth for the foreign-born population - Nicaragua (%)
Place of birth for the foreign-born population - Panama (%)
Place of birth for the foreign-born population - Other Central America (%)
Place of birth for the foreign-born population - Argentina (%)
Place of birth for the foreign-born population - Bolivia (%)
Place of birth for the foreign-born population - Brazil (%)
Place of birth for the foreign-born population - Chile (%)
Place of birth for the foreign-born population - Colombia (%)
Place of birth for the foreign-born population - Ecuador (%)
Place of birth for the foreign-born population - Guyana (%)
Place of birth for the foreign-born population - Peru (%)
Place of birth for the foreign-born population - Uruguay (%)
Place of birth for the foreign-born population - Venezuela (%)
Place of birth for the foreign-born population - Other South America (%)
Place of birth for the foreign-born population - Canada (%)
Place of birth for the foreign-born population - Other Northern America (%)
Place of birth for the foreign-born population - Other (%)
Latest news about races in Maywood, NJ collected exclusively by city-data.com from local newspapers, TV, and radio stations
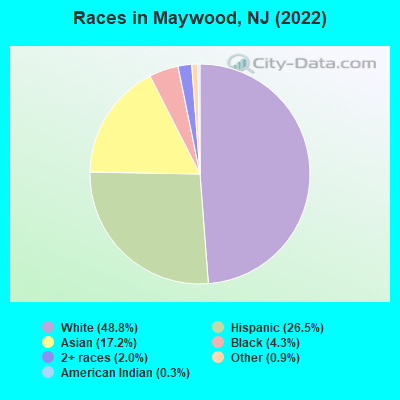
According to 2022 data, the most numerous races in Maywood, NJ are White alone (4,897 residents), Hispanic (2,656 residents), and Black alone (429 residents). 62.0% of Maywood residents speak English at home. 25.0% of Maywood, NJ residents are foreign-born (14.2% born in Asia, 7.4% born in Latin America), which is 8.2% greater than the foreign-born rate of 23.0% across the entire state of New Jersey.
Race distribution in Maywood
2000 2022
5,557,209 66.0% White alone 1,117,191 13.3% Hispanic 1,096,171 13.0% Black alone 477,012 5.7% Asian alone 133,689 1.6% Two or more races 19,565 0.2% Other race alone 11,338 0.1% American Indian alone 2,175 0.03% Native Hawaiian and Other
4,766,476 51.5% White alone 2,028,470 21.9% Hispanic 1,111,632 12.0% Black alone 923,546 10.0% Asian alone 332,237 3.6% Two or more races 89,847 1.0% Other race alone 8,557 0.09% American Indian alone 934 0.01% Native Hawaiian and Other
Income and house value in Maywood Median household income in 2022 $104,254 White non-Hispanic householders$157,481 Black householders$120,224 Asian householders$145,056 Some other race householders$135,690 Two or more races householders$136,682 Hispanic or Latino race householdersMedian 2022 house value $479,079 White Non-Hispanic householders$478,109 Black or African American householders $496,787 Asian householders$582,173 Some other race householders$626,563 Two or more races householders$477,867 Hispanic or Latino householders
Median age by race in Maywood
50.5 Median age for White residents48.4 51.4 40.8 Median age for Black or African American residents43.3 39.1 68.2 Median age for American Indian / Alaska Native residents61.0 -753,722,794.2 49.2 Median age for Asian residents48.8 51.8 -510,460,250.5 Median age for Native Hawaiian / Pacific Islander residents-514,767,932.0 -713,070,378.3 39.2 Median age for Other race residents38.8 43.5 33.7 Median age for Two or more races residents33.8 33.9 51.1 Median age for White alone residents50.1 52.3 34.8 Median age for Hispanic or Latino residents31.2 39.4
Owner/renter occupied households by race in Maywood
House owners and renters - White residents 1,724 81.1% Owner occupied403 18.9% Renter occupiedHouse owners and renters - Black or African American residents 104 63.5% Owner occupied60 36.5% Renter occupiedHouse owners and renters - American Indian / Alaska Native residents 15 32.2% Owner occupied31 67.8% Renter occupiedHouse owners and renters - Asian residents 316 51.0% Owner occupied303 49.0% Renter occupiedHouse owners and renters - Other race residents 223 57.8% Owner occupied163 42.2% Renter occupiedHouse owners and renters - Two or more races residents 334 60.3% Owner occupied219 39.7% Renter occupiedHouse owners and renters - White alone residents 1,706 80.4% Owner occupied415 19.6% Renter occupiedHouse owners and renters - Hispanic or Latino residents 531 62.8% Owner occupied315 37.2% Renter occupied
Language usage in Maywood
English speakers - Total 62.0% of residents of Maywood speak English at home.
18.2% of residents speak Spanish at home 1,213 69.9% Speak English very well523 30.1% Speak English less than very well19.6% of residents speak other language at home 1,113 59.5% Speak English very well757 40.5% Speak English less than very well
English speakers - Born in the United States 68.9% of residents of Maywood speak English at home.
29.4% of residents speak Spanish at home 702 93.0% Speak English very well53 7.0% Speak English less than very well4.1% of residents speak other language at home 90 85.7% Speak English very well15 14.3% Speak English less than very well
English speakers - Native, born elsewhere 24.8% of residents of Maywood speak English at home.
75.7% of residents speak Spanish at home 94 56.0% Speak English very well74 44.0% Speak English less than very well9.5% of residents speak other language at home 2 9.5% Speak English very well19 90.5% Speak English less than very well
English speakers - Foreign-born 11.8% of residents of Maywood speak English at home.
24.6% of residents speak Spanish at home 258 41.9% Speak English very well358 58.1% Speak English less than very well63.4% of residents speak other language at home 882 55.5% Speak English very well708 44.5% Speak English less than very well
White (Caucasian) - Speak only English Native:
94.6% (4,429)Foreign-born:
18.6% (66)
White (Caucasian) - Speak another language Native:
6.6% (307)Foreign-born:
80.7% (288)
Black or African American - Speak only English Native:
73.1% (279)Foreign-born:
60.7% (109)
Black or African American - Speak another language Native:
27.1% (103)Foreign-born:
38.4% (69)
American Indian / Alaska Native - Speak another language Native:
17.0% (8)Foreign-born:
100.0% (18)
Asian - Speak only English Native:
44.1% (127)Foreign-born:
6.3% (80)
Asian - Speak another language Native:
55.8% (160)Foreign-born:
93.9% (1,201)
Other race - Speak another language Native:
51.7% (324)Foreign-born:
100.0% (385)
Two or more races - Speak only English Native:
45.1% (521)Foreign-born:
10.3% (41)
Two or more races - Speak another language Native:
56.6% (654)Foreign-born:
89.9% (356)
White alone - Speak only English Native:
95.3% (4,179)Foreign-born:
19.6% (68)
White alone - Speak another language Native:
4.9% (213)Foreign-born:
80.5% (280)
Hispanic or Latino - Speak only English Native:
43.8% (815)Foreign-born:
5.0% (33)
Hispanic or Latino - Speak another language Native:
55.1% (1,024)Foreign-born:
94.4% (628)
Foreign-born residents in Maywood 2,514 residents are foreign born (14.2% Asia , 7.4% Latin America ).
This city:
25.0%New Jersey:
23.2%
Marital status for residents in Maywood Marital status - White (Caucasian) population 15 years and over
Males 34.3% Never married51.6% Now married0.0% Separated7.5% Widowed6.6% DivorcedFemales 28.6% Never married52.7% Now married0.0% Separated11.9% Widowed6.7% DivorcedWomen who gave birth in the past 12 months Now married:
100.0% (61)Unmarried:
0.0% (0)
Women who did not give birth in the past 12 months Now married:
44.3% (417)Unmarried:
55.7% (523)
Marital status - Black or African American population 15 years and over
Males 32.9% Never married66.7% Now married0.5% Separated0.0% Widowed0.0% DivorcedFemales 45.5% Never married41.2% Now married0.0% Separated0.0% Widowed13.3% DivorcedWomen who gave birth in the past 12 months Now married:
0.0% (0)Unmarried:
100.0% (7)
Women who did not give birth in the past 12 months Now married:
36.7% (60)Unmarried:
63.3% (103)
Marital status - American Indian / Alaska Native population 15 years and over
Males 28.9% Never married6.7% Now married46.7% Separated0.0% Widowed17.8% DivorcedFemales 0.0% Never married0.0% Now married0.0% Separated0.0% Widowed100.0% DivorcedMarital status - Asian population 15 years and over
Males 25.6% Never married49.6% Now married0.0% Separated12.9% Widowed11.9% DivorcedFemales 6.3% Never married72.3% Now married0.0% Separated17.0% Widowed4.4% DivorcedWomen who gave birth in the past 12 months Now married:
100.0% (32)Unmarried:
0.0% (0)
Women who did not give birth in the past 12 months Now married:
79.6% (194)Unmarried:
20.4% (50)
Marital status - Other race population 15 years and over
Males 36.2% Never married56.5% Now married3.3% Separated0.0% Widowed4.0% DivorcedFemales 26.1% Never married68.6% Now married0.0% Separated0.0% Widowed5.3% DivorcedWomen who did not give birth in the past 12 months Now married:
54.9% (140)Unmarried:
45.1% (115)
Marital status - Two or more races population 15 years and over
Males 34.3% Never married55.1% Now married0.0% Separated4.0% Widowed6.6% DivorcedFemales 48.4% Never married33.2% Now married5.1% Separated6.0% Widowed7.4% DivorcedWomen who did not give birth in the past 12 months Now married:
40.2% (171)Unmarried:
59.8% (254)
Marital status - White alone, not Hispanic / Latino population 15 years and over
Males 32.1% Never married52.7% Now married0.0% Separated7.9% Widowed7.3% DivorcedFemales 26.0% Never married54.3% Now married0.0% Separated13.2% Widowed6.5% DivorcedWomen who gave birth in the past 12 months Now married:
100.0% (70)Unmarried:
0.0% (0)
Women who did not give birth in the past 12 months Now married:
46.9% (395)Unmarried:
53.1% (447)
Marital status - Hispanic or Latino population 15 years and over
Males 40.2% Never married50.9% Now married1.0% Separated2.7% Widowed5.1% DivorcedFemales 43.7% Never married40.7% Now married2.1% Separated3.6% Widowed9.8% DivorcedWomen who did not give birth in the past 12 months Now married:
38.9% (291)Unmarried:
61.1% (456)
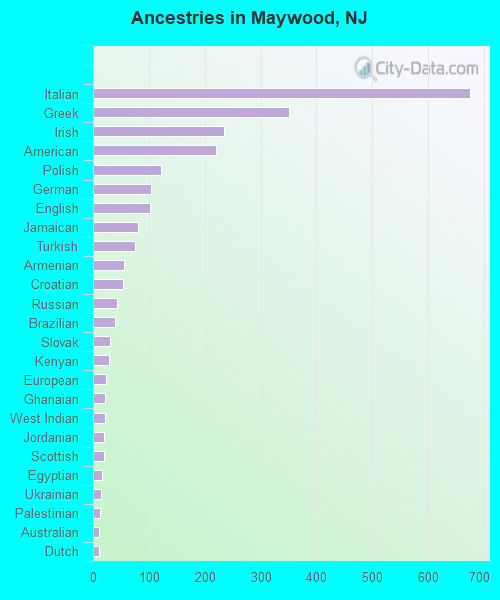
Ancestries in Maywood
675 12.6% Italian351 6.5% Greek234 4.4% Irish221 4.1% American122 2.3% Polish103 1.9% German102 1.9% English81 1.5% Jamaican75 1.4% Turkish55 1.0% Armenian54 1.0% Croatian43 0.8% Russian39 0.7% Brazilian30 0.6% Slovak28 0.5% Kenyan23 0.4% European21 0.4% Ghanaian21 0.4% West Indian20 0.4% Jordanian20 0.4% Scottish16 0.3% Egyptian15 0.3% Ukrainian12 0.2% Palestinian10 0.2% Australian10 0.2% Dutch10 0.2% Romanian7 0.1% Syrian5 0.09% Lebanese5 0.09% Guyanese5 0.09% Scotch-Irish
Geographical mobility in Maywood Same house 1 year ago 4,687 93.0% White (Caucasian)485 84.1% Black or African American87 96.6% American Indian / Alaska Native1,309 76.2% Asian855 82.4% Other race1,242 70.9% Two or more races4,497 92.7% White alone, not Hispanic / Latino2,081 78.6% Hispanic or LatinoMoved within same county 182 3.6% White / Caucasian6 1.0% Black or African American378 22.0% Asian61 5.8% Other race221 12.6% Two or more races196 4.0% White alone, not Hispanic / Latino170 6.4% Hispanic or LatinoMoved within same state 33 0.7% White / Caucasian57 5.5% Other race40 2.3% Two or more races11 0.2% White alone, not Hispanic / Latino145 5.5% Hispanic or LatinoMoved from different state 123 2.4% White / Caucasian105 18.2% Black or African American29 2.8% Other race209 11.9% Two or more races136 2.8% White alone, not Hispanic / Latino226 8.5% Hispanic or LatinoMoved from abroad 21 0.4% White34 2.0% Asian30 0.6% White alone, not Hispanic / Latino
Children Nativity (place of birth) in Maywood
Children under 6 years - Living with two parents Both parents native 244 100.0% NativeBoth parents foreign-born 172 100.0% NativeOne native, one foreign-born parent 62 100.0% NativeChildren under 6 years - Living with one parent Foreign-born parent 71 100.0% NativeChildren 6 to 17 years - Living with two parents Both parents native 564 99.7% Native2 0.3% Foreign-bornBoth parents foreign-born 134 86.7% Native21 13.3% Foreign-bornOne native, one foreign-born parent 246 100.0% NativeChildren 6 to 17 years - Living with one parent Native parent 168 100.0% NativeForeign-born parent 6 49.5% Native6 50.5% Foreign-born