Races in Manville, New Jersey (NJ) Detailed Stats
Data:
Races - White alone (%)
Races - White alone (% change since 2000)
Races - Black alone (%)
Races - Black alone (% change since 2000)
Races - American Indian alone (%)
Races - American Indian alone (% change since 2000)
Races - Asian alone (%)
Races - Asian alone (% change since 2000)
Races - Hispanic (%)
Races - Hispanic (% change since 2000)
Races - Native Hawaiian and Other Pacific Islander alone (%)
Races - Native Hawaiian and Other Pacific Islander alone (% change since 2000)
Races - Two or more races(%)
Races - Two or more races(% change since 2000)
Races - Other race alone (%)
Races - Other race alone (% change since 2000)
Racial diversity
Place of birth - Born in state of residence (%)
Place of birth - Born in state of residence (%) - White
Place of birth - Born in state of residence (%) - Black or African American
Place of birth - Born in state of residence (%) - Asian
Place of birth - Born in state of residence (%) - Hispanic or Latino
Place of birth - Born in state of residence (%) - American Indian and Alaska Native
Place of birth - Born in state of residence (%) - Multirace
Place of birth - Born in state of residence (%) - Other Race
Place of birth - Born in other state (%)
Place of birth - Born in other state (%) - White
Place of birth - Born in other state (%) - Black or African American
Place of birth - Born in other state (%) - Asian
Place of birth - Born in other state (%) - Hispanic or Latino
Place of birth - Born in other state (%) - American Indian and Alaska Native
Place of birth - Born in other state (%) - Multirace
Place of birth - Born in other state (%) - Other Race
Place of birth - Native, outside of US (%)
Place of birth - Native, outside of US (%) - White
Place of birth - Native, outside of US (%) - Black or African American
Place of birth - Native, outside of US (%) - Asian
Place of birth - Native, outside of US (%) - Hispanic or Latino
Place of birth - Native, outside of US (%) - American Indian and Alaska Native
Place of birth - Native, outside of US (%) - Multirace
Place of birth - Native, outside of US (%) - Other Race
Place of birth - Foreign born (%)
Place of birth - Foreign born (%) - White
Place of birth - Foreign born (%) - Black or African American
Place of birth - Foreign born (%) - Asian
Place of birth - Foreign born (%) - Hispanic or Latino
Place of birth - Foreign born (%) - American Indian and Alaska Native
Place of birth - Foreign born (%) - Multirace
Place of birth - Foreign born (%) - Other Race
Residents speaking English at home (%)
Residents speaking English at home - Born in the United States (%)
Residents speaking English at home - Native, born elsewhere (%)
Residents speaking English at home - Foreign born (%)
Residents speaking Spanish at home (%)
Residents speaking Spanish at home - Born in the United States (%)
Residents speaking Spanish at home - Native, born elsewhere (%)
Residents speaking Spanish at home - Foreign born (%)
Residents speaking other language at home (%)
Residents speaking other language at home - Born in the United States (%)
Residents speaking other language at home - Native, born elsewhere (%)
Residents speaking other language at home - Foreign born (%)
Marital status - Never married (%)
Marital status - Now married (%)
Marital status - Separated (%)
Marital status - Widowed (%)
Marital status - Divorced (%)
Ancestries Reported - Arab (%)
Ancestries Reported - Czech (%)
Ancestries Reported - Danish (%)
Ancestries Reported - Dutch (%)
Ancestries Reported - English (%)
Ancestries Reported - French (%)
Ancestries Reported - French Canadian (%)
Ancestries Reported - German (%)
Ancestries Reported - Greek (%)
Ancestries Reported - Hungarian (%)
Ancestries Reported - Irish (%)
Ancestries Reported - Italian (%)
Ancestries Reported - Lithuanian (%)
Ancestries Reported - Norwegian (%)
Ancestries Reported - Polish (%)
Ancestries Reported - Portuguese (%)
Ancestries Reported - Russian (%)
Ancestries Reported - Scotch-Irish (%)
Ancestries Reported - Scottish (%)
Ancestries Reported - Slovak (%)
Ancestries Reported - Subsaharan African (%)
Ancestries Reported - Swedish (%)
Ancestries Reported - Swiss (%)
Ancestries Reported - Ukrainian (%)
Ancestries Reported - United States (%)
Ancestries Reported - Welsh (%)
Ancestries Reported - West Indian (%)
Ancestries Reported - Other (%)
Geographical mobility - Same house 1 year ago (%)
Geographical mobility - Same house 1 year ago (%) - White
Geographical mobility - Same house 1 year ago (%) - Black or African American
Geographical mobility - Same house 1 year ago (%) - Asian
Geographical mobility - Same house 1 year ago (%) - Hispanic or Latino
Geographical mobility - Same house 1 year ago (%) - American Indian and Alaska Native
Geographical mobility - Same house 1 year ago (%) - Multirace
Geographical mobility - Same house 1 year ago (%) - Other Race
Geographical mobility - Moved within same county (%)
Geographical mobility - Moved within same county (%) - White
Geographical mobility - Moved within same county (%) - Black or African American
Geographical mobility - Moved within same county (%) - Asian
Geographical mobility - Moved within same county (%) - Hispanic or Latino
Geographical mobility - Moved within same county (%) - American Indian and Alaska Native
Geographical mobility - Moved within same county (%) - Multirace
Geographical mobility - Moved within same county (%) - Other Race
Geographical mobility - Moved from different county within same state (%)
Geographical mobility - Moved from different county within same state (%) - White
Geographical mobility - Moved from different county within same state (%) - Black or African American
Geographical mobility - Moved from different county within same state (%) - Asian
Geographical mobility - Moved from different county within same state (%) - Hispanic or Latino
Geographical mobility - Moved from different county within same state (%) - American Indian and Alaska Native
Geographical mobility - Moved from different county within same state (%) - Multirace
Geographical mobility - Moved from different county within same state (%) - Other Race
Geographical mobility - Moved from different state (%)
Geographical mobility - Moved from different state (%) - White
Geographical mobility - Moved from different state (%) - Black or African American
Geographical mobility - Moved from different state (%) - Asian
Geographical mobility - Moved from different state (%) - Hispanic or Latino
Geographical mobility - Moved from different state (%) - American Indian and Alaska Native
Geographical mobility - Moved from different state (%) - Multirace
Geographical mobility - Moved from different state (%) - Other Race
Geographical mobility - Moved from abroad (%)
Geographical mobility - Moved from abroad (%) - White
Geographical mobility - Moved from abroad (%) - Black or African American
Geographical mobility - Moved from abroad (%) - Asian
Geographical mobility - Moved from abroad (%) - Hispanic or Latino
Geographical mobility - Moved from abroad (%) - American Indian and Alaska Native
Geographical mobility - Moved from abroad (%) - Multirace
Geographical mobility - Moved from abroad (%) - Other Race
Place of birth for the foreign-born population - Ireland (%)
Place of birth for the foreign-born population - Denmark (%)
Place of birth for the foreign-born population - Norway (%)
Place of birth for the foreign-born population - Sweden (%)
Place of birth for the foreign-born population - United Kingdom (%)
Place of birth for the foreign-born population - England (%)
Place of birth for the foreign-born population - Scotland (%)
Place of birth for the foreign-born population - Other Northern Europe (%)
Place of birth for the foreign-born population - Austria (%)
Place of birth for the foreign-born population - Belgium (%)
Place of birth for the foreign-born population - France (%)
Place of birth for the foreign-born population - Germany (%)
Place of birth for the foreign-born population - Netherlands (%)
Place of birth for the foreign-born population - Switzerland (%)
Place of birth for the foreign-born population - Other Western Europe (%)
Place of birth for the foreign-born population - Greece (%)
Place of birth for the foreign-born population - Italy (%)
Place of birth for the foreign-born population - Portugal (%)
Place of birth for the foreign-born population - Spain (%)
Place of birth for the foreign-born population - Other Southern Europe (%)
Place of birth for the foreign-born population - Albania (%)
Place of birth for the foreign-born population - Belarus (%)
Place of birth for the foreign-born population - Bosnia and Herzegovina (%)
Place of birth for the foreign-born population - Bulgaria (%)
Place of birth for the foreign-born population - Croatia (%)
Place of birth for the foreign-born population - Czechoslovakia (%)
Place of birth for the foreign-born population - Hungary (%)
Place of birth for the foreign-born population - Latvia (%)
Place of birth for the foreign-born population - Lithuania (%)
Place of birth for the foreign-born population - North Macedonia (Macedonia) (%)
Place of birth for the foreign-born population - Moldova (%)
Place of birth for the foreign-born population - Poland (%)
Place of birth for the foreign-born population - Romania (%)
Place of birth for the foreign-born population - Russia (%)
Place of birth for the foreign-born population - Serbia (%)
Place of birth for the foreign-born population - Ukraine (%)
Place of birth for the foreign-born population - Other Eastern Europe (%)
Place of birth for the foreign-born population - China (%)
Place of birth for the foreign-born population - Hong Kong (%)
Place of birth for the foreign-born population - Taiwan (%)
Place of birth for the foreign-born population - Japan (%)
Place of birth for the foreign-born population - Korea (%)
Place of birth for the foreign-born population - Other Eastern Asia (%)
Place of birth for the foreign-born population - Afghanistan (%)
Place of birth for the foreign-born population - Bangladesh (%)
Place of birth for the foreign-born population - India (%)
Place of birth for the foreign-born population - Iran (%)
Place of birth for the foreign-born population - Kazakhstan (%)
Place of birth for the foreign-born population - Nepal (%)
Place of birth for the foreign-born population - Pakistan (%)
Place of birth for the foreign-born population - Sri Lanka (%)
Place of birth for the foreign-born population - Uzbekistan (%)
Place of birth for the foreign-born population - Other South Central Asia (%)
Place of birth for the foreign-born population - Burma (%)
Place of birth for the foreign-born population - Cambodia (%)
Place of birth for the foreign-born population - Indonesia (%)
Place of birth for the foreign-born population - Laos (%)
Place of birth for the foreign-born population - Malaysia (%)
Place of birth for the foreign-born population - Philippines (%)
Place of birth for the foreign-born population - Singapore (%)
Place of birth for the foreign-born population - Thailand (%)
Place of birth for the foreign-born population - Vietnam (%)
Place of birth for the foreign-born population - Other South Eastern Asia (%)
Place of birth for the foreign-born population - Armenia (%)
Place of birth for the foreign-born population - Iraq (%)
Place of birth for the foreign-born population - Israel (%)
Place of birth for the foreign-born population - Jordan (%)
Place of birth for the foreign-born population - Kuwait (%)
Place of birth for the foreign-born population - Lebanon (%)
Place of birth for the foreign-born population - Saudi Arabia (%)
Place of birth for the foreign-born population - Syria (%)
Place of birth for the foreign-born population - Turkey (%)
Place of birth for the foreign-born population - Yemen (%)
Place of birth for the foreign-born population - Other Western Asia (%)
Place of birth for the foreign-born population - Eritrea (%)
Place of birth for the foreign-born population - Ethiopia (%)
Place of birth for the foreign-born population - Kenya (%)
Place of birth for the foreign-born population - Somalia (%)
Place of birth for the foreign-born population - Uganda (%)
Place of birth for the foreign-born population - Zimbabwe (%)
Place of birth for the foreign-born population - Other Eastern Africa (%)
Place of birth for the foreign-born population - Cameroon (%)
Place of birth for the foreign-born population - Congo (%)
Place of birth for the foreign-born population - Democratic Republic of Congo (Zaire) (%)
Place of birth for the foreign-born population - Other Middle Africa (%)
Place of birth for the foreign-born population - Egypt (%)
Place of birth for the foreign-born population - Morocco (%)
Place of birth for the foreign-born population - Sudan (%)
Place of birth for the foreign-born population - Other Northern Africa (%)
Place of birth for the foreign-born population - South Africa (%)
Place of birth for the foreign-born population - Other Southern Africa (%)
Place of birth for the foreign-born population - Cabo Verde (%)
Place of birth for the foreign-born population - Ghana (%)
Place of birth for the foreign-born population - Liberia (%)
Place of birth for the foreign-born population - Nigeria (%)
Place of birth for the foreign-born population - Senegal (%)
Place of birth for the foreign-born population - Sierra Leone (%)
Place of birth for the foreign-born population - Other Western Africa (%)
Place of birth for the foreign-born population - Australia (%)
Place of birth for the foreign-born population - New Zealand (%)
Place of birth for the foreign-born population - Fiji (%)
Place of birth for the foreign-born population - Micronesia (%)
Place of birth for the foreign-born population - Bahamas (%)
Place of birth for the foreign-born population - Barbados (%)
Place of birth for the foreign-born population - Cuba (%)
Place of birth for the foreign-born population - Dominica (%)
Place of birth for the foreign-born population - Dominican Republic (%)
Place of birth for the foreign-born population - Grenada (%)
Place of birth for the foreign-born population - Haiti (%)
Place of birth for the foreign-born population - Jamaica (%)
Place of birth for the foreign-born population - St. Vincent and the Grenadines (%)
Place of birth for the foreign-born population - Trinidad and Tobago (%)
Place of birth for the foreign-born population - West Indies (%)
Place of birth for the foreign-born population - Other Caribbean (%)
Place of birth for the foreign-born population - Belize (%)
Place of birth for the foreign-born population - Costa Rica (%)
Place of birth for the foreign-born population - El Salvador (%)
Place of birth for the foreign-born population - Guatemala (%)
Place of birth for the foreign-born population - Honduras (%)
Place of birth for the foreign-born population - Mexico (%)
Place of birth for the foreign-born population - Nicaragua (%)
Place of birth for the foreign-born population - Panama (%)
Place of birth for the foreign-born population - Other Central America (%)
Place of birth for the foreign-born population - Argentina (%)
Place of birth for the foreign-born population - Bolivia (%)
Place of birth for the foreign-born population - Brazil (%)
Place of birth for the foreign-born population - Chile (%)
Place of birth for the foreign-born population - Colombia (%)
Place of birth for the foreign-born population - Ecuador (%)
Place of birth for the foreign-born population - Guyana (%)
Place of birth for the foreign-born population - Peru (%)
Place of birth for the foreign-born population - Uruguay (%)
Place of birth for the foreign-born population - Venezuela (%)
Place of birth for the foreign-born population - Other South America (%)
Place of birth for the foreign-born population - Canada (%)
Place of birth for the foreign-born population - Other Northern America (%)
Place of birth for the foreign-born population - Other (%)
Latest news about races in Manville, NJ collected exclusively by city-data.com from local newspapers, TV, and radio stations
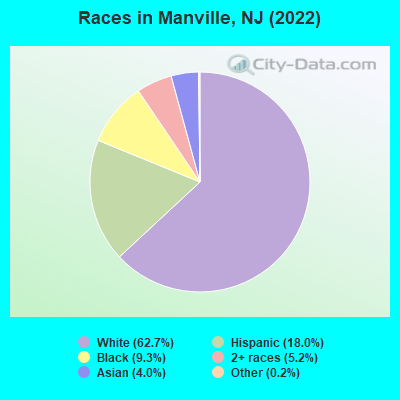
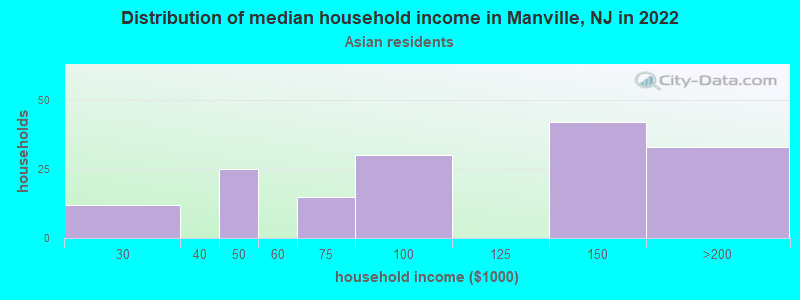
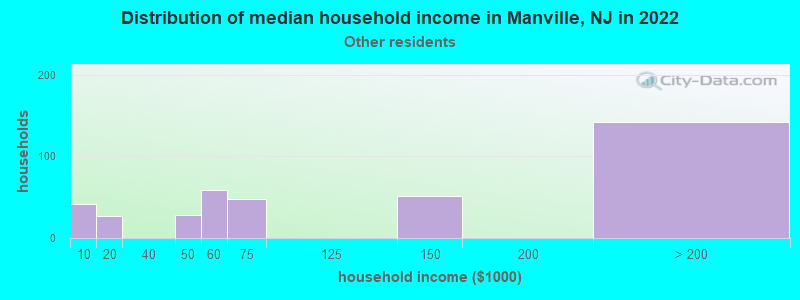
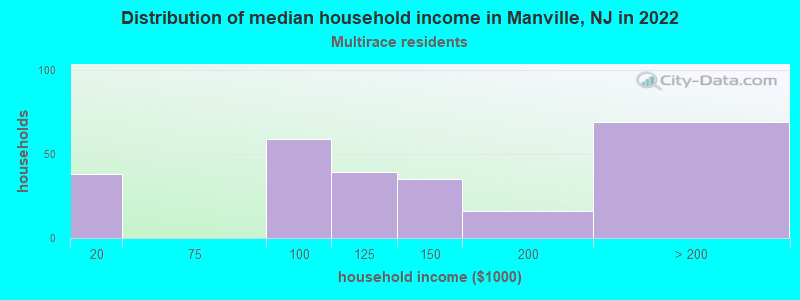
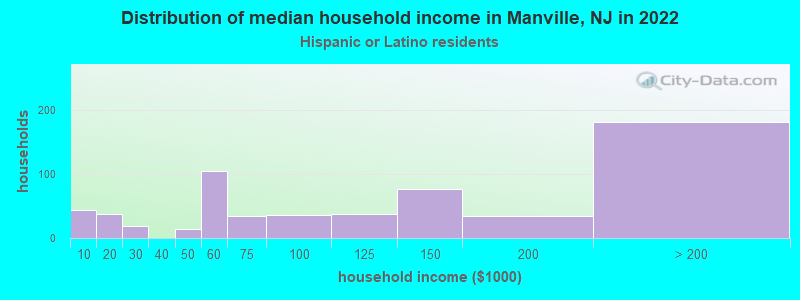
According to 2022 data, the most numerous races in Manville, NJ are White alone (6,863 residents), Hispanic (1,971 residents), and Black alone (1,014 residents). 75.6% of Manville residents speak English at home. 18.0% of Manville, NJ residents are foreign-born (8.0% born in Latin America, 5.5% born in Europe, 4.0% born in Asia), which is 28.1% less than the foreign-born rate of 23.0% across the entire state of New Jersey.
Race distribution in Manville
2000 2022
5,557,209 66.0% White alone 1,117,191 13.3% Hispanic 1,096,171 13.0% Black alone 477,012 5.7% Asian alone 133,689 1.6% Two or more races 19,565 0.2% Other race alone 11,338 0.1% American Indian alone 2,175 0.03% Native Hawaiian and Other
4,766,476 51.5% White alone 2,028,470 21.9% Hispanic 1,111,632 12.0% Black alone 923,546 10.0% Asian alone 332,237 3.6% Two or more races 89,847 1.0% Other race alone 8,557 0.09% American Indian alone 934 0.01% Native Hawaiian and Other
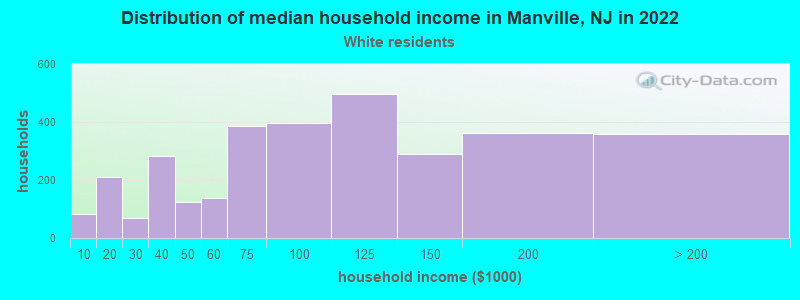
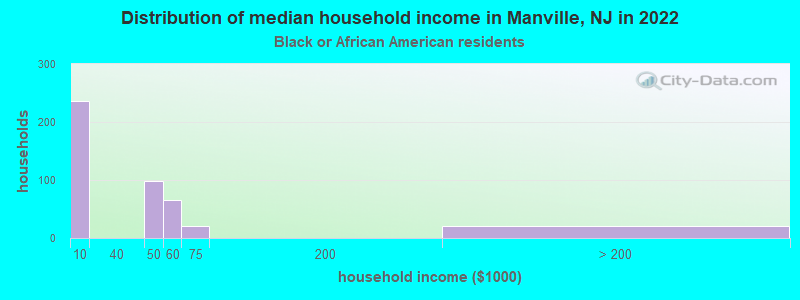
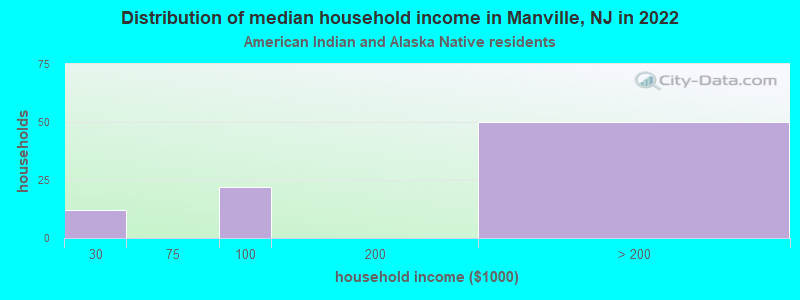
Income and house value in Manville Median household income in 2022 $85,442 White non-Hispanic householders$51,504 Black householdersover $200,000 American Indian and Alaska Native householders$120,445 Two or more races householders$115,394 Hispanic or Latino race householdersMedian 2022 house value $305,621 White Non-Hispanic householders $522,965 Asian householders$431,551 Two or more races householders$303,320 Hispanic or Latino householders
Median age by race in Manville
50.8 Median age for White residents48.8 53.7 20.8 Median age for Black or African American residents21.2 18.8 31.6 Median age for American Indian / Alaska Native residents34.0 57.3 42.3 Median age for Asian residents40.2 41.8 -804,177,544.9 Median age for Native Hawaiian / Pacific Islander residents-666,666,666.0 -713,070,378.3 34.7 Median age for Other race residents36.0 36.3 28.2 Median age for Two or more races residents17.9 37.6 51.6 Median age for White alone residents48.9 54.4 31.3 Median age for Hispanic or Latino residents31.0 31.7
Owner/renter occupied households by race in Manville
House owners and renters - White residents 2,781 87.1% Owner occupied414 12.9% Renter occupiedHouse owners and renters - Black or African American residents 12 4.0% Owner occupied283 96.0% Renter occupiedHouse owners and renters - American Indian / Alaska Native residents 12 10.1% Owner occupied110 89.9% Renter occupiedHouse owners and renters - Asian residents 114 76.0% Owner occupied36 24.0% Renter occupiedHouse owners and renters - Other race residents 260 67.7% Owner occupied124 32.3% Renter occupiedHouse owners and renters - Two or more races residents 245 76.8% Owner occupied74 23.2% Renter occupiedHouse owners and renters - White alone residents 2,753 86.1% Owner occupied445 13.9% Renter occupiedHouse owners and renters - Hispanic or Latino residents 426 66.6% Owner occupied214 33.4% Renter occupied
Language usage in Manville
English speakers - Total 75.6% of residents of Manville speak English at home.
12.2% of residents speak Spanish at home 764 59.8% Speak English very well514 40.2% Speak English less than very well11.5% of residents speak other language at home 826 69.0% Speak English very well371 31.0% Speak English less than very well
English speakers - Born in the United States 91.3% of residents of Manville speak English at home.
4.2% of residents speak Spanish at home 56 83.6% Speak English very well11 16.4% Speak English less than very well4.3% of residents speak other language at home 68 100.0% Speak English very well
English speakers - Native, born elsewhere 46.2% of residents of Manville speak English at home.
9.2% of residents speak Spanish at home 6 100.0% Speak English very well27.7% of residents speak other language at home 18 100.0% Speak English very well
English speakers - Foreign-born 10.0% of residents of Manville speak English at home.
37.1% of residents speak Spanish at home 245 34.8% Speak English very well460 65.2% Speak English less than very well50.3% of residents speak other language at home 582 61.0% Speak English very well372 39.0% Speak English less than very well
White (Caucasian) - Speak only English Native:
96.9% (5,997)Foreign-born:
1.1% (7)
White (Caucasian) - Speak another language Native:
3.2% (199)Foreign-born:
100.0% (599)
Black or African American - Speak another language Native:
8.3% (65)Foreign-born:
52.7% (18)
American Indian / Alaska Native - Speak another language Native:
33.3% (70)Foreign-born:
97.6% (65)
Asian - Speak only English Native:
88.2% (120)Foreign-born:
30.5% (92)
Other race - Speak only English Native:
25.5% (101)Foreign-born:
8.6% (53)
Other race - Speak another language Native:
70.7% (281)Foreign-born:
91.5% (562)
Two or more races - Speak only English Native:
75.8% (540)Foreign-born:
21.7% (57)
Two or more races - Speak another language Native:
24.1% (171)Foreign-born:
78.4% (207)
White alone - Speak only English Native:
96.2% (5,880)Foreign-born:
1.1% (7)
White alone - Speak another language Native:
3.1% (188)Foreign-born:
100.0% (607)
Hispanic or Latino - Speak only English Native:
52.1% (540)Foreign-born:
4.3% (33)
Hispanic or Latino - Speak another language Native:
47.6% (493)Foreign-born:
94.7% (737)
Foreign-born residents in Manville 1,966 residents are foreign born (8.0% Latin America , 5.5% Europe , 4.0% Asia ).
This city:
18.0%New Jersey:
23.2%
Marital status for residents in Manville Marital status - White (Caucasian) population 15 years and over
Males 33.8% Never married50.3% Now married2.1% Separated3.9% Widowed9.9% DivorcedFemales 28.7% Never married42.2% Now married1.8% Separated15.0% Widowed12.3% DivorcedWomen who gave birth in the past 12 months Now married:
70.0% (32)Unmarried:
30.0% (14)
Women who did not give birth in the past 12 months Now married:
37.8% (483)Unmarried:
62.2% (796)
Marital status - Black or African American population 15 years and over
Males 80.3% Never married15.0% Now married0.0% Separated4.7% Widowed0.0% DivorcedFemales 86.7% Never married13.3% Now married0.0% Separated0.0% Widowed0.0% DivorcedWomen who gave birth in the past 12 months Now married:
12.5% (11)Unmarried:
87.5% (77)
Women who did not give birth in the past 12 months Now married:
13.6% (30)Unmarried:
86.4% (191)
Marital status - American Indian / Alaska Native population 15 years and over
Males 19.6% Never married80.4% Now married0.0% Separated0.0% Widowed0.0% DivorcedFemales 42.4% Never married57.6% Now married0.0% Separated0.0% Widowed0.0% DivorcedWomen who did not give birth in the past 12 months Now married:
57.6% (117)Unmarried:
42.4% (86)
Marital status - Asian population 15 years and over
Males 41.1% Never married49.4% Now married0.0% Separated0.0% Widowed9.5% DivorcedFemales 15.7% Never married84.3% Now married0.0% Separated0.0% Widowed0.0% DivorcedWomen who did not give birth in the past 12 months Now married:
69.0% (49)Unmarried:
31.0% (22)
Marital status - Other race population 15 years and over
Males 55.4% Never married44.6% Now married0.0% Separated0.0% Widowed0.0% DivorcedFemales 34.6% Never married51.4% Now married0.0% Separated0.0% Widowed14.0% DivorcedWomen who did not give birth in the past 12 months Now married:
41.2% (115)Unmarried:
58.8% (164)
Marital status - Two or more races population 15 years and over
Males 50.6% Never married44.1% Now married5.3% Separated0.0% Widowed0.0% DivorcedFemales 19.2% Never married80.8% Now married0.0% Separated0.0% Widowed0.0% DivorcedWomen who gave birth in the past 12 months Now married:
100.0% (38)Unmarried:
0.0% (0)
Women who did not give birth in the past 12 months Now married:
74.2% (207)Unmarried:
25.8% (72)
Marital status - White alone, not Hispanic / Latino population 15 years and over
Males 32.7% Never married51.9% Now married2.2% Separated4.2% Widowed9.0% DivorcedFemales 28.5% Never married42.0% Now married1.9% Separated15.0% Widowed12.6% DivorcedWomen who gave birth in the past 12 months Now married:
100.0% (33)Unmarried:
0.0% (0)
Women who did not give birth in the past 12 months Now married:
37.2% (483)Unmarried:
62.8% (816)
Marital status - Hispanic or Latino population 15 years and over
Males 51.8% Never married39.3% Now married1.4% Separated0.0% Widowed7.5% DivorcedFemales 34.0% Never married57.7% Now married0.0% Separated2.2% Widowed6.2% DivorcedWomen who gave birth in the past 12 months Now married:
62.5% (26)Unmarried:
37.5% (16)
Women who did not give birth in the past 12 months Now married:
49.2% (245)Unmarried:
50.8% (253)
Ancestries in Manville
850 15.8% American791 14.7% Polish368 6.9% Italian224 4.2% Irish82 1.5% European75 1.4% Hungarian63 1.2% Slovak63 1.2% Ukrainian52 1.0% German43 0.8% Eastern European41 0.8% English38 0.7% Haitian31 0.6% Portuguese30 0.6% Lithuanian24 0.4% Russian19 0.4% French18 0.3% African13 0.2% Slavic12 0.2% Carpatho Rusyn10 0.2% Czechoslovakian9 0.2% Finnish7 0.1% Lebanese
Children Nativity (place of birth) in Manville
Children under 6 years - Living with two parents Both parents native 228 100.0% NativeBoth parents foreign-born 14 100.0% NativeOne native, one foreign-born parent 12 100.0% NativeChildren under 6 years - Living with one parent Native parent 231 100.0% NativeForeign-born parent 74 68.6% Native34 31.4% Foreign-bornChildren 6 to 17 years - Living with two parents Both parents native 506 100.0% Native0 0.0% Foreign-bornBoth parents foreign-born 192 100.0% NativeOne native, one foreign-born parent 193 94.1% Native12 5.9% Foreign-bornChildren 6 to 17 years - Living with one parent Native parent 242 100.0% NativeForeign-born parent 167 55.9% Native132 44.1% Foreign-born
Grandparents responsible for own grandchildren in Manville
Grandparents (30 to 59 years) White / Caucasian 2 100.0% Not responsible for grandchildrenOther race 33 100.0% Not responsible for grandchildrenWhite alone, not Hispanic / Latino 3 100.0% Not responsible for grandchildrenHispanic or Latino 25 100.0% Not responsible for grandchildrenGrandparents (60 years and over) White / Caucasian 81 100.0% Not responsible for grandchildrenOther race 20 19.2% Responsible for grandchildren84 80.8% Not responsible for grandchildrenWhite alone, not Hispanic / Latino 90 100.0% Not responsible for grandchildrenHispanic or Latino 15 17.4% Responsible for grandchildren71 82.6% Not responsible for grandchildren