Races in Manchester, Virginia (VA) Detailed Stats
Data:
Races - White alone (%)
Races - White alone (% change since 2000)
Races - Black alone (%)
Races - Black alone (% change since 2000)
Races - American Indian alone (%)
Races - American Indian alone (% change since 2000)
Races - Asian alone (%)
Races - Asian alone (% change since 2000)
Races - Hispanic (%)
Races - Hispanic (% change since 2000)
Races - Native Hawaiian and Other Pacific Islander alone (%)
Races - Native Hawaiian and Other Pacific Islander alone (% change since 2000)
Races - Two or more races(%)
Races - Two or more races(% change since 2000)
Races - Other race alone (%)
Races - Other race alone (% change since 2000)
Racial diversity
Place of birth - Born in state of residence (%)
Place of birth - Born in state of residence (%) - White
Place of birth - Born in state of residence (%) - Black or African American
Place of birth - Born in state of residence (%) - Asian
Place of birth - Born in state of residence (%) - Hispanic or Latino
Place of birth - Born in state of residence (%) - American Indian and Alaska Native
Place of birth - Born in state of residence (%) - Multirace
Place of birth - Born in state of residence (%) - Other Race
Place of birth - Born in other state (%)
Place of birth - Born in other state (%) - White
Place of birth - Born in other state (%) - Black or African American
Place of birth - Born in other state (%) - Asian
Place of birth - Born in other state (%) - Hispanic or Latino
Place of birth - Born in other state (%) - American Indian and Alaska Native
Place of birth - Born in other state (%) - Multirace
Place of birth - Born in other state (%) - Other Race
Place of birth - Native, outside of US (%)
Place of birth - Native, outside of US (%) - White
Place of birth - Native, outside of US (%) - Black or African American
Place of birth - Native, outside of US (%) - Asian
Place of birth - Native, outside of US (%) - Hispanic or Latino
Place of birth - Native, outside of US (%) - American Indian and Alaska Native
Place of birth - Native, outside of US (%) - Multirace
Place of birth - Native, outside of US (%) - Other Race
Place of birth - Foreign born (%)
Place of birth - Foreign born (%) - White
Place of birth - Foreign born (%) - Black or African American
Place of birth - Foreign born (%) - Asian
Place of birth - Foreign born (%) - Hispanic or Latino
Place of birth - Foreign born (%) - American Indian and Alaska Native
Place of birth - Foreign born (%) - Multirace
Place of birth - Foreign born (%) - Other Race
Residents speaking English at home (%)
Residents speaking English at home - Born in the United States (%)
Residents speaking English at home - Native, born elsewhere (%)
Residents speaking English at home - Foreign born (%)
Residents speaking Spanish at home (%)
Residents speaking Spanish at home - Born in the United States (%)
Residents speaking Spanish at home - Native, born elsewhere (%)
Residents speaking Spanish at home - Foreign born (%)
Residents speaking other language at home (%)
Residents speaking other language at home - Born in the United States (%)
Residents speaking other language at home - Native, born elsewhere (%)
Residents speaking other language at home - Foreign born (%)
Marital status - Never married (%)
Marital status - Now married (%)
Marital status - Separated (%)
Marital status - Widowed (%)
Marital status - Divorced (%)
Ancestries Reported - Arab (%)
Ancestries Reported - Czech (%)
Ancestries Reported - Danish (%)
Ancestries Reported - Dutch (%)
Ancestries Reported - English (%)
Ancestries Reported - French (%)
Ancestries Reported - French Canadian (%)
Ancestries Reported - German (%)
Ancestries Reported - Greek (%)
Ancestries Reported - Hungarian (%)
Ancestries Reported - Irish (%)
Ancestries Reported - Italian (%)
Ancestries Reported - Lithuanian (%)
Ancestries Reported - Norwegian (%)
Ancestries Reported - Polish (%)
Ancestries Reported - Portuguese (%)
Ancestries Reported - Russian (%)
Ancestries Reported - Scotch-Irish (%)
Ancestries Reported - Scottish (%)
Ancestries Reported - Slovak (%)
Ancestries Reported - Subsaharan African (%)
Ancestries Reported - Swedish (%)
Ancestries Reported - Swiss (%)
Ancestries Reported - Ukrainian (%)
Ancestries Reported - United States (%)
Ancestries Reported - Welsh (%)
Ancestries Reported - West Indian (%)
Ancestries Reported - Other (%)
Geographical mobility - Same house 1 year ago (%)
Geographical mobility - Same house 1 year ago (%) - White
Geographical mobility - Same house 1 year ago (%) - Black or African American
Geographical mobility - Same house 1 year ago (%) - Asian
Geographical mobility - Same house 1 year ago (%) - Hispanic or Latino
Geographical mobility - Same house 1 year ago (%) - American Indian and Alaska Native
Geographical mobility - Same house 1 year ago (%) - Multirace
Geographical mobility - Same house 1 year ago (%) - Other Race
Geographical mobility - Moved within same county (%)
Geographical mobility - Moved within same county (%) - White
Geographical mobility - Moved within same county (%) - Black or African American
Geographical mobility - Moved within same county (%) - Asian
Geographical mobility - Moved within same county (%) - Hispanic or Latino
Geographical mobility - Moved within same county (%) - American Indian and Alaska Native
Geographical mobility - Moved within same county (%) - Multirace
Geographical mobility - Moved within same county (%) - Other Race
Geographical mobility - Moved from different county within same state (%)
Geographical mobility - Moved from different county within same state (%) - White
Geographical mobility - Moved from different county within same state (%) - Black or African American
Geographical mobility - Moved from different county within same state (%) - Asian
Geographical mobility - Moved from different county within same state (%) - Hispanic or Latino
Geographical mobility - Moved from different county within same state (%) - American Indian and Alaska Native
Geographical mobility - Moved from different county within same state (%) - Multirace
Geographical mobility - Moved from different county within same state (%) - Other Race
Geographical mobility - Moved from different state (%)
Geographical mobility - Moved from different state (%) - White
Geographical mobility - Moved from different state (%) - Black or African American
Geographical mobility - Moved from different state (%) - Asian
Geographical mobility - Moved from different state (%) - Hispanic or Latino
Geographical mobility - Moved from different state (%) - American Indian and Alaska Native
Geographical mobility - Moved from different state (%) - Multirace
Geographical mobility - Moved from different state (%) - Other Race
Geographical mobility - Moved from abroad (%)
Geographical mobility - Moved from abroad (%) - White
Geographical mobility - Moved from abroad (%) - Black or African American
Geographical mobility - Moved from abroad (%) - Asian
Geographical mobility - Moved from abroad (%) - Hispanic or Latino
Geographical mobility - Moved from abroad (%) - American Indian and Alaska Native
Geographical mobility - Moved from abroad (%) - Multirace
Geographical mobility - Moved from abroad (%) - Other Race
Place of birth for the foreign-born population - Ireland (%)
Place of birth for the foreign-born population - Denmark (%)
Place of birth for the foreign-born population - Norway (%)
Place of birth for the foreign-born population - Sweden (%)
Place of birth for the foreign-born population - United Kingdom (%)
Place of birth for the foreign-born population - England (%)
Place of birth for the foreign-born population - Scotland (%)
Place of birth for the foreign-born population - Other Northern Europe (%)
Place of birth for the foreign-born population - Austria (%)
Place of birth for the foreign-born population - Belgium (%)
Place of birth for the foreign-born population - France (%)
Place of birth for the foreign-born population - Germany (%)
Place of birth for the foreign-born population - Netherlands (%)
Place of birth for the foreign-born population - Switzerland (%)
Place of birth for the foreign-born population - Other Western Europe (%)
Place of birth for the foreign-born population - Greece (%)
Place of birth for the foreign-born population - Italy (%)
Place of birth for the foreign-born population - Portugal (%)
Place of birth for the foreign-born population - Spain (%)
Place of birth for the foreign-born population - Other Southern Europe (%)
Place of birth for the foreign-born population - Albania (%)
Place of birth for the foreign-born population - Belarus (%)
Place of birth for the foreign-born population - Bosnia and Herzegovina (%)
Place of birth for the foreign-born population - Bulgaria (%)
Place of birth for the foreign-born population - Croatia (%)
Place of birth for the foreign-born population - Czechoslovakia (%)
Place of birth for the foreign-born population - Hungary (%)
Place of birth for the foreign-born population - Latvia (%)
Place of birth for the foreign-born population - Lithuania (%)
Place of birth for the foreign-born population - North Macedonia (Macedonia) (%)
Place of birth for the foreign-born population - Moldova (%)
Place of birth for the foreign-born population - Poland (%)
Place of birth for the foreign-born population - Romania (%)
Place of birth for the foreign-born population - Russia (%)
Place of birth for the foreign-born population - Serbia (%)
Place of birth for the foreign-born population - Ukraine (%)
Place of birth for the foreign-born population - Other Eastern Europe (%)
Place of birth for the foreign-born population - China (%)
Place of birth for the foreign-born population - Hong Kong (%)
Place of birth for the foreign-born population - Taiwan (%)
Place of birth for the foreign-born population - Japan (%)
Place of birth for the foreign-born population - Korea (%)
Place of birth for the foreign-born population - Other Eastern Asia (%)
Place of birth for the foreign-born population - Afghanistan (%)
Place of birth for the foreign-born population - Bangladesh (%)
Place of birth for the foreign-born population - India (%)
Place of birth for the foreign-born population - Iran (%)
Place of birth for the foreign-born population - Kazakhstan (%)
Place of birth for the foreign-born population - Nepal (%)
Place of birth for the foreign-born population - Pakistan (%)
Place of birth for the foreign-born population - Sri Lanka (%)
Place of birth for the foreign-born population - Uzbekistan (%)
Place of birth for the foreign-born population - Other South Central Asia (%)
Place of birth for the foreign-born population - Burma (%)
Place of birth for the foreign-born population - Cambodia (%)
Place of birth for the foreign-born population - Indonesia (%)
Place of birth for the foreign-born population - Laos (%)
Place of birth for the foreign-born population - Malaysia (%)
Place of birth for the foreign-born population - Philippines (%)
Place of birth for the foreign-born population - Singapore (%)
Place of birth for the foreign-born population - Thailand (%)
Place of birth for the foreign-born population - Vietnam (%)
Place of birth for the foreign-born population - Other South Eastern Asia (%)
Place of birth for the foreign-born population - Armenia (%)
Place of birth for the foreign-born population - Iraq (%)
Place of birth for the foreign-born population - Israel (%)
Place of birth for the foreign-born population - Jordan (%)
Place of birth for the foreign-born population - Kuwait (%)
Place of birth for the foreign-born population - Lebanon (%)
Place of birth for the foreign-born population - Saudi Arabia (%)
Place of birth for the foreign-born population - Syria (%)
Place of birth for the foreign-born population - Turkey (%)
Place of birth for the foreign-born population - Yemen (%)
Place of birth for the foreign-born population - Other Western Asia (%)
Place of birth for the foreign-born population - Eritrea (%)
Place of birth for the foreign-born population - Ethiopia (%)
Place of birth for the foreign-born population - Kenya (%)
Place of birth for the foreign-born population - Somalia (%)
Place of birth for the foreign-born population - Uganda (%)
Place of birth for the foreign-born population - Zimbabwe (%)
Place of birth for the foreign-born population - Other Eastern Africa (%)
Place of birth for the foreign-born population - Cameroon (%)
Place of birth for the foreign-born population - Congo (%)
Place of birth for the foreign-born population - Democratic Republic of Congo (Zaire) (%)
Place of birth for the foreign-born population - Other Middle Africa (%)
Place of birth for the foreign-born population - Egypt (%)
Place of birth for the foreign-born population - Morocco (%)
Place of birth for the foreign-born population - Sudan (%)
Place of birth for the foreign-born population - Other Northern Africa (%)
Place of birth for the foreign-born population - South Africa (%)
Place of birth for the foreign-born population - Other Southern Africa (%)
Place of birth for the foreign-born population - Cabo Verde (%)
Place of birth for the foreign-born population - Ghana (%)
Place of birth for the foreign-born population - Liberia (%)
Place of birth for the foreign-born population - Nigeria (%)
Place of birth for the foreign-born population - Senegal (%)
Place of birth for the foreign-born population - Sierra Leone (%)
Place of birth for the foreign-born population - Other Western Africa (%)
Place of birth for the foreign-born population - Australia (%)
Place of birth for the foreign-born population - New Zealand (%)
Place of birth for the foreign-born population - Fiji (%)
Place of birth for the foreign-born population - Micronesia (%)
Place of birth for the foreign-born population - Bahamas (%)
Place of birth for the foreign-born population - Barbados (%)
Place of birth for the foreign-born population - Cuba (%)
Place of birth for the foreign-born population - Dominica (%)
Place of birth for the foreign-born population - Dominican Republic (%)
Place of birth for the foreign-born population - Grenada (%)
Place of birth for the foreign-born population - Haiti (%)
Place of birth for the foreign-born population - Jamaica (%)
Place of birth for the foreign-born population - St. Vincent and the Grenadines (%)
Place of birth for the foreign-born population - Trinidad and Tobago (%)
Place of birth for the foreign-born population - West Indies (%)
Place of birth for the foreign-born population - Other Caribbean (%)
Place of birth for the foreign-born population - Belize (%)
Place of birth for the foreign-born population - Costa Rica (%)
Place of birth for the foreign-born population - El Salvador (%)
Place of birth for the foreign-born population - Guatemala (%)
Place of birth for the foreign-born population - Honduras (%)
Place of birth for the foreign-born population - Mexico (%)
Place of birth for the foreign-born population - Nicaragua (%)
Place of birth for the foreign-born population - Panama (%)
Place of birth for the foreign-born population - Other Central America (%)
Place of birth for the foreign-born population - Argentina (%)
Place of birth for the foreign-born population - Bolivia (%)
Place of birth for the foreign-born population - Brazil (%)
Place of birth for the foreign-born population - Chile (%)
Place of birth for the foreign-born population - Colombia (%)
Place of birth for the foreign-born population - Ecuador (%)
Place of birth for the foreign-born population - Guyana (%)
Place of birth for the foreign-born population - Peru (%)
Place of birth for the foreign-born population - Uruguay (%)
Place of birth for the foreign-born population - Venezuela (%)
Place of birth for the foreign-born population - Other South America (%)
Place of birth for the foreign-born population - Canada (%)
Place of birth for the foreign-born population - Other Northern America (%)
Place of birth for the foreign-born population - Other (%)
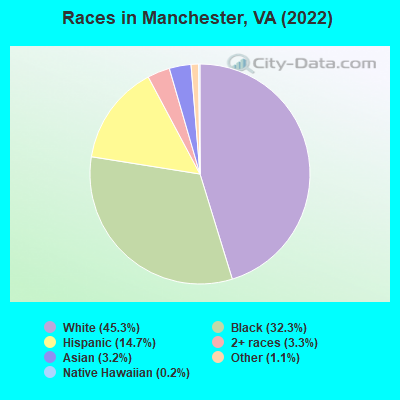
According to 2022 data, the most numerous races in Manchester, VA are White alone (5,445 residents), Black alone (3,883 residents), and Hispanic (1,760 residents). 78.7% of Manchester residents speak English at home.
Race distribution in Manchester 5,445 45.3% White alone 3,883 32.3% Black alone 1,760 14.7% Hispanic 401 3.3% Two or more races 382 3.2% Asian alone 132 1.1% Other race alone 21 0.2% Native Hawaiian and Other 5 0.04% American Indian alone
2000 2022
4,965,637 70.2% White alone 1,376,378 19.4% Black alone 329,540 4.7% Hispanic 259,277 3.7% Asian alone 114,022 1.6% Two or more races 18,596 0.3% American Indian alone 11,685 0.2% Other race alone 3,380 0.05% Native Hawaiian and Other
5,095,130 58.7% White alone 1,594,785 18.4% Black alone 905,750 10.4% Hispanic 602,881 6.9% Asian alone 406,047 4.7% Two or more races 60,419 0.7% Other race alone 11,738 0.1% American Indian alone 6,869 0.08% Native Hawaiian and Other
Income and house value in Manchester Median household income in 2022 $79,229 White non-Hispanic householders$62,937 Black householders$102,786 Asian householders$49,526 Some other race householders$63,666 Two or more races householders$49,646 Hispanic or Latino race householders
Median age by race in Manchester
35.6 Median age for White residents35.3 35.7 35.0 Median age for Black or African American residents26.1 37.6 -682,215,742.8 Median age for American Indian / Alaska Native residents-682,352,940.5 -687,861,271.0 36.3 Median age for Asian residents32.2 47.1 -611,955,419.9 Median age for Native Hawaiian / Pacific Islander residents-541,531,822.5 -714,150,046.8 15.5 Median age for Other race residents15.1 17.8 31.7 Median age for Two or more races residents32.0 27.6 37.2 Median age for White alone residents36.6 39.5 20.3 Median age for Hispanic or Latino residents14.4 20.8
Owner/renter occupied households by race in Manchester
House owners and renters - White residents 1,975 68.9% Owner occupied892 31.1% Renter occupiedHouse owners and renters - Black or African American residents 758 45.8% Owner occupied897 54.2% Renter occupiedHouse owners and renters - Asian residents 70 63.9% Owner occupied40 36.1% Renter occupiedHouse owners and renters - Native Hawaiian / Pacific Islander residents 11 100.0% Owner occupiedHouse owners and renters - Other race residents 27 15.3% Owner occupied148 84.7% Renter occupiedHouse owners and renters - Two or more races residents 106 50.5% Owner occupied104 49.5% Renter occupiedHouse owners and renters - White alone residents 1,977 72.4% Owner occupied752 27.6% Renter occupiedHouse owners and renters - Hispanic or Latino residents 67 15.5% Owner occupied367 84.5% Renter occupied
Language usage in Manchester
English speakers - Total 78.7% of residents of Manchester speak English at home.
15.5% of residents speak Spanish at home 1,033 58.9% Speak English very well720 41.1% Speak English less than very well5.7% of residents speak other language at home 371 57.9% Speak English very well270 42.1% Speak English less than very well
English speakers - Born in the United States 93.5% of residents of Manchester speak English at home.
5.9% of residents speak Spanish at home 138 68.7% Speak English very well63 31.3% Speak English less than very well0.8% of residents speak other language at home 28 100.0% Speak English very well
English speakers - Native, born elsewhere 51.9% of residents of Manchester speak English at home.
44.4% of residents speak Spanish at home 40 41.7% Speak English very well56 58.3% Speak English less than very well
English speakers - Foreign-born 14.6% of residents of Manchester speak English at home.
51.9% of residents speak Spanish at home 138 20.7% Speak English very well530 79.3% Speak English less than very well31.9% of residents speak other language at home 179 43.7% Speak English very well231 56.3% Speak English less than very well
White (Caucasian) - Speak only English Native:
83.5% (4,504)Foreign-born:
8.6% (36)
White (Caucasian) - Speak another language Native:
13.3% (716)Foreign-born:
86.7% (362)
Black or African American - Speak only English Native:
96.1% (3,552)Foreign-born:
55.1% (103)
Black or African American - Speak another language Native:
4.0% (146)Foreign-born:
39.8% (75)
Asian - Speak only English Native:
66.2% (95)Foreign-born:
11.8% (26)
Asian - Speak another language Native:
31.1% (44)Foreign-born:
88.0% (197)
Other race - Speak another language Native:
42.0% (101)Foreign-born:
98.4% (291)
Two or more races - Speak only English Native:
82.0% (389)Foreign-born:
28.9% (15)
Two or more races - Speak another language Native:
17.6% (83)Foreign-born:
70.0% (37)
White alone - Speak only English Native:
87.4% (4,456)Foreign-born:
19.1% (38)
White alone - Speak another language Native:
12.2% (623)Foreign-born:
82.2% (164)
Hispanic or Latino - Speak another language Native:
73.4% (486)Foreign-born:
99.6% (681)
Foreign-born residents in Manchester
Marital status for residents in Manchester Marital status - White (Caucasian) population 15 years and over
Males 34.4% Never married50.6% Now married0.8% Separated3.3% Widowed10.9% DivorcedFemales 25.4% Never married49.0% Now married0.3% Separated13.5% Widowed11.9% DivorcedWomen who gave birth in the past 12 months Now married:
60.2% (58)Unmarried:
39.8% (39)
Women who did not give birth in the past 12 months Now married:
52.0% (635)Unmarried:
48.0% (586)
Marital status - Black or African American population 15 years and over
Males 55.0% Never married33.1% Now married3.9% Separated0.0% Widowed8.1% DivorcedFemales 49.1% Never married22.5% Now married3.0% Separated7.3% Widowed18.1% DivorcedWomen who gave birth in the past 12 months Now married:
84.4% (38)Unmarried:
15.6% (7)
Women who did not give birth in the past 12 months Now married:
24.0% (290)Unmarried:
76.0% (920)
Marital status - Asian population 15 years and over
Males 51.9% Never married48.1% Now married0.0% Separated0.0% Widowed0.0% DivorcedFemales 18.1% Never married55.7% Now married0.0% Separated19.5% Widowed6.7% DivorcedWomen who gave birth in the past 12 months Now married:
100.0% (18)Unmarried:
0.0% (0)
Women who did not give birth in the past 12 months Now married:
53.2% (44)Unmarried:
46.8% (38)
Marital status - Other race population 15 years and over
Males 14.8% Never married85.2% Now married0.0% Separated0.0% Widowed0.0% DivorcedFemales 34.1% Never married40.6% Now married0.0% Separated0.0% Widowed25.4% DivorcedWomen who did not give birth in the past 12 months Now married:
42.4% (74)Unmarried:
57.6% (100)
Marital status - Two or more races population 15 years and over
Males 39.4% Never married57.5% Now married0.0% Separated0.0% Widowed3.1% DivorcedFemales 51.9% Never married40.9% Now married0.0% Separated7.1% Widowed0.0% DivorcedWomen who did not give birth in the past 12 months Now married:
48.1% (86)Unmarried:
51.9% (93)
Marital status - White alone, not Hispanic / Latino population 15 years and over
Males 36.2% Never married47.3% Now married0.9% Separated3.6% Widowed12.0% DivorcedFemales 22.7% Never married48.2% Now married0.4% Separated15.1% Widowed13.5% DivorcedWomen who gave birth in the past 12 months Now married:
63.3% (61)Unmarried:
36.7% (35)
Women who did not give birth in the past 12 months Now married:
52.3% (546)Unmarried:
47.7% (498)
Marital status - Hispanic or Latino population 15 years and over
Males 14.5% Never married85.5% Now married0.0% Separated0.0% Widowed0.0% DivorcedFemales 41.3% Never married53.1% Now married0.0% Separated0.9% Widowed4.7% DivorcedWomen who gave birth in the past 12 months Now married:
0.0% (0)Unmarried:
100.0% (5)
Women who did not give birth in the past 12 months Now married:
51.8% (245)Unmarried:
48.2% (228)
Ancestries in Manchester
370 5.4% English290 4.2% German226 3.3% American182 2.7% Italian157 2.3% Irish139 2.0% Dutch104 1.5% South African77 1.1% Scotch-Irish65 0.9% European57 0.8% Jordanian55 0.8% Welsh51 0.7% African42 0.6% Egyptian41 0.6% Canadian41 0.6% Swedish31 0.5% Jamaican28 0.4% Sudanese26 0.4% Israeli20 0.3% Armenian19 0.3% West Indian19 0.3% British18 0.3% French17 0.2% Polish16 0.2% Scottish14 0.2% Ghanaian14 0.2% Czechoslovakian14 0.2% Ukrainian13 0.2% Norwegian11 0.2% Northern European10 0.1% British West Indian7 0.1% Lithuanian5 0.07% Arab4 0.06% Slovak1 0.01% Ethiopian
Children Nativity (place of birth) in Manchester
Children under 6 years - Living with two parents Both parents native 228 100.0% NativeBoth parents foreign-born 34 100.0% NativeOne native, one foreign-born parent 249 100.0% NativeChildren under 6 years - Living with one parent Native parent 306 100.0% NativeForeign-born parent 116 100.0% NativeChildren 6 to 17 years - Living with two parents Both parents native 1,129 99.8% Native2 0.2% Foreign-bornBoth parents foreign-born 57 100.0% NativeOne native, one foreign-born parent 39 77.8% Native11 22.2% Foreign-bornChildren 6 to 17 years - Living with one parent Native parent 369 100.0% NativeForeign-born parent 199 55.3% Native161 44.7% Foreign-born
Grandparents responsible for own grandchildren in Manchester
Grandparents (30 to 59 years) White / Caucasian 5 7.2% Responsible for grandchildren59 92.8% Not responsible for grandchildrenBlack or African American 118 61.2% Responsible for grandchildren75 38.8% Not responsible for grandchildrenOther race 59 100.0% Responsible for grandchildrenWhite alone, not Hispanic / Latino 5 21.5% Responsible for grandchildren17 78.5% Not responsible for grandchildrenHispanic or Latino 49 100.0% Not responsible for grandchildren
Grandparents (60 years and over) White / Caucasian 17 100.0% Not responsible for grandchildrenBlack or African American 7 100.0% Responsible for grandchildrenWhite alone, not Hispanic / Latino 18 100.0% Not responsible for grandchildren