Races in Macon, Georgia (GA) Detailed Stats
Latest news about races in Macon, GA collected exclusively by city-data.com from local newspapers, TV, and radio stations
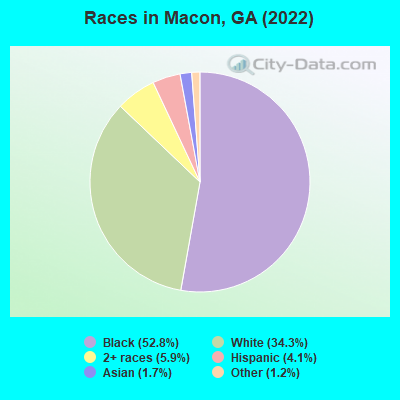
According to 2022 data, the most numerous races in Macon, GA are White alone (53,514 residents), Black alone (82,470 residents), and Hispanic (6,471 residents). 94.7% of Macon residents speak English at home. 3.1% of Macon, GA residents are foreign-born (1.4% born in Asia, 1.0% born in Latin America), which is 224.1% less than the foreign-born rate of 10.0% across the entire state of Georgia.
Race distribution in Macon 82,470 52.8% Black alone 53,514 34.3% White alone 9,184 5.9% Two or more races 6,471 4.1% Hispanic 2,601 1.7% Asian alone 1,893 1.2% Other race alone 64 0.04% American Indian alone
2000 2022
5,128,661 62.6% White alone 2,331,465 28.5% Black alone 435,227 5.3% Hispanic 171,513 2.1% Asian alone 87,364 1.1% Two or more races 17,670 0.2% American Indian alone 11,275 0.1% Other race alone 3,278 0.04% Native Hawaiian and Other
5,415,657 49.6% White alone 3,349,240 30.7% Black alone 1,132,604 10.4% Hispanic 479,156 4.4% Asian alone 462,923 4.2% Two or more races 54,416 0.5% Other race alone 11,923 0.1% American Indian alone 6,957 0.06% Native Hawaiian and Other
Income and house value in Macon Median household income in 2022 $70,820 White non-Hispanic householders$34,781 Black householders$53,239 Asian householders$51,284 Some other race householders$31,535 Two or more races householders$55,435 Hispanic or Latino race householders
Median age by race in Macon
47.1 Median age for White residents44.7 49.7 34.3 Median age for Black or African American residents31.0 36.6 70.7 Median age for American Indian / Alaska Native residents-666,666,666.0 -666,666,666.0 42.3 Median age for Asian residents42.8 40.7 -666,666,666.0 Median age for Native Hawaiian / Pacific Islander residents-666,666,666.0 -666,666,666.0 23.0 Median age for Other race residents28.8 15.5 20.2 Median age for Two or more races residents20.7 20.2 47.1 Median age for White alone residents44.8 50.1 28.7 Median age for Hispanic or Latino residents24.4 29.6
Owner/renter occupied households by race in Macon
House owners and renters - White residents 15,859 67.2% Owner occupied7,755 32.8% Renter occupiedHouse owners and renters - Black or African American residents 13,556 42.8% Owner occupied18,124 57.2% Renter occupiedHouse owners and renters - American Indian / Alaska Native residents 31 100.0% Owner occupiedHouse owners and renters - Asian residents 1,414 69.4% Owner occupied622 30.6% Renter occupiedHouse owners and renters - Native Hawaiian / Pacific Islander residents 30 100.0% Owner occupiedHouse owners and renters - Other race residents 244 22.0% Owner occupied867 78.0% Renter occupiedHouse owners and renters - Two or more races residents 1,256 34.9% Owner occupied2,341 65.1% Renter occupiedHouse owners and renters - White alone residents 15,705 68.2% Owner occupied7,319 31.8% Renter occupiedHouse owners and renters - Hispanic or Latino residents 568 27.4% Owner occupied1,506 72.6% Renter occupied
Language usage in Macon
English speakers - Total 94.7% of residents of Macon speak English at home.
2.9% of residents speak Spanish at home 2,516 58.5% Speak English very well1,783 41.5% Speak English less than very well2.4% of residents speak other language at home 2,316 66.4% Speak English very well1,170 33.6% Speak English less than very well
English speakers - Born in the United States 94.4% of residents of Macon speak English at home.
3.8% of residents speak Spanish at home 1,210 100.0% Speak English very well1.8% of residents speak other language at home 555 100.0% Speak English very well
All residents speak only English at home
English speakers - Foreign-born 20.7% of residents of Macon speak English at home.
40.6% of residents speak Spanish at home 200 11.0% Speak English very well1,618 89.0% Speak English less than very well38.6% of residents speak other language at home 824 47.7% Speak English very well905 52.3% Speak English less than very well
White (Caucasian) - Speak only English Native:
98.7% (50,434)Foreign-born:
16.4% (191)
White (Caucasian) - Speak another language Native:
1.3% (671)Foreign-born:
83.6% (975)
Black or African American - Speak only English Native:
98.4% (76,957)Foreign-born:
68.5% (370)
Black or African American - Speak another language Native:
1.5% (1,155)Foreign-born:
30.5% (165)
American Indian / Alaska Native - Speak another language Native:
6.1% (14)Foreign-born:
100.0% (2)
Asian - Speak only English Native:
43.6% (568)Foreign-born:
13.0% (274)
Asian - Speak another language Native:
56.5% (736)Foreign-born:
86.7% (1,821)
Other race - Speak only English Native:
55.6% (1,375)Foreign-born:
4.8% (49)
Other race - Speak another language Native:
42.3% (1,044)Foreign-born:
94.9% (958)
Two or more races - Speak only English Native:
87.7% (6,783)Foreign-born:
26.7% (116)
Two or more races - Speak another language Native:
12.6% (977)Foreign-born:
73.9% (320)
White alone - Speak only English Native:
99.4% (50,332)Foreign-born:
37.9% (191)
White alone - Speak another language Native:
0.6% (279)Foreign-born:
62.1% (313)
Hispanic or Latino - Speak only English Native:
54.8% (2,249)Foreign-born:
3.4% (49)
Hispanic or Latino - Speak another language Native:
46.2% (1,897)Foreign-born:
96.5% (1,396)
Foreign-born residents in Macon 4,819 residents are foreign born (1.4% Asia , 1.0% Latin America ).
This city:
3.1%Georgia:
10.4%
Marital status for residents in Macon Marital status - White (Caucasian) population 15 years and over
Males 29.2% Never married52.6% Now married0.4% Separated1.2% Widowed16.7% DivorcedFemales 23.3% Never married51.5% Now married1.7% Separated13.6% Widowed9.9% DivorcedWomen who gave birth in the past 12 months Now married:
83.4% (487)Unmarried:
16.6% (97)
Women who did not give birth in the past 12 months Now married:
45.5% (4,786)Unmarried:
54.5% (5,742)
Marital status - Black or African American population 15 years and over
Males 51.7% Never married30.3% Now married3.1% Separated6.1% Widowed8.8% DivorcedFemales 49.8% Never married19.0% Now married3.0% Separated10.1% Widowed18.2% DivorcedWomen who gave birth in the past 12 months Now married:
23.3% (361)Unmarried:
76.7% (1,188)
Women who did not give birth in the past 12 months Now married:
18.1% (3,620)Unmarried:
81.9% (16,405)
Marital status - American Indian / Alaska Native population 15 years and over
Males 11.6% Never married88.4% Now married0.0% Separated0.0% Widowed0.0% DivorcedFemales 62.7% Never married16.0% Now married0.0% Separated9.3% Widowed12.0% DivorcedWomen who did not give birth in the past 12 months Now married:
0.0% (0)Unmarried:
100.0% (74)
Marital status - Asian population 15 years and over
Males 37.6% Never married52.1% Now married0.4% Separated0.1% Widowed9.7% DivorcedFemales 30.3% Never married54.4% Now married0.0% Separated9.3% Widowed6.0% DivorcedWomen who gave birth in the past 12 months Now married:
52.6% (10)Unmarried:
47.4% (9)
Women who did not give birth in the past 12 months Now married:
44.3% (414)Unmarried:
55.7% (521)
Marital status - Native Hawaiian / Pacific Islander population 15 years and over
Males 0.0% Never married0.0% Now married0.0% Separated100.0% Widowed0.0% DivorcedFemales 0.0% Never married33.3% Now married0.0% Separated0.0% Widowed66.7% DivorcedMarital status - Other race population 15 years and over
Males 54.0% Never married44.4% Now married0.0% Separated1.6% Widowed0.0% DivorcedFemales 45.3% Never married41.8% Now married2.3% Separated2.8% Widowed7.8% DivorcedWomen who gave birth in the past 12 months Now married:
90.3% (109)Unmarried:
9.7% (12)
Women who did not give birth in the past 12 months Now married:
27.6% (202)Unmarried:
72.4% (532)
Marital status - Two or more races population 15 years and over
Males 48.6% Never married45.7% Now married0.9% Separated1.2% Widowed3.5% DivorcedFemales 52.6% Never married29.4% Now married2.1% Separated11.3% Widowed4.6% DivorcedWomen who gave birth in the past 12 months Now married:
45.0% (87)Unmarried:
55.0% (107)
Women who did not give birth in the past 12 months Now married:
26.8% (739)Unmarried:
73.2% (2,022)
Marital status - White alone, not Hispanic / Latino population 15 years and over
Males 29.2% Never married52.1% Now married0.4% Separated1.2% Widowed17.1% DivorcedFemales 23.4% Never married51.0% Now married1.7% Separated13.8% Widowed10.1% DivorcedWomen who gave birth in the past 12 months Now married:
83.4% (487)Unmarried:
16.6% (97)
Women who did not give birth in the past 12 months Now married:
43.9% (4,458)Unmarried:
56.1% (5,690)
Marital status - Hispanic or Latino population 15 years and over
Males 45.7% Never married52.1% Now married0.4% Separated0.8% Widowed0.9% DivorcedFemales 39.4% Never married42.5% Now married1.6% Separated8.7% Widowed7.8% DivorcedWomen who gave birth in the past 12 months Now married:
80.0% (39)Unmarried:
20.0% (10)
Women who did not give birth in the past 12 months Now married:
41.8% (577)Unmarried:
58.2% (803)
Ancestries in Macon
10,071 12.1% American6,732 8.1% English2,563 3.1% Irish1,921 2.3% German1,302 1.6% African947 1.1% European926 1.1% Scottish710 0.9% Scotch-Irish543 0.7% French517 0.6% Italian357 0.4% Haitian330 0.4% Jamaican259 0.3% British207 0.2% Nigerian203 0.2% Polish130 0.2% Trinidadian and Tobagonian120 0.1% Norwegian103 0.1% Eastern European95 0.1% West Indian87 0.1% Greek82 0.10% French Canadian80 0.10% U.S. Virgin Islander71 0.09% Czech69 0.08% Arab61 0.07% Northern European57 0.07% South African55 0.07% Ghanaian53 0.06% Hungarian51 0.06% Finnish50 0.06% Lebanese48 0.06% Ethiopian48 0.06% Welsh43 0.05% Swedish41 0.05% Iranian35 0.04% Austrian32 0.04% Belgian29 0.03% Portuguese26 0.03% Slavic22 0.03% Senegalese21 0.03% Canadian20 0.02% Barbadian19 0.02% British West Indian18 0.02% Icelander15 0.02% Pennsylvania German15 0.02% Russian13 0.02% Guyanese13 0.02% Swiss13 0.02% Bahamian11 0.01% Danish8 0.01% Celtic8 0.01% Dutch8 0.01% Romanian8 0.01% Brazilian8 0.01% Scandinavian7 0.01% Ukrainian5 0.01% Armenian
Geographical mobility in Macon Same house 1 year ago 46,128 85.4% White (Caucasian)69,006 83.7% Black or African American95 31.3% American Indian / Alaska Native3,068 86.1% Asian49 100.0% Native Hawaiian / Pacific Islander2,742 71.8% Other race6,516 64.6% Two or more races45,185 85.7% White alone, not Hispanic / Latino4,502 75.8% Hispanic or LatinoMoved within same county 3,511 6.5% White / Caucasian7,440 9.0% Black or African American17 5.5% American Indian / Alaska Native85 2.4% Asian490 12.8% Other race2,346 23.2% Two or more races3,511 6.7% White alone, not Hispanic / Latino553 9.3% Hispanic or LatinoMoved within same state 1,898 3.5% White / Caucasian4,392 5.3% Black or African American324 9.1% Asian502 13.2% Other race644 6.4% Two or more races1,898 3.6% White alone, not Hispanic / Latino296 5.0% Hispanic or LatinoMoved from different state 2,360 4.4% White / Caucasian1,652 2.0% Black or African American200 65.8% American Indian / Alaska Native77 2.2% Asian77 2.0% Other race501 5.0% Two or more races1,986 3.8% White alone, not Hispanic / Latino409 6.9% Hispanic or LatinoMoved from abroad 122 0.2% White10 0.3% Asian66 1.7% Other race84 0.8% Two or more races122 0.2% White alone, not Hispanic / Latino174 2.9% Hispanic or Latino
Children Nativity (place of birth) in Macon
Children under 6 years - Living with two parents Both parents native 3,486 100.0% NativeBoth parents foreign-born 277 100.0% NativeOne native, one foreign-born parent 259 100.0% NativeChildren under 6 years - Living with one parent Native parent 6,357 100.0% NativeForeign-born parent 168 100.0% NativeChildren 6 to 17 years - Living with two parents Both parents native 9,281 99.8% Native20 0.2% Foreign-bornBoth parents foreign-born 1,019 92.5% Native83 7.5% Foreign-bornOne native, one foreign-born parent 318 100.0% NativeChildren 6 to 17 years - Living with one parent Native parent 12,957 100.0% NativeForeign-born parent 188 50.9% Native181 49.1% Foreign-born
Grandparents responsible for own grandchildren in Macon
Grandparents (30 to 59 years) White / Caucasian 59 46.2% Responsible for grandchildren69 53.8% Not responsible for grandchildrenBlack or African American 491 55.9% Responsible for grandchildren388 44.1% Not responsible for grandchildrenAsian 15 100.0% Responsible for grandchildrenOther race 38 100.0% Responsible for grandchildrenTwo or more races 21 100.0% Responsible for grandchildrenWhite alone, not Hispanic / Latino 60 45.2% Responsible for grandchildren73 54.8% Not responsible for grandchildrenHispanic or Latino 9 100.0% Responsible for grandchildrenGrandparents (60 years and over) White / Caucasian 386 73.7% Responsible for grandchildren137 26.3% Not responsible for grandchildrenBlack or African American 315 21.2% Responsible for grandchildren1,171 78.8% Not responsible for grandchildrenAsian 72 72.5% Responsible for grandchildren27 27.5% Not responsible for grandchildrenOther race 57 100.0% Responsible for grandchildrenTwo or more races 19 100.0% Responsible for grandchildrenWhite alone, not Hispanic / Latino 388 72.8% Responsible for grandchildren145 27.2% Not responsible for grandchildren