Races in Lynchburg, Tennessee (TN) Detailed Stats
Latest news about races in Lynchburg, TN collected exclusively by city-data.com from local newspapers, TV, and radio stations
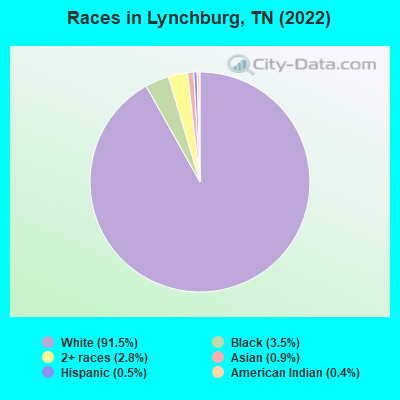
According to 2022 data, the most numerous races in Lynchburg, TN are White alone (6,109 residents), Black alone (234 residents), and Hispanic (33 residents). 98.5% of Lynchburg residents speak English at home. 2.6% of Lynchburg, TN residents are foreign-born (1.0% born in Europe, 0.9% born in Asia, 0.5% born in Latin America), which is 93.0% less than the foreign-born rate of 5.0% across the entire state of Tennessee.
Race distribution in Lynchburg
2000 2022
4,505,930 79.2% White alone 928,204 16.3% Black alone 123,838 2.2% Hispanic 54,824 1.0% Two or more races 56,077 1.0% Asian alone 13,820 0.2% American Indian alone 4,780 0.08% Other race alone 1,810 0.03% Native Hawaiian and Other
5,070,026 71.9% White alone 1,089,738 15.5% Black alone 442,629 6.3% Hispanic 279,381 4.0% Two or more races 131,817 1.9% Asian alone 26,972 0.4% Other race alone 6,387 0.09% American Indian alone 4,389 0.06% Native Hawaiian and Other
Income and house value in Lynchburg Median household income in 2022 $72,957 White non-Hispanic householders$28,180 Black householders$56,569 Two or more races householdersMedian 2022 house value $303,748 White Non-Hispanic householders$570,626 Black or African American householders$174,172 Two or more races householders
Median age by race in Lynchburg
46.7 Median age for White residents45.3 47.2 43.3 Median age for Black or African American residents43.7 17.2 54.1 Median age for American Indian / Alaska Native residents50.3 -801,477,376.9 -685,288,639.9 Median age for Asian residents-662,846,226.7 -686,648,500.7 -885,813,147.9 Median age for Native Hawaiian / Pacific Islander residents-951,707,890.7 -735,930,735.2 37.2 Median age for Other race residents35.4 -745,428,972.5 70.2 Median age for Two or more races residents73.4 69.5 46.1 Median age for White alone residents45.0 46.9 36.6 Median age for Hispanic or Latino residents36.3 -677,824,267.1
Owner/renter occupied households by race in Lynchburg
House owners and renters - White residents 2,106 84.1% Owner occupied399 15.9% Renter occupiedHouse owners and renters - Black or African American residents 45 100.0% Owner occupiedHouse owners and renters - American Indian / Alaska Native residents 8 100.0% Owner occupiedHouse owners and renters - Other race residents 7 100.0% Owner occupiedHouse owners and renters - Two or more races residents 99 88.3% Owner occupied13 11.7% Renter occupiedHouse owners and renters - White alone residents 2,116 83.8% Owner occupied409 16.2% Renter occupiedHouse owners and renters - Hispanic or Latino residents 6 100.0% Owner occupied
Language usage in Lynchburg
English speakers - Total 98.5% of residents of Lynchburg speak English at home.
0.5% of residents speak Spanish at home 26 81.2% Speak English very well6 18.8% Speak English less than very well0.7% of residents speak other language at home 45 100.0% Speak English very well
English speakers - Born in the United States 99.2% of residents of Lynchburg speak English at home.
0.8% of residents speak other language at home 14 100.0% Speak English very well
English speakers - Native, born elsewhere 95.5% of residents of Lynchburg speak English at home.
English speakers - Foreign-born 65.9% of residents of Lynchburg speak English at home.
17.3% of residents speak Spanish at home 24 80.0% Speak English very well6 20.0% Speak English less than very well13.3% of residents speak other language at home 23 100.0% Speak English very well
White (Caucasian) - Speak only English Native:
100.0% (5,762)Foreign-born:
24.7% (7)
White (Caucasian) - Speak another language Native:
0.3% (17)Foreign-born:
72.5% (21)
Black or African American - Speak only English Native:
99.9% (225)Foreign-born:
100.0% (8)
Two or more races - Speak only English Native:
98.3% (144)Foreign-born:
100.0% (66)
White alone - Speak only English Native:
99.5% (5,774)Foreign-born:
25.8% (8)
White alone - Speak another language Native:
0.4% (23)Foreign-born:
75.1% (23)
Foreign-born residents in Lynchburg 173 residents are foreign born (1.0% Europe , 0.9% Asia , 0.5% Latin America ).
This city:
2.6%Tennessee:
5.4%
Marital status for residents in Lynchburg Marital status - White (Caucasian) population 15 years and over
Males 24.3% Never married59.9% Now married0.0% Separated2.7% Widowed13.1% DivorcedFemales 21.2% Never married56.5% Now married0.9% Separated13.1% Widowed8.3% DivorcedWomen who gave birth in the past 12 months Now married:
63.1% (41)Unmarried:
36.9% (24)
Women who did not give birth in the past 12 months Now married:
51.2% (589)Unmarried:
48.8% (561)
Marital status - Black or African American population 15 years and over
Males 26.1% Never married29.3% Now married4.3% Separated29.3% Widowed10.9% DivorcedFemales 37.2% Never married46.9% Now married0.0% Separated5.3% Widowed10.6% DivorcedWomen who did not give birth in the past 12 months Now married:
9.1% (5)Unmarried:
90.9% (49)
Marital status - Other race population 15 years and over
Males 12.5% Never married87.5% Now married0.0% Separated0.0% Widowed0.0% DivorcedFemales 0.0% Never married100.0% Now married0.0% Separated0.0% Widowed0.0% DivorcedWomen who did not give birth in the past 12 months Now married:
100.0% (6)Unmarried:
0.0% (0)
Marital status - Two or more races population 15 years and over
Males 17.2% Never married82.8% Now married0.0% Separated0.0% Widowed0.0% DivorcedFemales 18.0% Never married66.0% Now married0.0% Separated16.0% Widowed0.0% DivorcedWomen who did not give birth in the past 12 months Now married:
0.0% (0)Unmarried:
100.0% (13)
Marital status - White alone, not Hispanic / Latino population 15 years and over
Males 24.3% Never married59.9% Now married0.0% Separated2.7% Widowed13.1% DivorcedFemales 21.3% Never married56.3% Now married0.9% Separated13.1% Widowed8.3% DivorcedWomen who gave birth in the past 12 months Now married:
63.1% (41)Unmarried:
36.9% (24)
Women who did not give birth in the past 12 months Now married:
51.2% (599)Unmarried:
48.8% (570)
Marital status - Hispanic or Latino population 15 years and over
Males 12.5% Never married87.5% Now married0.0% Separated0.0% Widowed0.0% DivorcedFemales 0.0% Never married100.0% Now married0.0% Separated0.0% Widowed0.0% DivorcedWomen who did not give birth in the past 12 months Now married:
100.0% (6)Unmarried:
0.0% (0)
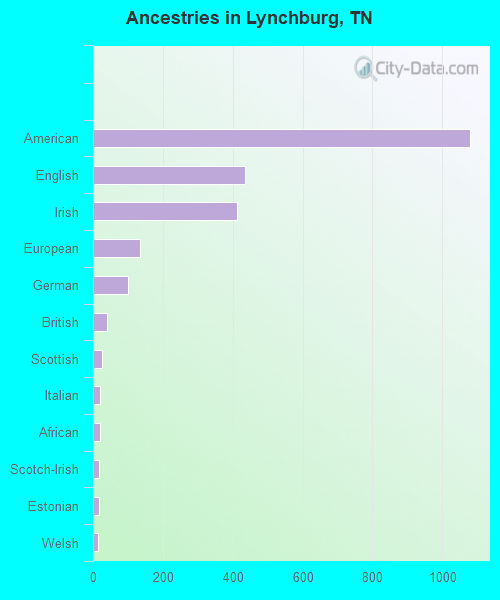
Ancestries in Lynchburg
1,080 37.4% American434 15.0% English412 14.3% Irish135 4.7% European100 3.5% German41 1.4% British27 0.9% Scottish21 0.7% Italian19 0.7% African18 0.6% Scotch-Irish16 0.6% Estonian13 0.5% Welsh7 0.2% Swiss5 0.2% Polish
Children Nativity (place of birth) in Lynchburg
Children under 6 years - Living with two parents Both parents native 238 100.0% NativeChildren under 6 years - Living with one parent Native parent 62 100.0% NativeChildren 6 to 17 years - Living with two parents Both parents native 698 100.0% NativeChildren 6 to 17 years - Living with one parent Native parent 183 100.0% NativeForeign-born parent 27 51.1% Native26 48.9% Foreign-born
Grandparents responsible for own grandchildren in Lynchburg
Grandparents (30 to 59 years) White / Caucasian 17 36.1% Responsible for grandchildren30 63.9% Not responsible for grandchildrenWhite alone, not Hispanic / Latino 17 35.6% Responsible for grandchildren30 64.4% Not responsible for grandchildrenGrandparents (60 years and over) White / Caucasian 40 63.0% Responsible for grandchildren24 37.0% Not responsible for grandchildrenWhite alone, not Hispanic / Latino 41 63.1% Responsible for grandchildren24 36.9% Not responsible for grandchildren