Races in Lutherville-Timonium, Maryland (MD) Detailed Stats
Ancestries, Foreign-born residents, place of birth

Recent posts about races in Lutherville-Timonium, Maryland on our local forum with over 2,400,000 registered users:
 | Where should we live in Baltimore? (23 replies) |
| Relocation to Baltimore area ? White Marsh (10 replies) |
| Moving do Baltimore area, where to live? (75 replies) |
| Baltimore suburbs for Long Island transplants (21 replies) |
| Towson - still safe? (0 replies) |
| Lutherville-Timoniun vs Bel Air or White Marsh (5 replies) |
8.5% of Lutherville-Timonium, MD residents are foreign-born (4.5% born in Asia, 2.7% born in Europe), which is 88.3% less than the foreign-born rate of 16.0% across the entire state of Maryland.
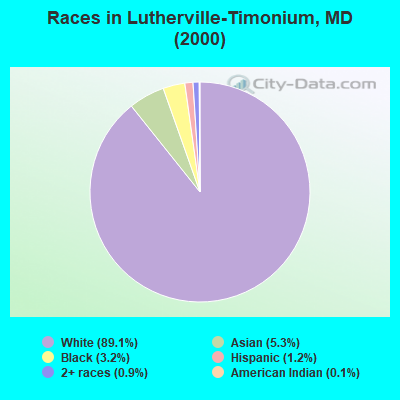
Race distribution in Lutherville-Timonium

- 14,09789.1%White alone
- 8345.3%Asian alone
- 5073.2%Black alone
- 1931.2%Hispanic
- 1490.9%Two or more races
- 220.1%American Indian alone
- 110.07%Other race alone
- 10.01%Native Hawaiian and Other
Pacific Islander alone
2000
2022
-
- 3,286,54762.1%White alone
- 1,464,73527.7%Black alone
- 227,9164.3%Hispanic
- 209,7384.0%Asian alone
- 82,9461.6%Two or more races
- 13,3120.3%American Indian alone
- 9,3790.2%Other race alone
- 1,9130.04%Native Hawaiian and Other
Pacific Islander alone

-
- 2,906,49247.1%White alone
- 1,800,91429.2%Black alone
- 705,84211.4%Hispanic
- 401,8186.5%Asian alone
- 291,3174.7%Two or more races
- 46,9300.8%Other race alone
- 8,9300.1%American Indian alone
- 2,4170.04%Native Hawaiian and Other
Pacific Islander alone

Income and house value in Lutherville-Timonium
- Median household income in 2022
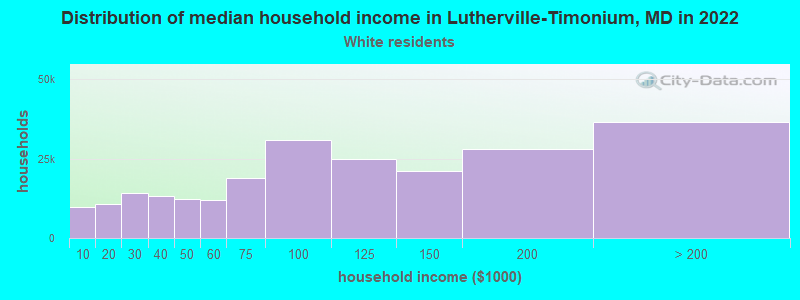
- $112,691White non-Hispanic householders
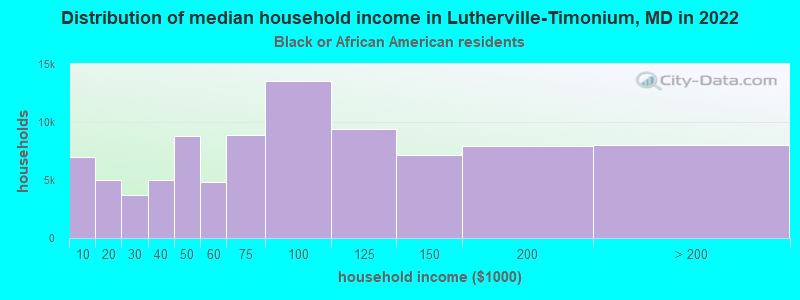
- $67,807Black householders
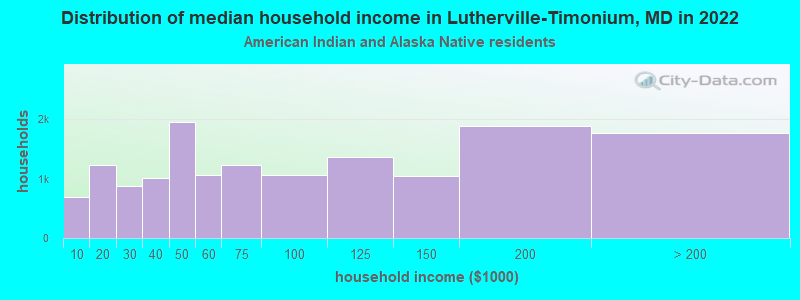
- $97,945American Indian and Alaska Native householders
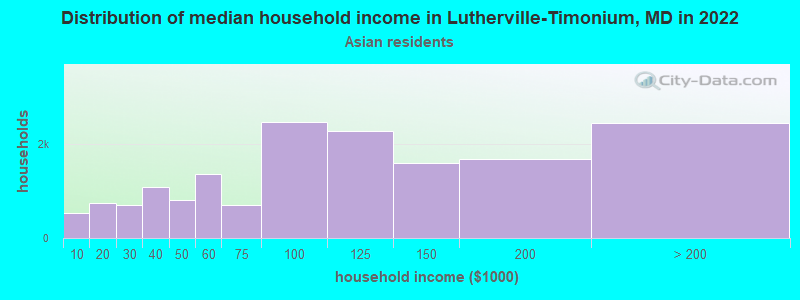
- $99,296Asian householders
- $69,317Some other race householders
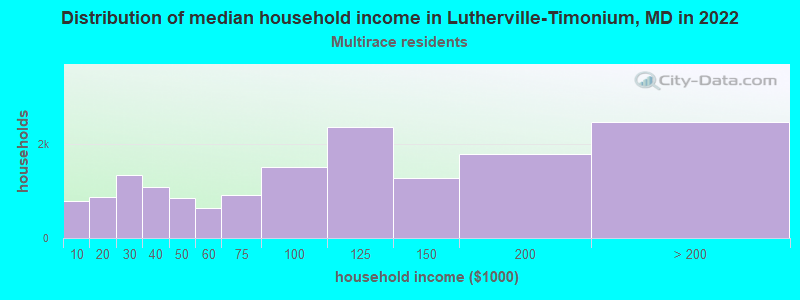
- $87,285Two or more races householders
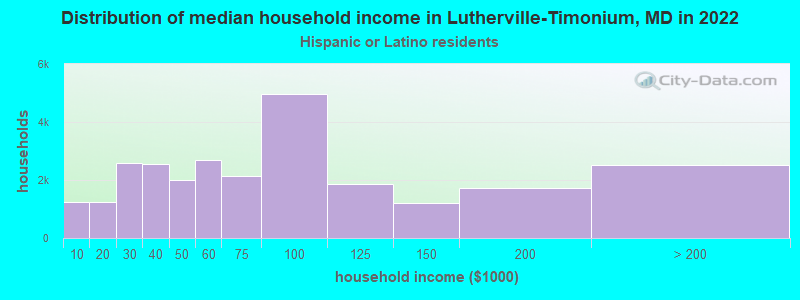
- $99,878Hispanic or Latino race householders
- Median 2022 house value
- $446,808White Non-Hispanic householders
- $360,540Black or African American householders
- $294,988American Indian or Alaska Native householders
- $477,225Asian householders
- $589,976Some other race householders
- $360,540Two or more races householders
- $565,852Hispanic or Latino householders
Household income for White non-Hispanic householders
Household income for Black householders
Household income for American Indian and Alaska Native householders
Household income for Asian householders
Household income for Two or more races householders
Household income for Hispanic or Latino race householders
Foreign-born residents in Lutherville-Timonium
1,344 residents are foreign born (4.5% Asia, 2.7% Europe).
| This city: | 8.5% |
| Maryland: | 9.8% |
Ancestries in Lutherville-Timonium

- 4,32523.9%German
- 2,90016.0%Irish
- 2,57914.2%English
- 2,02611.2%Other
- 1,4738.1%Italian
- 9545.3%Polish
- 5673.1%Scottish
- 5202.9%United States
- 4042.2%Greek
- 2951.6%French
- 2441.3%Scotch-Irish
- 2411.3%Dutch
- 2251.2%Welsh
- 2031.1%Czech
- 1761.0%Russian
- 1410.8%Swedish
- 1190.7%French Canadian
- 1120.6%Norwegian
- 1030.6%Lithuanian
- 960.5%Arab
- 870.5%Ukrainian
- 720.4%Swiss
- 590.3%Slovak
- 540.3%Danish
- 490.3%Hungarian
- 370.2%West Indian
- 340.2%Portuguese
- 160.09%Subsaharan African

Zip codes: 21093.