Races in Loves Park, Illinois (IL) Detailed Stats
Data:
Races - White alone (%)
Races - White alone (% change since 2000)
Races - Black alone (%)
Races - Black alone (% change since 2000)
Races - American Indian alone (%)
Races - American Indian alone (% change since 2000)
Races - Asian alone (%)
Races - Asian alone (% change since 2000)
Races - Hispanic (%)
Races - Hispanic (% change since 2000)
Races - Native Hawaiian and Other Pacific Islander alone (%)
Races - Native Hawaiian and Other Pacific Islander alone (% change since 2000)
Races - Two or more races(%)
Races - Two or more races(% change since 2000)
Races - Other race alone (%)
Races - Other race alone (% change since 2000)
Racial diversity
Place of birth - Born in state of residence (%)
Place of birth - Born in state of residence (%) - White
Place of birth - Born in state of residence (%) - Black or African American
Place of birth - Born in state of residence (%) - Asian
Place of birth - Born in state of residence (%) - Hispanic or Latino
Place of birth - Born in state of residence (%) - American Indian and Alaska Native
Place of birth - Born in state of residence (%) - Multirace
Place of birth - Born in state of residence (%) - Other Race
Place of birth - Born in other state (%)
Place of birth - Born in other state (%) - White
Place of birth - Born in other state (%) - Black or African American
Place of birth - Born in other state (%) - Asian
Place of birth - Born in other state (%) - Hispanic or Latino
Place of birth - Born in other state (%) - American Indian and Alaska Native
Place of birth - Born in other state (%) - Multirace
Place of birth - Born in other state (%) - Other Race
Place of birth - Native, outside of US (%)
Place of birth - Native, outside of US (%) - White
Place of birth - Native, outside of US (%) - Black or African American
Place of birth - Native, outside of US (%) - Asian
Place of birth - Native, outside of US (%) - Hispanic or Latino
Place of birth - Native, outside of US (%) - American Indian and Alaska Native
Place of birth - Native, outside of US (%) - Multirace
Place of birth - Native, outside of US (%) - Other Race
Place of birth - Foreign born (%)
Place of birth - Foreign born (%) - White
Place of birth - Foreign born (%) - Black or African American
Place of birth - Foreign born (%) - Asian
Place of birth - Foreign born (%) - Hispanic or Latino
Place of birth - Foreign born (%) - American Indian and Alaska Native
Place of birth - Foreign born (%) - Multirace
Place of birth - Foreign born (%) - Other Race
Residents speaking English at home (%)
Residents speaking English at home - Born in the United States (%)
Residents speaking English at home - Native, born elsewhere (%)
Residents speaking English at home - Foreign born (%)
Residents speaking Spanish at home (%)
Residents speaking Spanish at home - Born in the United States (%)
Residents speaking Spanish at home - Native, born elsewhere (%)
Residents speaking Spanish at home - Foreign born (%)
Residents speaking other language at home (%)
Residents speaking other language at home - Born in the United States (%)
Residents speaking other language at home - Native, born elsewhere (%)
Residents speaking other language at home - Foreign born (%)
Marital status - Never married (%)
Marital status - Now married (%)
Marital status - Separated (%)
Marital status - Widowed (%)
Marital status - Divorced (%)
Ancestries Reported - Arab (%)
Ancestries Reported - Czech (%)
Ancestries Reported - Danish (%)
Ancestries Reported - Dutch (%)
Ancestries Reported - English (%)
Ancestries Reported - French (%)
Ancestries Reported - French Canadian (%)
Ancestries Reported - German (%)
Ancestries Reported - Greek (%)
Ancestries Reported - Hungarian (%)
Ancestries Reported - Irish (%)
Ancestries Reported - Italian (%)
Ancestries Reported - Lithuanian (%)
Ancestries Reported - Norwegian (%)
Ancestries Reported - Polish (%)
Ancestries Reported - Portuguese (%)
Ancestries Reported - Russian (%)
Ancestries Reported - Scotch-Irish (%)
Ancestries Reported - Scottish (%)
Ancestries Reported - Slovak (%)
Ancestries Reported - Subsaharan African (%)
Ancestries Reported - Swedish (%)
Ancestries Reported - Swiss (%)
Ancestries Reported - Ukrainian (%)
Ancestries Reported - United States (%)
Ancestries Reported - Welsh (%)
Ancestries Reported - West Indian (%)
Ancestries Reported - Other (%)
Geographical mobility - Same house 1 year ago (%)
Geographical mobility - Same house 1 year ago (%) - White
Geographical mobility - Same house 1 year ago (%) - Black or African American
Geographical mobility - Same house 1 year ago (%) - Asian
Geographical mobility - Same house 1 year ago (%) - Hispanic or Latino
Geographical mobility - Same house 1 year ago (%) - American Indian and Alaska Native
Geographical mobility - Same house 1 year ago (%) - Multirace
Geographical mobility - Same house 1 year ago (%) - Other Race
Geographical mobility - Moved within same county (%)
Geographical mobility - Moved within same county (%) - White
Geographical mobility - Moved within same county (%) - Black or African American
Geographical mobility - Moved within same county (%) - Asian
Geographical mobility - Moved within same county (%) - Hispanic or Latino
Geographical mobility - Moved within same county (%) - American Indian and Alaska Native
Geographical mobility - Moved within same county (%) - Multirace
Geographical mobility - Moved within same county (%) - Other Race
Geographical mobility - Moved from different county within same state (%)
Geographical mobility - Moved from different county within same state (%) - White
Geographical mobility - Moved from different county within same state (%) - Black or African American
Geographical mobility - Moved from different county within same state (%) - Asian
Geographical mobility - Moved from different county within same state (%) - Hispanic or Latino
Geographical mobility - Moved from different county within same state (%) - American Indian and Alaska Native
Geographical mobility - Moved from different county within same state (%) - Multirace
Geographical mobility - Moved from different county within same state (%) - Other Race
Geographical mobility - Moved from different state (%)
Geographical mobility - Moved from different state (%) - White
Geographical mobility - Moved from different state (%) - Black or African American
Geographical mobility - Moved from different state (%) - Asian
Geographical mobility - Moved from different state (%) - Hispanic or Latino
Geographical mobility - Moved from different state (%) - American Indian and Alaska Native
Geographical mobility - Moved from different state (%) - Multirace
Geographical mobility - Moved from different state (%) - Other Race
Geographical mobility - Moved from abroad (%)
Geographical mobility - Moved from abroad (%) - White
Geographical mobility - Moved from abroad (%) - Black or African American
Geographical mobility - Moved from abroad (%) - Asian
Geographical mobility - Moved from abroad (%) - Hispanic or Latino
Geographical mobility - Moved from abroad (%) - American Indian and Alaska Native
Geographical mobility - Moved from abroad (%) - Multirace
Geographical mobility - Moved from abroad (%) - Other Race
Place of birth for the foreign-born population - Ireland (%)
Place of birth for the foreign-born population - Denmark (%)
Place of birth for the foreign-born population - Norway (%)
Place of birth for the foreign-born population - Sweden (%)
Place of birth for the foreign-born population - United Kingdom (%)
Place of birth for the foreign-born population - England (%)
Place of birth for the foreign-born population - Scotland (%)
Place of birth for the foreign-born population - Other Northern Europe (%)
Place of birth for the foreign-born population - Austria (%)
Place of birth for the foreign-born population - Belgium (%)
Place of birth for the foreign-born population - France (%)
Place of birth for the foreign-born population - Germany (%)
Place of birth for the foreign-born population - Netherlands (%)
Place of birth for the foreign-born population - Switzerland (%)
Place of birth for the foreign-born population - Other Western Europe (%)
Place of birth for the foreign-born population - Greece (%)
Place of birth for the foreign-born population - Italy (%)
Place of birth for the foreign-born population - Portugal (%)
Place of birth for the foreign-born population - Spain (%)
Place of birth for the foreign-born population - Other Southern Europe (%)
Place of birth for the foreign-born population - Albania (%)
Place of birth for the foreign-born population - Belarus (%)
Place of birth for the foreign-born population - Bosnia and Herzegovina (%)
Place of birth for the foreign-born population - Bulgaria (%)
Place of birth for the foreign-born population - Croatia (%)
Place of birth for the foreign-born population - Czechoslovakia (%)
Place of birth for the foreign-born population - Hungary (%)
Place of birth for the foreign-born population - Latvia (%)
Place of birth for the foreign-born population - Lithuania (%)
Place of birth for the foreign-born population - North Macedonia (Macedonia) (%)
Place of birth for the foreign-born population - Moldova (%)
Place of birth for the foreign-born population - Poland (%)
Place of birth for the foreign-born population - Romania (%)
Place of birth for the foreign-born population - Russia (%)
Place of birth for the foreign-born population - Serbia (%)
Place of birth for the foreign-born population - Ukraine (%)
Place of birth for the foreign-born population - Other Eastern Europe (%)
Place of birth for the foreign-born population - China (%)
Place of birth for the foreign-born population - Hong Kong (%)
Place of birth for the foreign-born population - Taiwan (%)
Place of birth for the foreign-born population - Japan (%)
Place of birth for the foreign-born population - Korea (%)
Place of birth for the foreign-born population - Other Eastern Asia (%)
Place of birth for the foreign-born population - Afghanistan (%)
Place of birth for the foreign-born population - Bangladesh (%)
Place of birth for the foreign-born population - India (%)
Place of birth for the foreign-born population - Iran (%)
Place of birth for the foreign-born population - Kazakhstan (%)
Place of birth for the foreign-born population - Nepal (%)
Place of birth for the foreign-born population - Pakistan (%)
Place of birth for the foreign-born population - Sri Lanka (%)
Place of birth for the foreign-born population - Uzbekistan (%)
Place of birth for the foreign-born population - Other South Central Asia (%)
Place of birth for the foreign-born population - Burma (%)
Place of birth for the foreign-born population - Cambodia (%)
Place of birth for the foreign-born population - Indonesia (%)
Place of birth for the foreign-born population - Laos (%)
Place of birth for the foreign-born population - Malaysia (%)
Place of birth for the foreign-born population - Philippines (%)
Place of birth for the foreign-born population - Singapore (%)
Place of birth for the foreign-born population - Thailand (%)
Place of birth for the foreign-born population - Vietnam (%)
Place of birth for the foreign-born population - Other South Eastern Asia (%)
Place of birth for the foreign-born population - Armenia (%)
Place of birth for the foreign-born population - Iraq (%)
Place of birth for the foreign-born population - Israel (%)
Place of birth for the foreign-born population - Jordan (%)
Place of birth for the foreign-born population - Kuwait (%)
Place of birth for the foreign-born population - Lebanon (%)
Place of birth for the foreign-born population - Saudi Arabia (%)
Place of birth for the foreign-born population - Syria (%)
Place of birth for the foreign-born population - Turkey (%)
Place of birth for the foreign-born population - Yemen (%)
Place of birth for the foreign-born population - Other Western Asia (%)
Place of birth for the foreign-born population - Eritrea (%)
Place of birth for the foreign-born population - Ethiopia (%)
Place of birth for the foreign-born population - Kenya (%)
Place of birth for the foreign-born population - Somalia (%)
Place of birth for the foreign-born population - Uganda (%)
Place of birth for the foreign-born population - Zimbabwe (%)
Place of birth for the foreign-born population - Other Eastern Africa (%)
Place of birth for the foreign-born population - Cameroon (%)
Place of birth for the foreign-born population - Congo (%)
Place of birth for the foreign-born population - Democratic Republic of Congo (Zaire) (%)
Place of birth for the foreign-born population - Other Middle Africa (%)
Place of birth for the foreign-born population - Egypt (%)
Place of birth for the foreign-born population - Morocco (%)
Place of birth for the foreign-born population - Sudan (%)
Place of birth for the foreign-born population - Other Northern Africa (%)
Place of birth for the foreign-born population - South Africa (%)
Place of birth for the foreign-born population - Other Southern Africa (%)
Place of birth for the foreign-born population - Cabo Verde (%)
Place of birth for the foreign-born population - Ghana (%)
Place of birth for the foreign-born population - Liberia (%)
Place of birth for the foreign-born population - Nigeria (%)
Place of birth for the foreign-born population - Senegal (%)
Place of birth for the foreign-born population - Sierra Leone (%)
Place of birth for the foreign-born population - Other Western Africa (%)
Place of birth for the foreign-born population - Australia (%)
Place of birth for the foreign-born population - New Zealand (%)
Place of birth for the foreign-born population - Fiji (%)
Place of birth for the foreign-born population - Micronesia (%)
Place of birth for the foreign-born population - Bahamas (%)
Place of birth for the foreign-born population - Barbados (%)
Place of birth for the foreign-born population - Cuba (%)
Place of birth for the foreign-born population - Dominica (%)
Place of birth for the foreign-born population - Dominican Republic (%)
Place of birth for the foreign-born population - Grenada (%)
Place of birth for the foreign-born population - Haiti (%)
Place of birth for the foreign-born population - Jamaica (%)
Place of birth for the foreign-born population - St. Vincent and the Grenadines (%)
Place of birth for the foreign-born population - Trinidad and Tobago (%)
Place of birth for the foreign-born population - West Indies (%)
Place of birth for the foreign-born population - Other Caribbean (%)
Place of birth for the foreign-born population - Belize (%)
Place of birth for the foreign-born population - Costa Rica (%)
Place of birth for the foreign-born population - El Salvador (%)
Place of birth for the foreign-born population - Guatemala (%)
Place of birth for the foreign-born population - Honduras (%)
Place of birth for the foreign-born population - Mexico (%)
Place of birth for the foreign-born population - Nicaragua (%)
Place of birth for the foreign-born population - Panama (%)
Place of birth for the foreign-born population - Other Central America (%)
Place of birth for the foreign-born population - Argentina (%)
Place of birth for the foreign-born population - Bolivia (%)
Place of birth for the foreign-born population - Brazil (%)
Place of birth for the foreign-born population - Chile (%)
Place of birth for the foreign-born population - Colombia (%)
Place of birth for the foreign-born population - Ecuador (%)
Place of birth for the foreign-born population - Guyana (%)
Place of birth for the foreign-born population - Peru (%)
Place of birth for the foreign-born population - Uruguay (%)
Place of birth for the foreign-born population - Venezuela (%)
Place of birth for the foreign-born population - Other South America (%)
Place of birth for the foreign-born population - Canada (%)
Place of birth for the foreign-born population - Other Northern America (%)
Place of birth for the foreign-born population - Other (%)
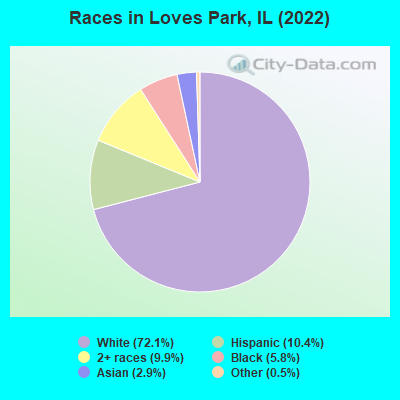
According to 2022 data, the most numerous races in Loves Park, IL are White alone (16,390 residents), Hispanic (2,363 residents), and Black alone (1,325 residents). 88.7% of Loves Park residents speak English at home. 8.1% of Loves Park, IL residents are foreign-born (3.1% born in Europe, 2.7% born in Asia, 1.5% born in Latin America), which is 73.1% less than the foreign-born rate of 14.0% across the entire state of Illinois.
Race distribution in Loves Park
2000 2022
8,424,140 67.8% White alone 1,856,152 14.9% Black alone 1,530,262 12.3% Hispanic 419,916 3.4% Asian alone 153,996 1.2% Two or more races 13,479 0.1% Other race alone 18,232 0.1% American Indian alone 3,116 0.03% Native Hawaiian and Other
7,356,301 58.5% White alone 2,299,726 18.3% Hispanic 1,660,423 13.2% Black alone 747,296 5.9% Asian alone 458,599 3.6% Two or more races 45,386 0.4% Other race alone 10,405 0.08% American Indian alone 3,896 0.03% Native Hawaiian and Other
Income and house value in Loves Park Median household income in 2022 $55,489 White non-Hispanic householders$30,435 Black householders$92,624 Asian householders$61,052 Two or more races householders$53,896 Hispanic or Latino race householdersMedian 2022 house value $156,067 White Non-Hispanic householders$153,782 Black or African American householders $233,749 Asian householders$197,720 Native Hawaiian and other Pacific Islander householders$152,727 Some other race householders$120,038 Two or more races householders$156,418 Hispanic or Latino householders
Median age by race in Loves Park
43.5 Median age for White residents40.4 46.5 32.1 Median age for Black or African American residents30.2 33.2 -671,485,943.1 Median age for American Indian / Alaska Native residents-367,313,915.5 -798,727,127.3 35.2 Median age for Asian residents35.9 34.2 -410,158,729.7 Median age for Native Hawaiian / Pacific Islander residents-580,818,242.2 -576,015,108.0 32.5 Median age for Other race residents38.0 23.3 25.5 Median age for Two or more races residents23.3 26.0 44.7 Median age for White alone residents40.8 46.7 26.2 Median age for Hispanic or Latino residents23.0 27.0
Owner/renter occupied households by race in Loves Park
House owners and renters - White residents 5,516 69.4% Owner occupied2,429 30.6% Renter occupiedHouse owners and renters - Black or African American residents 92 19.1% Owner occupied392 80.9% Renter occupiedHouse owners and renters - American Indian / Alaska Native residents 31 100.0% Renter occupiedHouse owners and renters - Asian residents 114 81.3% Owner occupied26 18.7% Renter occupiedHouse owners and renters - Other race residents 27 20.5% Owner occupied106 79.5% Renter occupiedHouse owners and renters - Two or more races residents 292 35.5% Owner occupied532 64.5% Renter occupiedHouse owners and renters - White alone residents 5,508 69.0% Owner occupied2,474 31.0% Renter occupiedHouse owners and renters - Hispanic or Latino residents 205 38.5% Owner occupied328 61.5% Renter occupied
Language usage in Loves Park
English speakers - Total 88.7% of residents of Loves Park speak English at home.
5.5% of residents speak Spanish at home 694 59.7% Speak English very well469 40.3% Speak English less than very well5.5% of residents speak other language at home 816 69.9% Speak English very well352 30.1% Speak English less than very well
English speakers - Born in the United States 95.8% of residents of Loves Park speak English at home.
4.2% of residents speak Spanish at home 87 44.4% Speak English very well109 55.6% Speak English less than very well0.6% of residents speak other language at home 16 53.3% Speak English very well14 46.7% Speak English less than very well
English speakers - Native, born elsewhere 26.4% of residents of Loves Park speak English at home.
38.9% of residents speak Spanish at home 28 100.0% Speak English less than very well
English speakers - Foreign-born 13.7% of residents of Loves Park speak English at home.
18.7% of residents speak Spanish at home 153 50.7% Speak English very well149 49.3% Speak English less than very well65.5% of residents speak other language at home 718 67.7% Speak English very well342 32.3% Speak English less than very well
White (Caucasian) - Speak only English Native:
99.3% (15,123)Foreign-born:
11.1% (45)
White (Caucasian) - Speak another language Native:
1.4% (217)Foreign-born:
88.7% (356)
Black or African American - Speak another language Native:
2.2% (28)Foreign-born:
100.0% (6)
Asian - Speak only English Native:
50.6% (82)Foreign-born:
19.8% (89)
Asian - Speak another language Native:
36.7% (60)Foreign-born:
78.0% (353)
Other race - Speak only English Native:
19.2% (47)Foreign-born:
31.9% (94)
Other race - Speak another language Native:
77.7% (190)Foreign-born:
60.1% (177)
Two or more races - Speak another language Native:
18.8% (465)Foreign-born:
99.2% (236)
White alone - Speak only English Native:
99.2% (14,907)Foreign-born:
8.6% (45)
White alone - Speak another language Native:
0.9% (134)Foreign-born:
96.0% (501)
Hispanic or Latino - Speak only English Native:
52.4% (859)Foreign-born:
4.3% (14)
Hispanic or Latino - Speak another language Native:
47.1% (772)Foreign-born:
95.4% (301)
Foreign-born residents in Loves Park 1,839 residents are foreign born (3.1% Europe , 2.7% Asia , 1.5% Latin America ).
This city:
8.1%Illinois:
14.1%
Marital status for residents in Loves Park Marital status - White (Caucasian) population 15 years and over
Males 33.1% Never married49.7% Now married1.6% Separated1.7% Widowed13.9% DivorcedFemales 28.9% Never married42.0% Now married2.6% Separated12.2% Widowed14.5% DivorcedWomen who gave birth in the past 12 months Now married:
45.3% (136)Unmarried:
54.7% (164)
Women who did not give birth in the past 12 months Now married:
35.9% (1,188)Unmarried:
64.1% (2,117)
Marital status - Black or African American population 15 years and over
Males 65.6% Never married30.2% Now married2.4% Separated0.0% Widowed1.8% DivorcedFemales 59.7% Never married18.1% Now married3.3% Separated5.5% Widowed13.4% DivorcedWomen who did not give birth in the past 12 months Now married:
27.0% (70)Unmarried:
73.0% (189)
Marital status - Asian population 15 years and over
Males 30.4% Never married69.6% Now married0.0% Separated0.0% Widowed0.0% DivorcedFemales 26.9% Never married69.2% Now married0.0% Separated0.5% Widowed3.4% DivorcedWomen who gave birth in the past 12 months Now married:
100.0% (86)Unmarried:
0.0% (0)
Women who did not give birth in the past 12 months Now married:
53.5% (137)Unmarried:
46.5% (119)
Marital status - Other race population 15 years and over
Males 69.3% Never married27.6% Now married0.0% Separated0.0% Widowed3.1% DivorcedFemales 51.6% Never married40.6% Now married7.8% Separated0.0% Widowed0.0% DivorcedWomen who gave birth in the past 12 months Now married:
0.0% (0)Unmarried:
100.0% (49)
Women who did not give birth in the past 12 months Now married:
52.2% (53)Unmarried:
47.8% (49)
Marital status - Two or more races population 15 years and over
Males 65.6% Never married30.6% Now married0.0% Separated0.0% Widowed3.8% DivorcedFemales 57.1% Never married26.3% Now married5.3% Separated6.1% Widowed5.2% DivorcedWomen who did not give birth in the past 12 months Now married:
33.3% (335)Unmarried:
66.7% (671)
Marital status - White alone, not Hispanic / Latino population 15 years and over
Males 31.9% Never married50.8% Now married1.7% Separated1.7% Widowed13.9% DivorcedFemales 28.1% Never married41.9% Now married2.5% Separated12.5% Widowed15.1% DivorcedWomen who gave birth in the past 12 months Now married:
45.2% (118)Unmarried:
54.8% (143)
Women who did not give birth in the past 12 months Now married:
35.3% (1,159)Unmarried:
64.7% (2,122)
Marital status - Hispanic or Latino population 15 years and over
Males 50.7% Never married38.2% Now married0.0% Separated1.2% Widowed9.9% DivorcedFemales 43.0% Never married39.4% Now married8.9% Separated6.3% Widowed2.3% DivorcedWomen who gave birth in the past 12 months Now married:
29.3% (29)Unmarried:
70.7% (70)
Women who did not give birth in the past 12 months Now married:
51.2% (261)Unmarried:
48.8% (250)
Ancestries in Loves Park
1,524 16.0% German758 8.0% Irish631 6.6% American575 6.1% Swedish552 5.8% Italian453 4.8% English341 3.6% Ukrainian229 2.4% Polish203 2.1% Serbian139 1.5% European103 1.1% Norwegian65 0.7% Scottish51 0.5% Egyptian51 0.5% Dutch51 0.5% French Canadian50 0.5% Czech48 0.5% Yugoslavian45 0.5% Welsh24 0.3% British21 0.2% Eastern European21 0.2% Scandinavian19 0.2% French17 0.2% African12 0.1% Russian10 0.1% Bulgarian10 0.1% Turkish8 0.08% Hungarian7 0.07% Czechoslovakian6 0.06% Austrian6 0.06% Danish6 0.06% Finnish1 0.01% Croatian1 0.01% Kenyan
Children Nativity (place of birth) in Loves Park
Children under 6 years - Living with two parents Both parents native 675 100.0% NativeBoth parents foreign-born 36 100.0% NativeOne native, one foreign-born parent 211 100.0% NativeChildren under 6 years - Living with one parent Native parent 650 100.0% NativeForeign-born parent 152 100.0% NativeChildren 6 to 17 years - Living with two parents Both parents native 1,259 100.0% NativeBoth parents foreign-born 46 28.3% Native117 71.7% Foreign-bornOne native, one foreign-born parent 167 100.0% NativeChildren 6 to 17 years - Living with one parent Native parent 1,079 100.0% NativeForeign-born parent 123 63.6% Native70 36.4% Foreign-born
Grandparents responsible for own grandchildren in Loves Park
Grandparents (30 to 59 years) White / Caucasian 89 84.3% Responsible for grandchildren17 15.7% Not responsible for grandchildrenWhite alone, not Hispanic / Latino 49 72.7% Responsible for grandchildren18 27.3% Not responsible for grandchildrenHispanic or Latino 64 100.0% Responsible for grandchildrenGrandparents (60 years and over) White / Caucasian 139 78.8% Responsible for grandchildren37 21.2% Not responsible for grandchildrenWhite alone, not Hispanic / Latino 107 72.0% Responsible for grandchildren41 28.0% Not responsible for grandchildrenHispanic or Latino 27 100.0% Responsible for grandchildren