Races in Long Branch, Virginia (VA) Detailed Stats
Data:
Races - White alone (%)
Races - White alone (% change since 2000)
Races - Black alone (%)
Races - Black alone (% change since 2000)
Races - American Indian alone (%)
Races - American Indian alone (% change since 2000)
Races - Asian alone (%)
Races - Asian alone (% change since 2000)
Races - Hispanic (%)
Races - Hispanic (% change since 2000)
Races - Native Hawaiian and Other Pacific Islander alone (%)
Races - Native Hawaiian and Other Pacific Islander alone (% change since 2000)
Races - Two or more races(%)
Races - Two or more races(% change since 2000)
Races - Other race alone (%)
Races - Other race alone (% change since 2000)
Racial diversity
Place of birth - Born in state of residence (%)
Place of birth - Born in state of residence (%) - White
Place of birth - Born in state of residence (%) - Black or African American
Place of birth - Born in state of residence (%) - Asian
Place of birth - Born in state of residence (%) - Hispanic or Latino
Place of birth - Born in state of residence (%) - American Indian and Alaska Native
Place of birth - Born in state of residence (%) - Multirace
Place of birth - Born in state of residence (%) - Other Race
Place of birth - Born in other state (%)
Place of birth - Born in other state (%) - White
Place of birth - Born in other state (%) - Black or African American
Place of birth - Born in other state (%) - Asian
Place of birth - Born in other state (%) - Hispanic or Latino
Place of birth - Born in other state (%) - American Indian and Alaska Native
Place of birth - Born in other state (%) - Multirace
Place of birth - Born in other state (%) - Other Race
Place of birth - Native, outside of US (%)
Place of birth - Native, outside of US (%) - White
Place of birth - Native, outside of US (%) - Black or African American
Place of birth - Native, outside of US (%) - Asian
Place of birth - Native, outside of US (%) - Hispanic or Latino
Place of birth - Native, outside of US (%) - American Indian and Alaska Native
Place of birth - Native, outside of US (%) - Multirace
Place of birth - Native, outside of US (%) - Other Race
Place of birth - Foreign born (%)
Place of birth - Foreign born (%) - White
Place of birth - Foreign born (%) - Black or African American
Place of birth - Foreign born (%) - Asian
Place of birth - Foreign born (%) - Hispanic or Latino
Place of birth - Foreign born (%) - American Indian and Alaska Native
Place of birth - Foreign born (%) - Multirace
Place of birth - Foreign born (%) - Other Race
Residents speaking English at home (%)
Residents speaking English at home - Born in the United States (%)
Residents speaking English at home - Native, born elsewhere (%)
Residents speaking English at home - Foreign born (%)
Residents speaking Spanish at home (%)
Residents speaking Spanish at home - Born in the United States (%)
Residents speaking Spanish at home - Native, born elsewhere (%)
Residents speaking Spanish at home - Foreign born (%)
Residents speaking other language at home (%)
Residents speaking other language at home - Born in the United States (%)
Residents speaking other language at home - Native, born elsewhere (%)
Residents speaking other language at home - Foreign born (%)
Marital status - Never married (%)
Marital status - Now married (%)
Marital status - Separated (%)
Marital status - Widowed (%)
Marital status - Divorced (%)
Ancestries Reported - Arab (%)
Ancestries Reported - Czech (%)
Ancestries Reported - Danish (%)
Ancestries Reported - Dutch (%)
Ancestries Reported - English (%)
Ancestries Reported - French (%)
Ancestries Reported - French Canadian (%)
Ancestries Reported - German (%)
Ancestries Reported - Greek (%)
Ancestries Reported - Hungarian (%)
Ancestries Reported - Irish (%)
Ancestries Reported - Italian (%)
Ancestries Reported - Lithuanian (%)
Ancestries Reported - Norwegian (%)
Ancestries Reported - Polish (%)
Ancestries Reported - Portuguese (%)
Ancestries Reported - Russian (%)
Ancestries Reported - Scotch-Irish (%)
Ancestries Reported - Scottish (%)
Ancestries Reported - Slovak (%)
Ancestries Reported - Subsaharan African (%)
Ancestries Reported - Swedish (%)
Ancestries Reported - Swiss (%)
Ancestries Reported - Ukrainian (%)
Ancestries Reported - United States (%)
Ancestries Reported - Welsh (%)
Ancestries Reported - West Indian (%)
Ancestries Reported - Other (%)
Geographical mobility - Same house 1 year ago (%)
Geographical mobility - Same house 1 year ago (%) - White
Geographical mobility - Same house 1 year ago (%) - Black or African American
Geographical mobility - Same house 1 year ago (%) - Asian
Geographical mobility - Same house 1 year ago (%) - Hispanic or Latino
Geographical mobility - Same house 1 year ago (%) - American Indian and Alaska Native
Geographical mobility - Same house 1 year ago (%) - Multirace
Geographical mobility - Same house 1 year ago (%) - Other Race
Geographical mobility - Moved within same county (%)
Geographical mobility - Moved within same county (%) - White
Geographical mobility - Moved within same county (%) - Black or African American
Geographical mobility - Moved within same county (%) - Asian
Geographical mobility - Moved within same county (%) - Hispanic or Latino
Geographical mobility - Moved within same county (%) - American Indian and Alaska Native
Geographical mobility - Moved within same county (%) - Multirace
Geographical mobility - Moved within same county (%) - Other Race
Geographical mobility - Moved from different county within same state (%)
Geographical mobility - Moved from different county within same state (%) - White
Geographical mobility - Moved from different county within same state (%) - Black or African American
Geographical mobility - Moved from different county within same state (%) - Asian
Geographical mobility - Moved from different county within same state (%) - Hispanic or Latino
Geographical mobility - Moved from different county within same state (%) - American Indian and Alaska Native
Geographical mobility - Moved from different county within same state (%) - Multirace
Geographical mobility - Moved from different county within same state (%) - Other Race
Geographical mobility - Moved from different state (%)
Geographical mobility - Moved from different state (%) - White
Geographical mobility - Moved from different state (%) - Black or African American
Geographical mobility - Moved from different state (%) - Asian
Geographical mobility - Moved from different state (%) - Hispanic or Latino
Geographical mobility - Moved from different state (%) - American Indian and Alaska Native
Geographical mobility - Moved from different state (%) - Multirace
Geographical mobility - Moved from different state (%) - Other Race
Geographical mobility - Moved from abroad (%)
Geographical mobility - Moved from abroad (%) - White
Geographical mobility - Moved from abroad (%) - Black or African American
Geographical mobility - Moved from abroad (%) - Asian
Geographical mobility - Moved from abroad (%) - Hispanic or Latino
Geographical mobility - Moved from abroad (%) - American Indian and Alaska Native
Geographical mobility - Moved from abroad (%) - Multirace
Geographical mobility - Moved from abroad (%) - Other Race
Place of birth for the foreign-born population - Ireland (%)
Place of birth for the foreign-born population - Denmark (%)
Place of birth for the foreign-born population - Norway (%)
Place of birth for the foreign-born population - Sweden (%)
Place of birth for the foreign-born population - United Kingdom (%)
Place of birth for the foreign-born population - England (%)
Place of birth for the foreign-born population - Scotland (%)
Place of birth for the foreign-born population - Other Northern Europe (%)
Place of birth for the foreign-born population - Austria (%)
Place of birth for the foreign-born population - Belgium (%)
Place of birth for the foreign-born population - France (%)
Place of birth for the foreign-born population - Germany (%)
Place of birth for the foreign-born population - Netherlands (%)
Place of birth for the foreign-born population - Switzerland (%)
Place of birth for the foreign-born population - Other Western Europe (%)
Place of birth for the foreign-born population - Greece (%)
Place of birth for the foreign-born population - Italy (%)
Place of birth for the foreign-born population - Portugal (%)
Place of birth for the foreign-born population - Spain (%)
Place of birth for the foreign-born population - Other Southern Europe (%)
Place of birth for the foreign-born population - Albania (%)
Place of birth for the foreign-born population - Belarus (%)
Place of birth for the foreign-born population - Bosnia and Herzegovina (%)
Place of birth for the foreign-born population - Bulgaria (%)
Place of birth for the foreign-born population - Croatia (%)
Place of birth for the foreign-born population - Czechoslovakia (%)
Place of birth for the foreign-born population - Hungary (%)
Place of birth for the foreign-born population - Latvia (%)
Place of birth for the foreign-born population - Lithuania (%)
Place of birth for the foreign-born population - North Macedonia (Macedonia) (%)
Place of birth for the foreign-born population - Moldova (%)
Place of birth for the foreign-born population - Poland (%)
Place of birth for the foreign-born population - Romania (%)
Place of birth for the foreign-born population - Russia (%)
Place of birth for the foreign-born population - Serbia (%)
Place of birth for the foreign-born population - Ukraine (%)
Place of birth for the foreign-born population - Other Eastern Europe (%)
Place of birth for the foreign-born population - China (%)
Place of birth for the foreign-born population - Hong Kong (%)
Place of birth for the foreign-born population - Taiwan (%)
Place of birth for the foreign-born population - Japan (%)
Place of birth for the foreign-born population - Korea (%)
Place of birth for the foreign-born population - Other Eastern Asia (%)
Place of birth for the foreign-born population - Afghanistan (%)
Place of birth for the foreign-born population - Bangladesh (%)
Place of birth for the foreign-born population - India (%)
Place of birth for the foreign-born population - Iran (%)
Place of birth for the foreign-born population - Kazakhstan (%)
Place of birth for the foreign-born population - Nepal (%)
Place of birth for the foreign-born population - Pakistan (%)
Place of birth for the foreign-born population - Sri Lanka (%)
Place of birth for the foreign-born population - Uzbekistan (%)
Place of birth for the foreign-born population - Other South Central Asia (%)
Place of birth for the foreign-born population - Burma (%)
Place of birth for the foreign-born population - Cambodia (%)
Place of birth for the foreign-born population - Indonesia (%)
Place of birth for the foreign-born population - Laos (%)
Place of birth for the foreign-born population - Malaysia (%)
Place of birth for the foreign-born population - Philippines (%)
Place of birth for the foreign-born population - Singapore (%)
Place of birth for the foreign-born population - Thailand (%)
Place of birth for the foreign-born population - Vietnam (%)
Place of birth for the foreign-born population - Other South Eastern Asia (%)
Place of birth for the foreign-born population - Armenia (%)
Place of birth for the foreign-born population - Iraq (%)
Place of birth for the foreign-born population - Israel (%)
Place of birth for the foreign-born population - Jordan (%)
Place of birth for the foreign-born population - Kuwait (%)
Place of birth for the foreign-born population - Lebanon (%)
Place of birth for the foreign-born population - Saudi Arabia (%)
Place of birth for the foreign-born population - Syria (%)
Place of birth for the foreign-born population - Turkey (%)
Place of birth for the foreign-born population - Yemen (%)
Place of birth for the foreign-born population - Other Western Asia (%)
Place of birth for the foreign-born population - Eritrea (%)
Place of birth for the foreign-born population - Ethiopia (%)
Place of birth for the foreign-born population - Kenya (%)
Place of birth for the foreign-born population - Somalia (%)
Place of birth for the foreign-born population - Uganda (%)
Place of birth for the foreign-born population - Zimbabwe (%)
Place of birth for the foreign-born population - Other Eastern Africa (%)
Place of birth for the foreign-born population - Cameroon (%)
Place of birth for the foreign-born population - Congo (%)
Place of birth for the foreign-born population - Democratic Republic of Congo (Zaire) (%)
Place of birth for the foreign-born population - Other Middle Africa (%)
Place of birth for the foreign-born population - Egypt (%)
Place of birth for the foreign-born population - Morocco (%)
Place of birth for the foreign-born population - Sudan (%)
Place of birth for the foreign-born population - Other Northern Africa (%)
Place of birth for the foreign-born population - South Africa (%)
Place of birth for the foreign-born population - Other Southern Africa (%)
Place of birth for the foreign-born population - Cabo Verde (%)
Place of birth for the foreign-born population - Ghana (%)
Place of birth for the foreign-born population - Liberia (%)
Place of birth for the foreign-born population - Nigeria (%)
Place of birth for the foreign-born population - Senegal (%)
Place of birth for the foreign-born population - Sierra Leone (%)
Place of birth for the foreign-born population - Other Western Africa (%)
Place of birth for the foreign-born population - Australia (%)
Place of birth for the foreign-born population - New Zealand (%)
Place of birth for the foreign-born population - Fiji (%)
Place of birth for the foreign-born population - Micronesia (%)
Place of birth for the foreign-born population - Bahamas (%)
Place of birth for the foreign-born population - Barbados (%)
Place of birth for the foreign-born population - Cuba (%)
Place of birth for the foreign-born population - Dominica (%)
Place of birth for the foreign-born population - Dominican Republic (%)
Place of birth for the foreign-born population - Grenada (%)
Place of birth for the foreign-born population - Haiti (%)
Place of birth for the foreign-born population - Jamaica (%)
Place of birth for the foreign-born population - St. Vincent and the Grenadines (%)
Place of birth for the foreign-born population - Trinidad and Tobago (%)
Place of birth for the foreign-born population - West Indies (%)
Place of birth for the foreign-born population - Other Caribbean (%)
Place of birth for the foreign-born population - Belize (%)
Place of birth for the foreign-born population - Costa Rica (%)
Place of birth for the foreign-born population - El Salvador (%)
Place of birth for the foreign-born population - Guatemala (%)
Place of birth for the foreign-born population - Honduras (%)
Place of birth for the foreign-born population - Mexico (%)
Place of birth for the foreign-born population - Nicaragua (%)
Place of birth for the foreign-born population - Panama (%)
Place of birth for the foreign-born population - Other Central America (%)
Place of birth for the foreign-born population - Argentina (%)
Place of birth for the foreign-born population - Bolivia (%)
Place of birth for the foreign-born population - Brazil (%)
Place of birth for the foreign-born population - Chile (%)
Place of birth for the foreign-born population - Colombia (%)
Place of birth for the foreign-born population - Ecuador (%)
Place of birth for the foreign-born population - Guyana (%)
Place of birth for the foreign-born population - Peru (%)
Place of birth for the foreign-born population - Uruguay (%)
Place of birth for the foreign-born population - Venezuela (%)
Place of birth for the foreign-born population - Other South America (%)
Place of birth for the foreign-born population - Canada (%)
Place of birth for the foreign-born population - Other Northern America (%)
Place of birth for the foreign-born population - Other (%)
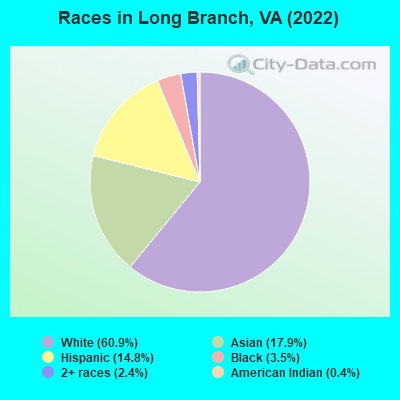
According to 2022 data, the most numerous races in Long Branch, VA are White alone (4,679 residents), Black alone (267 residents), and Hispanic (1,138 residents). 73.0% of Long Branch residents speak English at home.
Race distribution in Long Branch 4,679 60.9% White alone 1,378 17.9% Asian alone 1,138 14.8% Hispanic 267 3.5% Black alone 183 2.4% Two or more races 34 0.4% American Indian alone
2000 2022
4,965,637 70.2% White alone 1,376,378 19.4% Black alone 329,540 4.7% Hispanic 259,277 3.7% Asian alone 114,022 1.6% Two or more races 18,596 0.3% American Indian alone 11,685 0.2% Other race alone 3,380 0.05% Native Hawaiian and Other
5,095,130 58.7% White alone 1,594,785 18.4% Black alone 905,750 10.4% Hispanic 602,881 6.9% Asian alone 406,047 4.7% Two or more races 60,419 0.7% Other race alone 11,738 0.1% American Indian alone 6,869 0.08% Native Hawaiian and Other
Income and house value in Long Branch Median household income in 2022 $185,114 White non-Hispanic householdersover $200,000 Black householders$145,487 Asian householdersover $200,000 Some other race householders$168,713 Hispanic or Latino race householders
Median age by race in Long Branch
46.9 Median age for White residents47.3 44.3 40.1 Median age for Black or African American residents30.6 52.8 -682,215,742.8 Median age for American Indian / Alaska Native residents-682,352,940.5 -687,861,271.0 47.7 Median age for Asian residents45.8 53.4 -611,955,419.9 Median age for Native Hawaiian / Pacific Islander residents-541,531,822.5 -714,150,046.8 32.3 Median age for Other race residents31.9 40.7 16.0 Median age for Two or more races residents10.6 35.8 46.7 Median age for White alone residents47.1 46.1 31.6 Median age for Hispanic or Latino residents31.4 31.6
Owner/renter occupied households by race in Long Branch
House owners and renters - White residents 1,596 85.6% Owner occupied269 14.4% Renter occupiedHouse owners and renters - Black or African American residents 38 47.6% Owner occupied42 52.4% Renter occupiedHouse owners and renters - American Indian / Alaska Native residents 50 100.0% Owner occupiedHouse owners and renters - Asian residents 391 79.4% Owner occupied101 20.6% Renter occupiedHouse owners and renters - Other race residents 141 76.2% Owner occupied44 23.8% Renter occupiedHouse owners and renters - Two or more races residents 32 100.0% Owner occupiedHouse owners and renters - White alone residents 1,482 85.9% Owner occupied243 14.1% Renter occupiedHouse owners and renters - Hispanic or Latino residents 289 79.5% Owner occupied74 20.5% Renter occupied
Language usage in Long Branch
English speakers - Total 73.0% of residents of Long Branch speak English at home.
6.7% of residents speak Spanish at home 375 73.5% Speak English very well135 26.5% Speak English less than very well20.7% of residents speak other language at home 1,057 67.5% Speak English very well510 32.5% Speak English less than very well
English speakers - Born in the United States 94.7% of residents of Long Branch speak English at home.
0.2% of residents speak Spanish at home 8 100.0% Speak English very well4.9% of residents speak other language at home 159 100.0% Speak English very well
English speakers - Native, born elsewhere 78.3% of residents of Long Branch speak English at home.
7.9% of residents speak Spanish at home 24 100.0% Speak English very well12.2% of residents speak other language at home 37 100.0% Speak English very well
English speakers - Foreign-born 16.6% of residents of Long Branch speak English at home.
20.1% of residents speak Spanish at home 235 64.0% Speak English very well132 36.0% Speak English less than very well64.1% of residents speak other language at home 688 58.9% Speak English very well480 41.1% Speak English less than very well
White (Caucasian) - Speak only English Native:
98.3% (4,476)Foreign-born:
45.1% (144)
White (Caucasian) - Speak another language Native:
2.0% (93)Foreign-born:
58.6% (187)
Black or African American - Speak another language Native:
23.8% (53)Foreign-born:
100.0% (46)
Asian - Speak only English Native:
41.1% (141)Foreign-born:
13.0% (135)
Asian - Speak another language Native:
60.8% (208)Foreign-born:
86.9% (907)
Other race - Speak only English Native:
44.7% (88)Foreign-born:
3.4% (10)
Other race - Speak another language Native:
55.1% (109)Foreign-born:
95.6% (289)
Two or more races - Speak another language Native:
24.6% (101)Foreign-born:
100.0% (34)
White alone - Speak only English Native:
98.2% (4,240)Foreign-born:
39.0% (109)
White alone - Speak another language Native:
1.8% (78)Foreign-born:
60.5% (169)
Hispanic or Latino - Speak only English Native:
71.5% (480)Foreign-born:
13.5% (60)
Hispanic or Latino - Speak another language Native:
29.5% (198)Foreign-born:
86.9% (385)
Foreign-born residents in Long Branch
Marital status for residents in Long Branch Marital status - White (Caucasian) population 15 years and over
Males 25.6% Never married66.5% Now married0.0% Separated3.8% Widowed4.2% DivorcedFemales 21.6% Never married58.3% Now married1.6% Separated10.5% Widowed8.1% DivorcedWomen who gave birth in the past 12 months Now married:
100.0% (15)Unmarried:
0.0% (0)
Women who did not give birth in the past 12 months Now married:
48.7% (474)Unmarried:
51.3% (500)
Marital status - Black or African American population 15 years and over
Males 53.1% Never married46.9% Now married0.0% Separated0.0% Widowed0.0% DivorcedFemales 24.0% Never married52.9% Now married4.8% Separated0.0% Widowed18.3% DivorcedWomen who did not give birth in the past 12 months Now married:
34.2% (13)Unmarried:
65.8% (25)
Marital status - American Indian / Alaska Native population 15 years and over
Males 0.0% Never married0.0% Now married100.0% Separated0.0% Widowed0.0% DivorcedFemales 0.0% Never married0.0% Now married0.0% Separated0.0% Widowed100.0% DivorcedMarital status - Asian population 15 years and over
Males 25.4% Never married74.6% Now married0.0% Separated0.0% Widowed0.0% DivorcedFemales 11.3% Never married61.9% Now married1.6% Separated16.4% Widowed8.8% DivorcedWomen who did not give birth in the past 12 months Now married:
80.4% (188)Unmarried:
19.6% (46)
Marital status - Other race population 15 years and over
Males 28.7% Never married64.1% Now married7.2% Separated0.0% Widowed0.0% DivorcedFemales 45.7% Never married54.3% Now married0.0% Separated0.0% Widowed0.0% DivorcedWomen who did not give birth in the past 12 months Now married:
31.2% (38)Unmarried:
68.8% (84)
Marital status - Two or more races population 15 years and over
Males 73.1% Never married26.9% Now married0.0% Separated0.0% Widowed0.0% DivorcedFemales 22.6% Never married77.4% Now married0.0% Separated0.0% Widowed0.0% DivorcedWomen who gave birth in the past 12 months Now married:
100.0% (22)Unmarried:
0.0% (0)
Women who did not give birth in the past 12 months Now married:
56.0% (57)Unmarried:
44.0% (45)
Marital status - White alone, not Hispanic / Latino population 15 years and over
Males 22.9% Never married68.4% Now married0.0% Separated4.1% Widowed4.5% DivorcedFemales 19.8% Never married60.7% Now married0.5% Separated11.6% Widowed7.3% DivorcedWomen who gave birth in the past 12 months Now married:
100.0% (16)Unmarried:
0.0% (0)
Women who did not give birth in the past 12 months Now married:
49.9% (439)Unmarried:
50.1% (441)
Marital status - Hispanic or Latino population 15 years and over
Males 40.6% Never married53.1% Now married6.2% Separated0.0% Widowed0.0% DivorcedFemales 40.9% Never married45.6% Now married5.7% Separated0.0% Widowed7.8% DivorcedWomen who did not give birth in the past 12 months Now married:
32.8% (89)Unmarried:
67.2% (183)
Ancestries in Long Branch
291 7.5% English275 7.1% Irish144 3.7% German117 3.0% Italian114 2.9% Armenian89 2.3% European89 2.3% Polish71 1.8% Sudanese66 1.7% Lebanese52 1.3% American39 1.0% Northern European38 1.0% Russian38 1.0% Slovak33 0.8% Eastern European29 0.7% Iranian23 0.6% Canadian20 0.5% Norwegian20 0.5% Ukrainian18 0.5% Scotch-Irish14 0.4% Yugoslavian13 0.3% French Canadian11 0.3% Turkish9 0.2% Moroccan7 0.2% Greek7 0.2% Scottish7 0.2% Nigerian6 0.2% Dutch6 0.2% French5 0.1% British5 0.1% Portuguese4 0.1% Ghanaian
Children Nativity (place of birth) in Long Branch
Children under 6 years - Living with two parents Both parents native 195 100.0% Native0 0.0% Foreign-bornBoth parents foreign-born 9 49.4% Native9 50.6% Foreign-bornChildren under 6 years - Living with one parent Native parent 28 100.0% NativeForeign-born parent 9 100.0% NativeChildren 6 to 17 years - Living with two parents Both parents native 589 95.9% Native25 4.1% Foreign-bornBoth parents foreign-born 228 86.3% Native36 13.7% Foreign-bornOne native, one foreign-born parent 434 100.0% NativeChildren 6 to 17 years - Living with one parent Native parent 167 100.0% NativeForeign-born parent 54 49.9% Native54 50.1% Foreign-born
Grandparents responsible for own grandchildren in Long Branch
Grandparents (30 to 59 years) White / Caucasian 31 100.0% Not responsible for grandchildrenOther race 14 100.0% Not responsible for grandchildrenWhite alone, not Hispanic / Latino 14 100.0% Not responsible for grandchildrenHispanic or Latino 28 100.0% Not responsible for grandchildren
Grandparents (60 years and over) White / Caucasian 81 100.0% Not responsible for grandchildrenWhite alone, not Hispanic / Latino 86 100.0% Not responsible for grandchildren