Races in Londontowne, Maryland (MD) Detailed Stats
Ancestries, Foreign-born residents, place of birth

Recent posts about races in Londontowne, Maryland on our local forum with over 2,400,000 registered users:
 | Edgewater insights please (25 replies) |
| Shadyside area? (6 replies) |
| Help! Need Advice & Roommate (0 replies) |
2.4% of Londontowne, MD residents are foreign-born (1.3% born in Europe, 0.6% born in Asia, 0.4% born in Latin America), which is 564.0% less than the foreign-born rate of 16.0% across the entire state of Maryland.
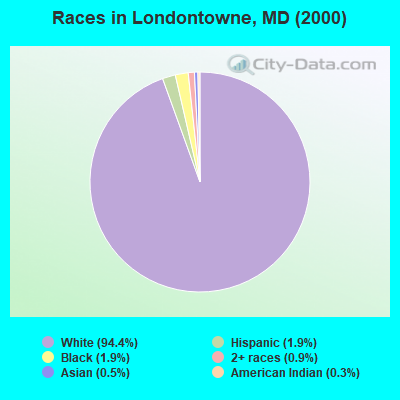
Race distribution in Londontowne

- 7,16994.4%White alone
- 1451.9%Black alone
- 1481.9%Hispanic
- 700.9%Two or more races
- 370.5%Asian alone
- 210.3%American Indian alone
- 40.05%Other race alone
- 10.01%Native Hawaiian and Other
Pacific Islander alone
2000
2022
-
- 3,286,54762.1%White alone
- 1,464,73527.7%Black alone
- 227,9164.3%Hispanic
- 209,7384.0%Asian alone
- 82,9461.6%Two or more races
- 13,3120.3%American Indian alone
- 9,3790.2%Other race alone
- 1,9130.04%Native Hawaiian and Other
Pacific Islander alone

-
- 2,906,49247.1%White alone
- 1,800,91429.2%Black alone
- 705,84211.4%Hispanic
- 401,8186.5%Asian alone
- 291,3174.7%Two or more races
- 46,9300.8%Other race alone
- 8,9300.1%American Indian alone
- 2,4170.04%Native Hawaiian and Other
Pacific Islander alone

Income and house value in Londontowne
- Median household income in 2022
- $121,235White non-Hispanic householders
- $97,857Black householders
- over $200,000Asian householders
- $26,946Two or more races householders
- $132,386Hispanic or Latino race householders
- Median 2022 house value
- $428,572White Non-Hispanic householders
- over $1,000,000Black or African American householders
- $688,674Asian householders
- $420,743Hispanic or Latino householders
Household income for White non-Hispanic householders

Household income for Black householders

Household income for Asian householders

Household income for Two or more races householders

Household income for Hispanic or Latino race householders

Foreign-born residents in Londontowne
183 residents are foreign born (1.3% Europe, 0.6% Asia, 0.4% Latin America).
| This city: | 2.4% |
| Maryland: | 9.8% |
Ancestries in Londontowne

- 1,55218.7%German
- 1,50318.1%Irish
- 1,05112.7%English
- 99712.0%Other
- 7639.2%Italian
- 7278.8%United States
- 2763.3%French
- 2593.1%Polish
- 1882.3%Scotch-Irish
- 1762.1%Scottish
- 1241.5%Welsh
- 1201.4%Dutch
- 1181.4%Norwegian
- 851.0%Swedish
- 510.6%French Canadian
- 480.6%Hungarian
- 470.6%Greek
- 470.6%Slovak
- 360.4%Subsaharan African
- 320.4%Russian
- 300.4%Portuguese
- 160.2%Danish
- 150.2%Arab
- 90.1%Lithuanian
- 70.08%West Indian
- 50.06%Czech

Zip codes: 21037.