Races in Loganville, Georgia (GA) Detailed Stats
Data:
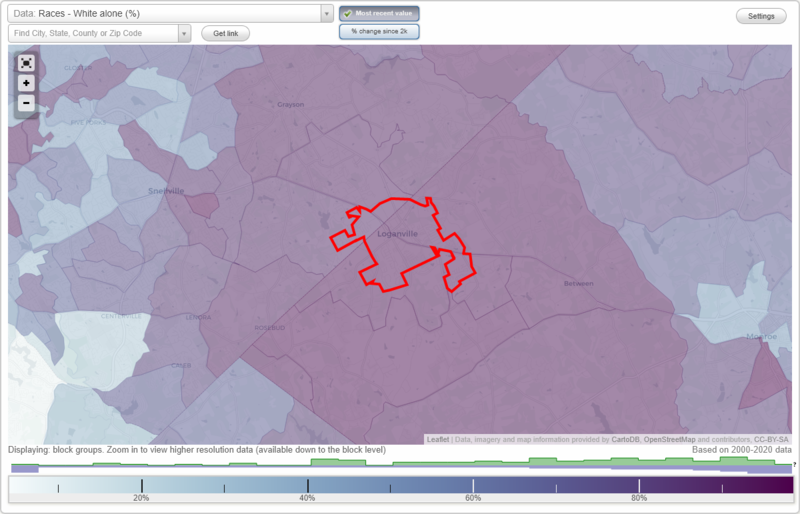
Races - White alone (%)
Races - White alone (% change since 2000)
Races - Black alone (%)
Races - Black alone (% change since 2000)
Races - American Indian alone (%)
Races - American Indian alone (% change since 2000)
Races - Asian alone (%)
Races - Asian alone (% change since 2000)
Races - Hispanic (%)
Races - Hispanic (% change since 2000)
Races - Native Hawaiian and Other Pacific Islander alone (%)
Races - Native Hawaiian and Other Pacific Islander alone (% change since 2000)
Races - Two or more races(%)
Races - Two or more races(% change since 2000)
Races - Other race alone (%)
Races - Other race alone (% change since 2000)
Racial diversity
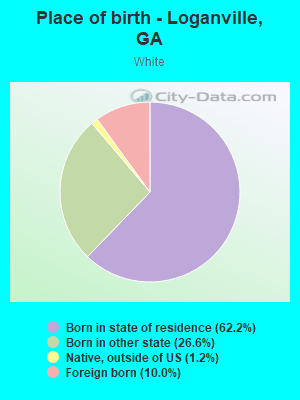
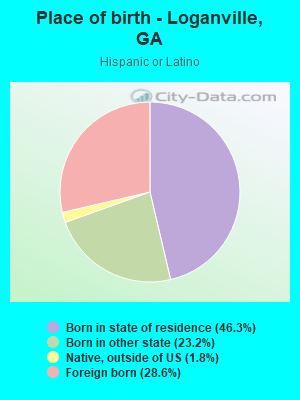
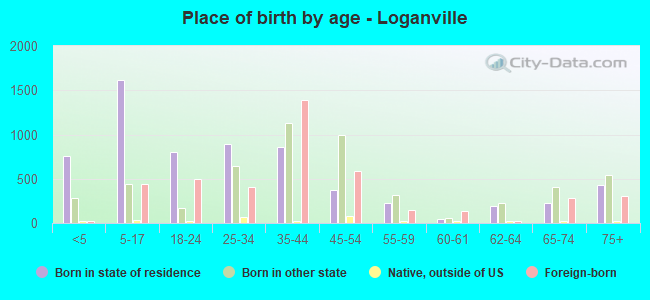
Place of birth - Born in state of residence (%)
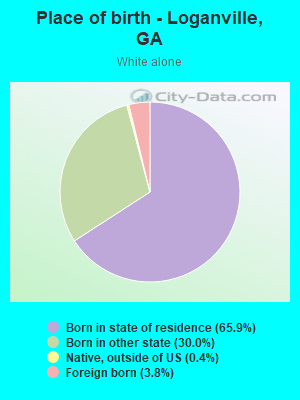
Place of birth - Born in state of residence (%) - White
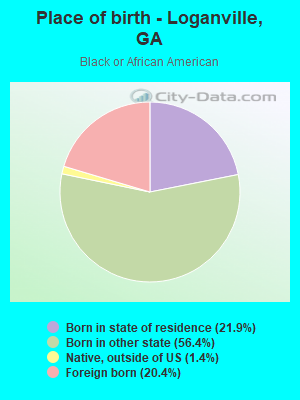
Place of birth - Born in state of residence (%) - Black or African American
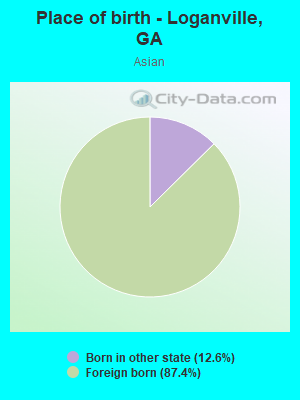
Place of birth - Born in state of residence (%) - Asian
Place of birth - Born in state of residence (%) - Hispanic or Latino
Place of birth - Born in state of residence (%) - American Indian and Alaska Native
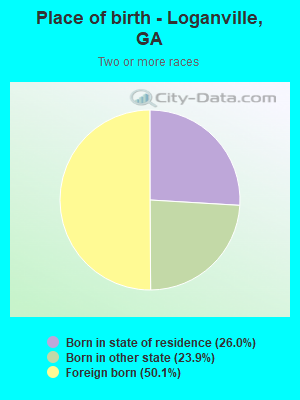
Place of birth - Born in state of residence (%) - Multirace
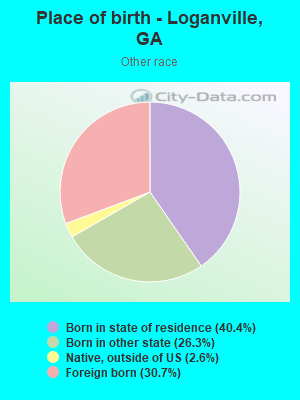
Place of birth - Born in state of residence (%) - Other Race
Place of birth - Born in other state (%)
Place of birth - Born in other state (%) - White
Place of birth - Born in other state (%) - Black or African American
Place of birth - Born in other state (%) - Asian
Place of birth - Born in other state (%) - Hispanic or Latino
Place of birth - Born in other state (%) - American Indian and Alaska Native
Place of birth - Born in other state (%) - Multirace
Place of birth - Born in other state (%) - Other Race
Place of birth - Native, outside of US (%)
Place of birth - Native, outside of US (%) - White
Place of birth - Native, outside of US (%) - Black or African American
Place of birth - Native, outside of US (%) - Asian
Place of birth - Native, outside of US (%) - Hispanic or Latino
Place of birth - Native, outside of US (%) - American Indian and Alaska Native
Place of birth - Native, outside of US (%) - Multirace
Place of birth - Native, outside of US (%) - Other Race
Place of birth - Foreign born (%)
Place of birth - Foreign born (%) - White
Place of birth - Foreign born (%) - Black or African American
Place of birth - Foreign born (%) - Asian
Place of birth - Foreign born (%) - Hispanic or Latino
Place of birth - Foreign born (%) - American Indian and Alaska Native
Place of birth - Foreign born (%) - Multirace
Place of birth - Foreign born (%) - Other Race
Residents speaking English at home (%)
Residents speaking English at home - Born in the United States (%)
Residents speaking English at home - Native, born elsewhere (%)
Residents speaking English at home - Foreign born (%)
Residents speaking Spanish at home (%)
Residents speaking Spanish at home - Born in the United States (%)
Residents speaking Spanish at home - Native, born elsewhere (%)
Residents speaking Spanish at home - Foreign born (%)
Residents speaking other language at home (%)
Residents speaking other language at home - Born in the United States (%)
Residents speaking other language at home - Native, born elsewhere (%)
Residents speaking other language at home - Foreign born (%)
Marital status - Never married (%)
Marital status - Now married (%)
Marital status - Separated (%)
Marital status - Widowed (%)
Marital status - Divorced (%)
Ancestries Reported - Arab (%)
Ancestries Reported - Czech (%)
Ancestries Reported - Danish (%)
Ancestries Reported - Dutch (%)
Ancestries Reported - English (%)
Ancestries Reported - French (%)
Ancestries Reported - French Canadian (%)
Ancestries Reported - German (%)
Ancestries Reported - Greek (%)
Ancestries Reported - Hungarian (%)
Ancestries Reported - Irish (%)
Ancestries Reported - Italian (%)
Ancestries Reported - Lithuanian (%)
Ancestries Reported - Norwegian (%)
Ancestries Reported - Polish (%)
Ancestries Reported - Portuguese (%)
Ancestries Reported - Russian (%)
Ancestries Reported - Scotch-Irish (%)
Ancestries Reported - Scottish (%)
Ancestries Reported - Slovak (%)
Ancestries Reported - Subsaharan African (%)
Ancestries Reported - Swedish (%)
Ancestries Reported - Swiss (%)
Ancestries Reported - Ukrainian (%)
Ancestries Reported - United States (%)
Ancestries Reported - Welsh (%)
Ancestries Reported - West Indian (%)
Ancestries Reported - Other (%)
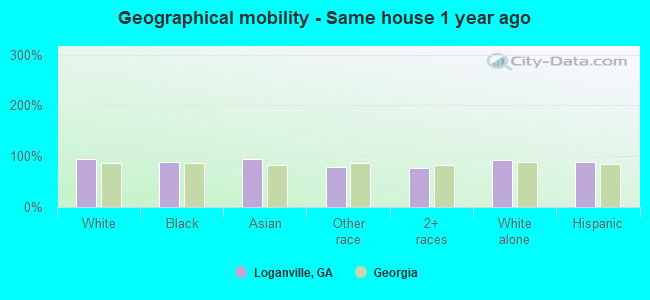
Geographical mobility - Same house 1 year ago (%)
Geographical mobility - Same house 1 year ago (%) - White
Geographical mobility - Same house 1 year ago (%) - Black or African American
Geographical mobility - Same house 1 year ago (%) - Asian
Geographical mobility - Same house 1 year ago (%) - Hispanic or Latino
Geographical mobility - Same house 1 year ago (%) - American Indian and Alaska Native
Geographical mobility - Same house 1 year ago (%) - Multirace
Geographical mobility - Same house 1 year ago (%) - Other Race
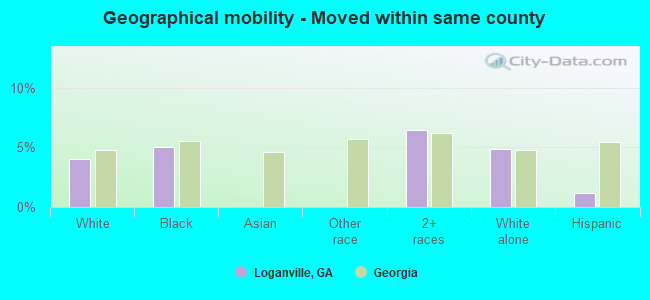
Geographical mobility - Moved within same county (%)
Geographical mobility - Moved within same county (%) - White
Geographical mobility - Moved within same county (%) - Black or African American
Geographical mobility - Moved within same county (%) - Asian
Geographical mobility - Moved within same county (%) - Hispanic or Latino
Geographical mobility - Moved within same county (%) - American Indian and Alaska Native
Geographical mobility - Moved within same county (%) - Multirace
Geographical mobility - Moved within same county (%) - Other Race
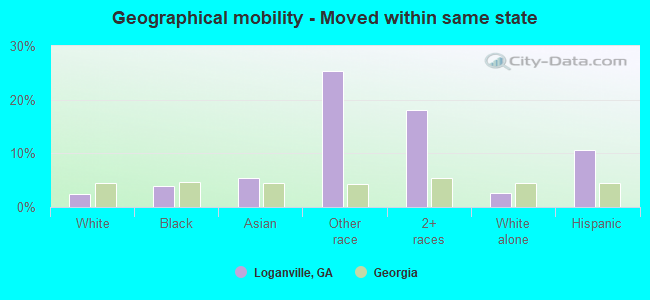
Geographical mobility - Moved from different county within same state (%)
Geographical mobility - Moved from different county within same state (%) - White
Geographical mobility - Moved from different county within same state (%) - Black or African American
Geographical mobility - Moved from different county within same state (%) - Asian
Geographical mobility - Moved from different county within same state (%) - Hispanic or Latino
Geographical mobility - Moved from different county within same state (%) - American Indian and Alaska Native
Geographical mobility - Moved from different county within same state (%) - Multirace
Geographical mobility - Moved from different county within same state (%) - Other Race
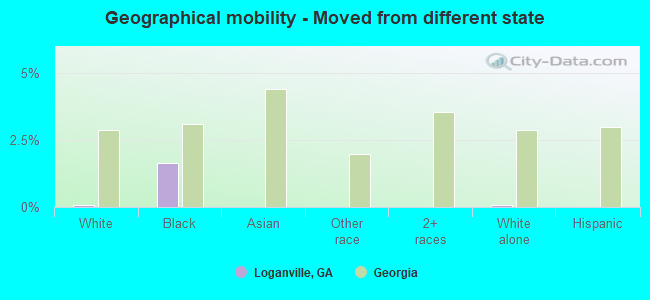
Geographical mobility - Moved from different state (%)
Geographical mobility - Moved from different state (%) - White
Geographical mobility - Moved from different state (%) - Black or African American
Geographical mobility - Moved from different state (%) - Asian
Geographical mobility - Moved from different state (%) - Hispanic or Latino
Geographical mobility - Moved from different state (%) - American Indian and Alaska Native
Geographical mobility - Moved from different state (%) - Multirace
Geographical mobility - Moved from different state (%) - Other Race
Geographical mobility - Moved from abroad (%)
Geographical mobility - Moved from abroad (%) - White
Geographical mobility - Moved from abroad (%) - Black or African American
Geographical mobility - Moved from abroad (%) - Asian
Geographical mobility - Moved from abroad (%) - Hispanic or Latino
Geographical mobility - Moved from abroad (%) - American Indian and Alaska Native
Geographical mobility - Moved from abroad (%) - Multirace
Geographical mobility - Moved from abroad (%) - Other Race
Place of birth for the foreign-born population - Ireland (%)
Place of birth for the foreign-born population - Denmark (%)
Place of birth for the foreign-born population - Norway (%)
Place of birth for the foreign-born population - Sweden (%)
Place of birth for the foreign-born population - United Kingdom (%)
Place of birth for the foreign-born population - England (%)
Place of birth for the foreign-born population - Scotland (%)
Place of birth for the foreign-born population - Other Northern Europe (%)
Place of birth for the foreign-born population - Austria (%)
Place of birth for the foreign-born population - Belgium (%)
Place of birth for the foreign-born population - France (%)
Place of birth for the foreign-born population - Germany (%)
Place of birth for the foreign-born population - Netherlands (%)
Place of birth for the foreign-born population - Switzerland (%)
Place of birth for the foreign-born population - Other Western Europe (%)
Place of birth for the foreign-born population - Greece (%)
Place of birth for the foreign-born population - Italy (%)
Place of birth for the foreign-born population - Portugal (%)
Place of birth for the foreign-born population - Spain (%)
Place of birth for the foreign-born population - Other Southern Europe (%)
Place of birth for the foreign-born population - Albania (%)
Place of birth for the foreign-born population - Belarus (%)
Place of birth for the foreign-born population - Bosnia and Herzegovina (%)
Place of birth for the foreign-born population - Bulgaria (%)
Place of birth for the foreign-born population - Croatia (%)
Place of birth for the foreign-born population - Czechoslovakia (%)
Place of birth for the foreign-born population - Hungary (%)
Place of birth for the foreign-born population - Latvia (%)
Place of birth for the foreign-born population - Lithuania (%)
Place of birth for the foreign-born population - North Macedonia (Macedonia) (%)
Place of birth for the foreign-born population - Moldova (%)
Place of birth for the foreign-born population - Poland (%)
Place of birth for the foreign-born population - Romania (%)
Place of birth for the foreign-born population - Russia (%)
Place of birth for the foreign-born population - Serbia (%)
Place of birth for the foreign-born population - Ukraine (%)
Place of birth for the foreign-born population - Other Eastern Europe (%)
Place of birth for the foreign-born population - China (%)
Place of birth for the foreign-born population - Hong Kong (%)
Place of birth for the foreign-born population - Taiwan (%)
Place of birth for the foreign-born population - Japan (%)
Place of birth for the foreign-born population - Korea (%)
Place of birth for the foreign-born population - Other Eastern Asia (%)
Place of birth for the foreign-born population - Afghanistan (%)
Place of birth for the foreign-born population - Bangladesh (%)
Place of birth for the foreign-born population - India (%)
Place of birth for the foreign-born population - Iran (%)
Place of birth for the foreign-born population - Kazakhstan (%)
Place of birth for the foreign-born population - Nepal (%)
Place of birth for the foreign-born population - Pakistan (%)
Place of birth for the foreign-born population - Sri Lanka (%)
Place of birth for the foreign-born population - Uzbekistan (%)
Place of birth for the foreign-born population - Other South Central Asia (%)
Place of birth for the foreign-born population - Burma (%)
Place of birth for the foreign-born population - Cambodia (%)
Place of birth for the foreign-born population - Indonesia (%)
Place of birth for the foreign-born population - Laos (%)
Place of birth for the foreign-born population - Malaysia (%)
Place of birth for the foreign-born population - Philippines (%)
Place of birth for the foreign-born population - Singapore (%)
Place of birth for the foreign-born population - Thailand (%)
Place of birth for the foreign-born population - Vietnam (%)
Place of birth for the foreign-born population - Other South Eastern Asia (%)
Place of birth for the foreign-born population - Armenia (%)
Place of birth for the foreign-born population - Iraq (%)
Place of birth for the foreign-born population - Israel (%)
Place of birth for the foreign-born population - Jordan (%)
Place of birth for the foreign-born population - Kuwait (%)
Place of birth for the foreign-born population - Lebanon (%)
Place of birth for the foreign-born population - Saudi Arabia (%)
Place of birth for the foreign-born population - Syria (%)
Place of birth for the foreign-born population - Turkey (%)
Place of birth for the foreign-born population - Yemen (%)
Place of birth for the foreign-born population - Other Western Asia (%)
Place of birth for the foreign-born population - Eritrea (%)
Place of birth for the foreign-born population - Ethiopia (%)
Place of birth for the foreign-born population - Kenya (%)
Place of birth for the foreign-born population - Somalia (%)
Place of birth for the foreign-born population - Uganda (%)
Place of birth for the foreign-born population - Zimbabwe (%)
Place of birth for the foreign-born population - Other Eastern Africa (%)
Place of birth for the foreign-born population - Cameroon (%)
Place of birth for the foreign-born population - Congo (%)
Place of birth for the foreign-born population - Democratic Republic of Congo (Zaire) (%)
Place of birth for the foreign-born population - Other Middle Africa (%)
Place of birth for the foreign-born population - Egypt (%)
Place of birth for the foreign-born population - Morocco (%)
Place of birth for the foreign-born population - Sudan (%)
Place of birth for the foreign-born population - Other Northern Africa (%)
Place of birth for the foreign-born population - South Africa (%)
Place of birth for the foreign-born population - Other Southern Africa (%)
Place of birth for the foreign-born population - Cabo Verde (%)
Place of birth for the foreign-born population - Ghana (%)
Place of birth for the foreign-born population - Liberia (%)
Place of birth for the foreign-born population - Nigeria (%)
Place of birth for the foreign-born population - Senegal (%)
Place of birth for the foreign-born population - Sierra Leone (%)
Place of birth for the foreign-born population - Other Western Africa (%)
Place of birth for the foreign-born population - Australia (%)
Place of birth for the foreign-born population - New Zealand (%)
Place of birth for the foreign-born population - Fiji (%)
Place of birth for the foreign-born population - Micronesia (%)
Place of birth for the foreign-born population - Bahamas (%)
Place of birth for the foreign-born population - Barbados (%)
Place of birth for the foreign-born population - Cuba (%)
Place of birth for the foreign-born population - Dominica (%)
Place of birth for the foreign-born population - Dominican Republic (%)
Place of birth for the foreign-born population - Grenada (%)
Place of birth for the foreign-born population - Haiti (%)
Place of birth for the foreign-born population - Jamaica (%)
Place of birth for the foreign-born population - St. Vincent and the Grenadines (%)
Place of birth for the foreign-born population - Trinidad and Tobago (%)
Place of birth for the foreign-born population - West Indies (%)
Place of birth for the foreign-born population - Other Caribbean (%)
Place of birth for the foreign-born population - Belize (%)
Place of birth for the foreign-born population - Costa Rica (%)
Place of birth for the foreign-born population - El Salvador (%)
Place of birth for the foreign-born population - Guatemala (%)
Place of birth for the foreign-born population - Honduras (%)
Place of birth for the foreign-born population - Mexico (%)
Place of birth for the foreign-born population - Nicaragua (%)
Place of birth for the foreign-born population - Panama (%)
Place of birth for the foreign-born population - Other Central America (%)
Place of birth for the foreign-born population - Argentina (%)
Place of birth for the foreign-born population - Bolivia (%)
Place of birth for the foreign-born population - Brazil (%)
Place of birth for the foreign-born population - Chile (%)
Place of birth for the foreign-born population - Colombia (%)
Place of birth for the foreign-born population - Ecuador (%)
Place of birth for the foreign-born population - Guyana (%)
Place of birth for the foreign-born population - Peru (%)
Place of birth for the foreign-born population - Uruguay (%)
Place of birth for the foreign-born population - Venezuela (%)
Place of birth for the foreign-born population - Other South America (%)
Place of birth for the foreign-born population - Canada (%)
Place of birth for the foreign-born population - Other Northern America (%)
Place of birth for the foreign-born population - Other (%)
Latest news about races in Loganville, GA collected exclusively by city-data.com from local newspapers, TV, and radio stations
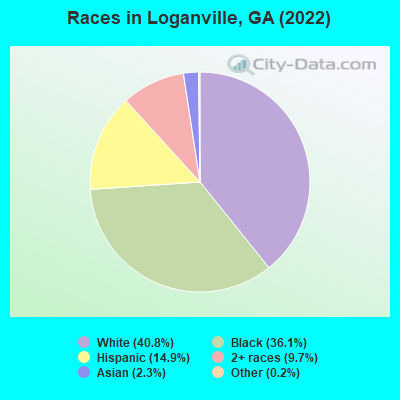
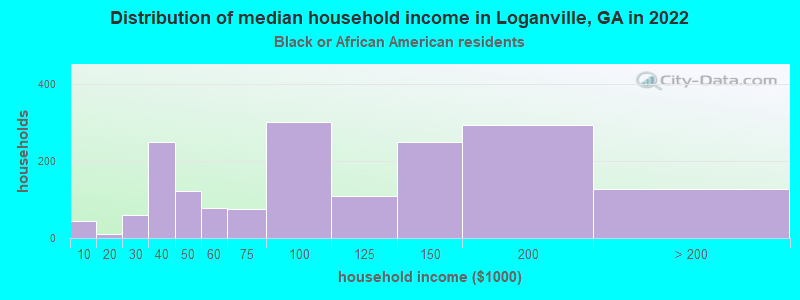
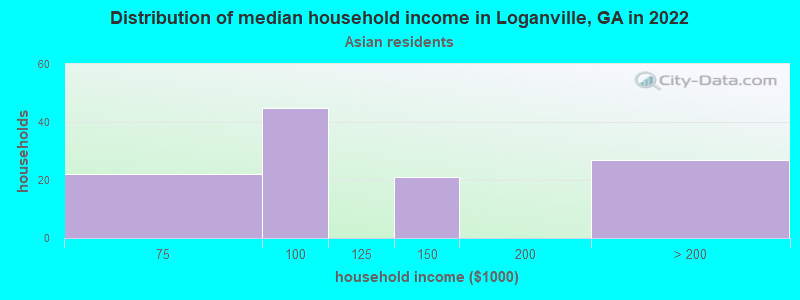
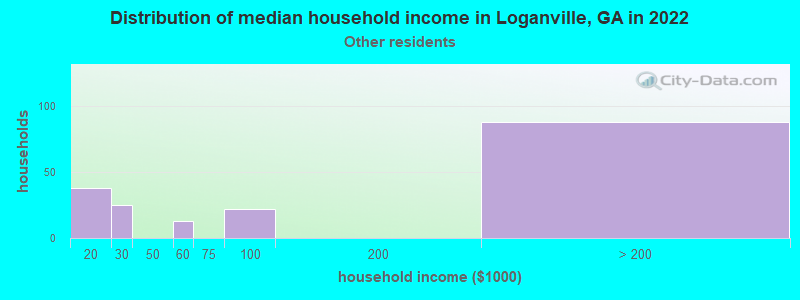
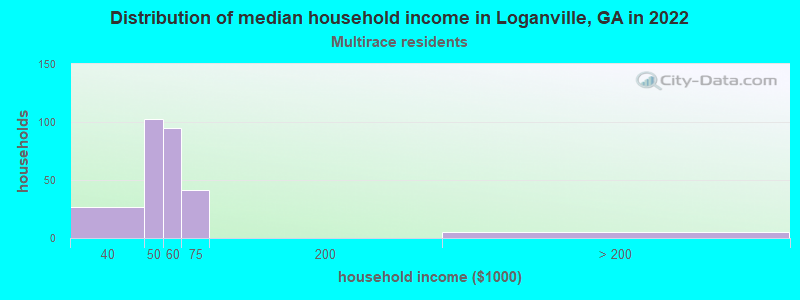
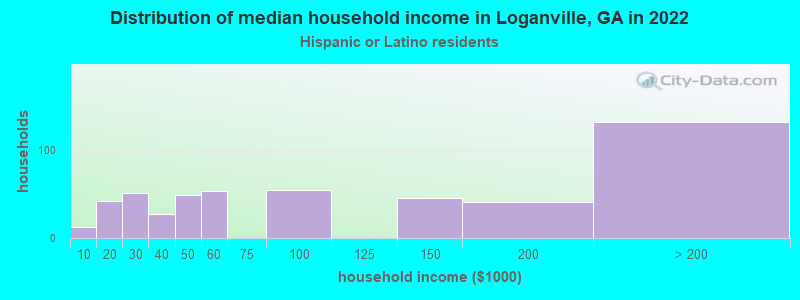
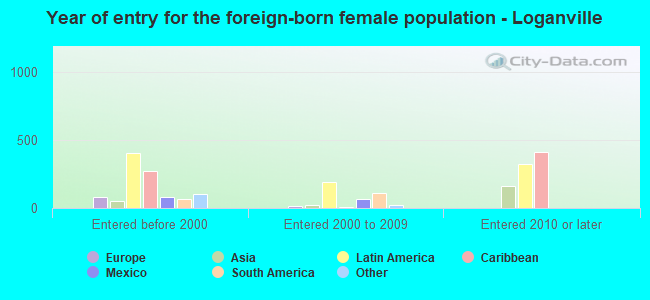
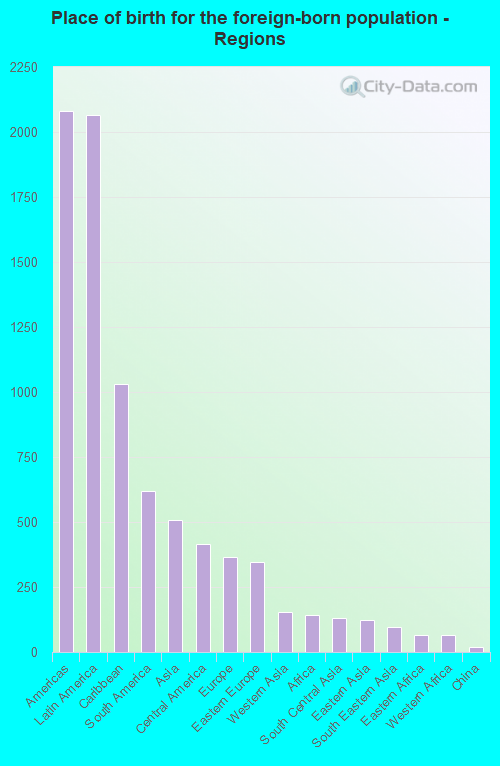
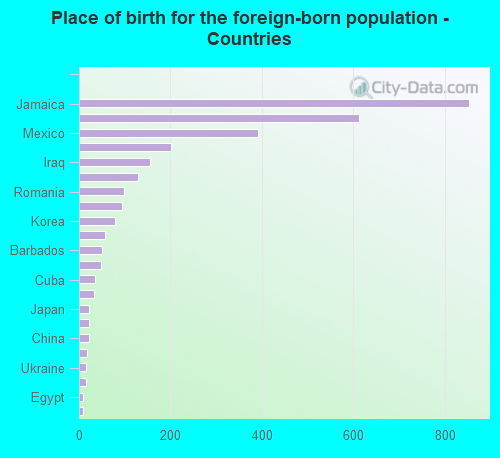
According to 2022 data, the most numerous races in Loganville, GA are White alone (6,150 residents), Black alone (5,436 residents), and Hispanic (2,245 residents). 83.1% of Loganville residents speak English at home. 20.5% of Loganville, GA residents are foreign-born (13.9% born in Latin America, 3.4% born in Asia, 2.4% born in Europe), which is 51.3% greater than the foreign-born rate of 10.0% across the entire state of Georgia.
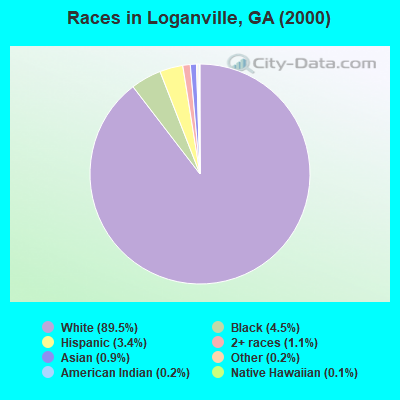
Race distribution in Loganville
2000 2022
5,128,661 62.6% White alone 2,331,465 28.5% Black alone 435,227 5.3% Hispanic 171,513 2.1% Asian alone 87,364 1.1% Two or more races 17,670 0.2% American Indian alone 11,275 0.1% Other race alone 3,278 0.04% Native Hawaiian and Other
5,415,657 49.6% White alone 3,349,240 30.7% Black alone 1,132,604 10.4% Hispanic 479,156 4.4% Asian alone 462,923 4.2% Two or more races 54,416 0.5% Other race alone 11,923 0.1% American Indian alone 6,957 0.06% Native Hawaiian and Other
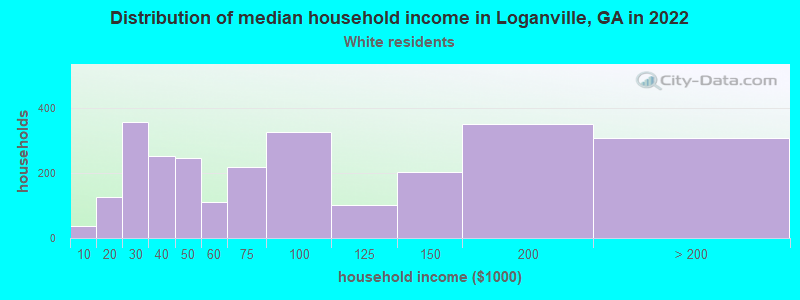
Income and house value in Loganville Median household income in 2022 $74,725 White non-Hispanic householders$126,057 Black householders$103,765 Asian householders$60,956 Two or more races householdersMedian 2022 house value $341,998 White Non-Hispanic householders$357,892 Black or African American householders$331,109 American Indian or Alaska Native householders $360,540 Asian householders$331,109 Some other race householders$279,603 Two or more races householders$349,651 Hispanic or Latino householders
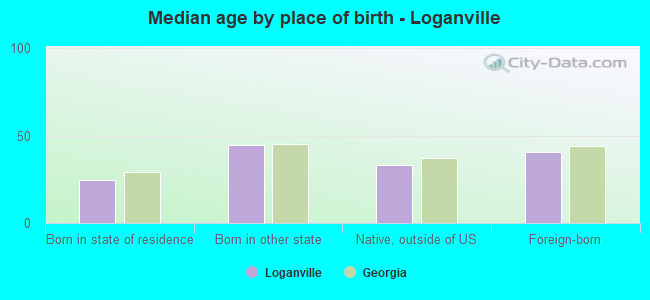
Median age by race in Loganville
41.8 Median age for White residents39.2 42.4 39.2 Median age for Black or African American residents41.5 35.6 -668,032,786.2 Median age for American Indian / Alaska Native residents-662,121,211.5 -666,666,666.0 63.9 Median age for Asian residents70.8 59.6 -666,666,666.0 Median age for Native Hawaiian / Pacific Islander residents-666,666,666.0 -666,666,666.0 49.3 Median age for Other race residents45.5 48.0 20.0 Median age for Two or more races residents24.3 22.6 41.7 Median age for White alone residents40.9 41.5 39.8 Median age for Hispanic or Latino residents37.1 48.4
Owner/renter occupied households by race in Loganville
House owners and renters - White residents 1,860 70.5% Owner occupied778 29.5% Renter occupiedHouse owners and renters - Black or African American residents 1,625 78.9% Owner occupied435 21.1% Renter occupiedHouse owners and renters - Asian residents 125 100.0% Owner occupiedHouse owners and renters - Other race residents 96 50.1% Owner occupied95 49.9% Renter occupiedHouse owners and renters - Two or more races residents 151 58.2% Owner occupied108 41.8% Renter occupiedHouse owners and renters - White alone residents 1,544 66.7% Owner occupied771 33.3% Renter occupiedHouse owners and renters - Hispanic or Latino residents 679 93.9% Owner occupied44 6.1% Renter occupied
Language usage in Loganville
English speakers - Total 83.1% of residents of Loganville speak English at home.
9.7% of residents speak Spanish at home 883 67.3% Speak English very well429 32.7% Speak English less than very well7.3% of residents speak other language at home 611 62.3% Speak English very well370 37.7% Speak English less than very well
English speakers - Born in the United States 92.7% of residents of Loganville speak English at home.
5.3% of residents speak Spanish at home 229 88.1% Speak English very well31 11.9% Speak English less than very well1.9% of residents speak other language at home 91 100.0% Speak English very well
English speakers - Native, born elsewhere 69.5% of residents of Loganville speak English at home.
31.5% of residents speak Spanish at home 9 14.1% Speak English very well55 85.9% Speak English less than very well
English speakers - Foreign-born 55.0% of residents of Loganville speak English at home.
17.9% of residents speak Spanish at home 216 39.0% Speak English very well338 61.0% Speak English less than very well27.2% of residents speak other language at home 514 60.9% Speak English very well330 39.1% Speak English less than very well
White (Caucasian) - Speak only English Native:
93.4% (5,599)Foreign-born:
8.2% (59)
White (Caucasian) - Speak another language Native:
3.5% (211)Foreign-born:
84.4% (605)
Black or African American - Speak only English Native:
99.2% (3,388)Foreign-born:
88.3% (1,311)
Black or African American - Speak another language Native:
0.7% (23)Foreign-born:
9.9% (147)
Asian - Speak only English Native:
95.7% (59)Foreign-born:
50.0% (213)
Other race - Speak another language Native:
94.7% (480)Foreign-born:
99.0% (253)
Two or more races - Speak only English Native:
100.0% (490)Foreign-born:
45.3% (265)
White alone - Speak only English Native:
97.0% (5,340)Foreign-born:
10.6% (36)
White alone - Speak another language Native:
3.0% (163)Foreign-born:
89.2% (306)
Hispanic or Latino - Speak another language Native:
53.2% (719)Foreign-born:
100.0% (646)
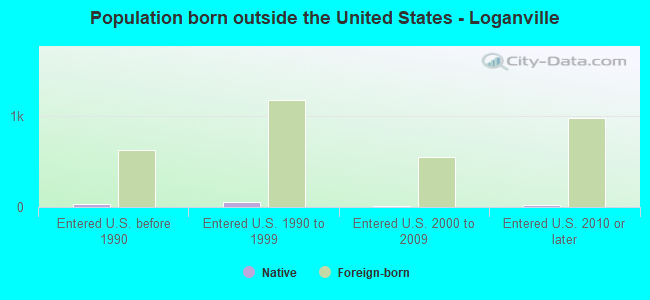
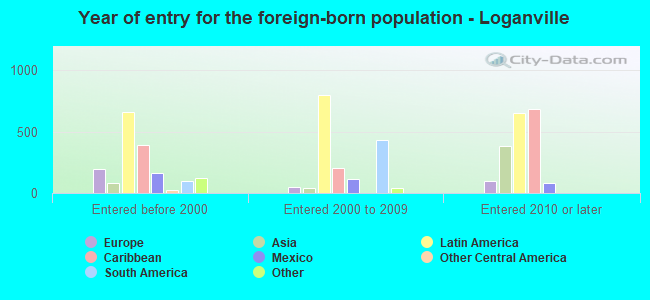
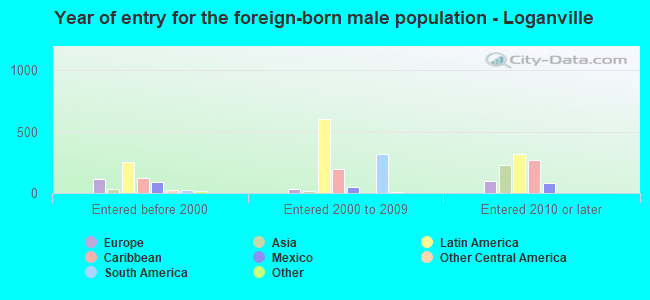
Foreign-born residents in Loganville 3,095 residents are foreign born (13.9% Latin America , 3.4% Asia , 2.4% Europe ).
This city:
20.5%Georgia:
10.4%
Marital status for residents in Loganville Marital status - White (Caucasian) population 15 years and over
Males 31.0% Never married59.7% Now married1.2% Separated0.9% Widowed7.2% DivorcedFemales 25.2% Never married46.4% Now married0.2% Separated12.8% Widowed15.4% DivorcedWomen who gave birth in the past 12 months Now married:
31.2% (38)Unmarried:
68.8% (84)
Women who did not give birth in the past 12 months Now married:
42.9% (684)Unmarried:
57.1% (912)
Marital status - Black or African American population 15 years and over
Males 49.1% Never married46.4% Now married1.0% Separated0.0% Widowed3.4% DivorcedFemales 34.5% Never married38.7% Now married6.8% Separated6.1% Widowed13.9% DivorcedWomen who gave birth in the past 12 months Now married:
100.0% (93)Unmarried:
0.0% (0)
Women who did not give birth in the past 12 months Now married:
43.7% (662)Unmarried:
56.3% (853)
Marital status - Asian population 15 years and over
Males 27.3% Never married67.4% Now married5.3% Separated0.0% Widowed0.0% DivorcedFemales 28.8% Never married44.6% Now married0.0% Separated0.0% Widowed26.5% DivorcedWomen who did not give birth in the past 12 months Now married:
32.4% (59)Unmarried:
67.6% (123)
Marital status - Other race population 15 years and over
Males 22.3% Never married77.7% Now married0.0% Separated0.0% Widowed0.0% DivorcedFemales 32.8% Never married61.6% Now married0.0% Separated0.0% Widowed5.7% DivorcedWomen who did not give birth in the past 12 months Now married:
61.6% (183)Unmarried:
38.4% (114)
Marital status - Two or more races population 15 years and over
Males 52.7% Never married22.7% Now married0.0% Separated0.0% Widowed24.6% DivorcedFemales 58.1% Never married40.1% Now married0.0% Separated1.8% Widowed0.0% DivorcedWomen who gave birth in the past 12 months Now married:
100.0% (7)Unmarried:
0.0% (0)
Women who did not give birth in the past 12 months Now married:
36.5% (167)Unmarried:
63.5% (292)
Marital status - White alone, not Hispanic / Latino population 15 years and over
Males 33.0% Never married57.3% Now married1.4% Separated1.0% Widowed7.2% DivorcedFemales 26.8% Never married45.0% Now married0.2% Separated13.6% Widowed14.4% DivorcedWomen who gave birth in the past 12 months Now married:
33.6% (38)Unmarried:
66.4% (75)
Women who did not give birth in the past 12 months Now married:
41.4% (615)Unmarried:
58.6% (870)
Marital status - Hispanic or Latino population 15 years and over
Males 20.3% Never married75.7% Now married0.0% Separated0.0% Widowed4.0% DivorcedFemales 28.4% Never married56.0% Now married0.0% Separated2.7% Widowed12.9% DivorcedWomen who gave birth in the past 12 months Now married:
35.7% (5)Unmarried:
64.3% (10)
Women who did not give birth in the past 12 months Now married:
54.7% (240)Unmarried:
45.3% (199)
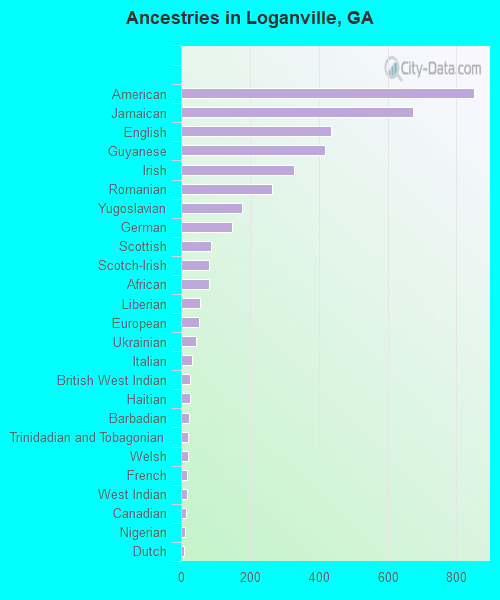
Ancestries in Loganville
852 9.9% American673 7.8% Jamaican437 5.1% English418 4.9% Guyanese328 3.8% Irish265 3.1% Romanian176 2.0% Yugoslavian147 1.7% German87 1.0% Scottish82 1.0% Scotch-Irish81 0.9% African56 0.6% Liberian52 0.6% European43 0.5% Ukrainian33 0.4% Italian25 0.3% British West Indian25 0.3% Haitian22 0.3% Barbadian21 0.2% Trinidadian and Tobagonian19 0.2% Welsh18 0.2% French17 0.2% West Indian14 0.2% Canadian12 0.1% Nigerian10 0.1% Dutch7 0.08% Palestinian
Children Nativity (place of birth) in Loganville
Children under 6 years - Living with two parents Both parents native 424 100.0% NativeBoth parents foreign-born 119 100.0% NativeOne native, one foreign-born parent 162 100.0% NativeChildren under 6 years - Living with one parent Native parent 361 100.0% NativeChildren 6 to 17 years - Living with two parents Both parents native 759 100.0% NativeBoth parents foreign-born 175 44.2% Native220 55.8% Foreign-bornOne native, one foreign-born parent 79 100.0% NativeChildren 6 to 17 years - Living with one parent Native parent 624 100.0% NativeForeign-born parent 141 53.9% Native120 46.1% Foreign-born
Grandparents responsible for own grandchildren in Loganville
Grandparents (30 to 59 years) White / Caucasian 21 15.2% Responsible for grandchildren115 84.8% Not responsible for grandchildrenBlack or African American 16 9.0% Responsible for grandchildren157 91.0% Not responsible for grandchildrenTwo or more races 11 100.0% Not responsible for grandchildrenWhite alone, not Hispanic / Latino 14 13.7% Responsible for grandchildren86 86.3% Not responsible for grandchildrenHispanic or Latino 11 43.8% Responsible for grandchildren14 56.2% Not responsible for grandchildrenGrandparents (60 years and over) White / Caucasian 13 16.2% Responsible for grandchildren69 83.8% Not responsible for grandchildrenBlack or African American 97 100.0% Not responsible for grandchildrenTwo or more races 14 100.0% Not responsible for grandchildrenWhite alone, not Hispanic / Latino 13 19.2% Responsible for grandchildren56 80.8% Not responsible for grandchildrenHispanic or Latino 11 100.0% Not responsible for grandchildren