Races in Lockport, Illinois (IL) Detailed Stats
Data:
Races - White alone (%)
Races - White alone (% change since 2000)
Races - Black alone (%)
Races - Black alone (% change since 2000)
Races - American Indian alone (%)
Races - American Indian alone (% change since 2000)
Races - Asian alone (%)
Races - Asian alone (% change since 2000)
Races - Hispanic (%)
Races - Hispanic (% change since 2000)
Races - Native Hawaiian and Other Pacific Islander alone (%)
Races - Native Hawaiian and Other Pacific Islander alone (% change since 2000)
Races - Two or more races(%)
Races - Two or more races(% change since 2000)
Races - Other race alone (%)
Races - Other race alone (% change since 2000)
Racial diversity
Place of birth - Born in state of residence (%)
Place of birth - Born in state of residence (%) - White
Place of birth - Born in state of residence (%) - Black or African American
Place of birth - Born in state of residence (%) - Asian
Place of birth - Born in state of residence (%) - Hispanic or Latino
Place of birth - Born in state of residence (%) - American Indian and Alaska Native
Place of birth - Born in state of residence (%) - Multirace
Place of birth - Born in state of residence (%) - Other Race
Place of birth - Born in other state (%)
Place of birth - Born in other state (%) - White
Place of birth - Born in other state (%) - Black or African American
Place of birth - Born in other state (%) - Asian
Place of birth - Born in other state (%) - Hispanic or Latino
Place of birth - Born in other state (%) - American Indian and Alaska Native
Place of birth - Born in other state (%) - Multirace
Place of birth - Born in other state (%) - Other Race
Place of birth - Native, outside of US (%)
Place of birth - Native, outside of US (%) - White
Place of birth - Native, outside of US (%) - Black or African American
Place of birth - Native, outside of US (%) - Asian
Place of birth - Native, outside of US (%) - Hispanic or Latino
Place of birth - Native, outside of US (%) - American Indian and Alaska Native
Place of birth - Native, outside of US (%) - Multirace
Place of birth - Native, outside of US (%) - Other Race
Place of birth - Foreign born (%)
Place of birth - Foreign born (%) - White
Place of birth - Foreign born (%) - Black or African American
Place of birth - Foreign born (%) - Asian
Place of birth - Foreign born (%) - Hispanic or Latino
Place of birth - Foreign born (%) - American Indian and Alaska Native
Place of birth - Foreign born (%) - Multirace
Place of birth - Foreign born (%) - Other Race
Residents speaking English at home (%)
Residents speaking English at home - Born in the United States (%)
Residents speaking English at home - Native, born elsewhere (%)
Residents speaking English at home - Foreign born (%)
Residents speaking Spanish at home (%)
Residents speaking Spanish at home - Born in the United States (%)
Residents speaking Spanish at home - Native, born elsewhere (%)
Residents speaking Spanish at home - Foreign born (%)
Residents speaking other language at home (%)
Residents speaking other language at home - Born in the United States (%)
Residents speaking other language at home - Native, born elsewhere (%)
Residents speaking other language at home - Foreign born (%)
Marital status - Never married (%)
Marital status - Now married (%)
Marital status - Separated (%)
Marital status - Widowed (%)
Marital status - Divorced (%)
Ancestries Reported - Arab (%)
Ancestries Reported - Czech (%)
Ancestries Reported - Danish (%)
Ancestries Reported - Dutch (%)
Ancestries Reported - English (%)
Ancestries Reported - French (%)
Ancestries Reported - French Canadian (%)
Ancestries Reported - German (%)
Ancestries Reported - Greek (%)
Ancestries Reported - Hungarian (%)
Ancestries Reported - Irish (%)
Ancestries Reported - Italian (%)
Ancestries Reported - Lithuanian (%)
Ancestries Reported - Norwegian (%)
Ancestries Reported - Polish (%)
Ancestries Reported - Portuguese (%)
Ancestries Reported - Russian (%)
Ancestries Reported - Scotch-Irish (%)
Ancestries Reported - Scottish (%)
Ancestries Reported - Slovak (%)
Ancestries Reported - Subsaharan African (%)
Ancestries Reported - Swedish (%)
Ancestries Reported - Swiss (%)
Ancestries Reported - Ukrainian (%)
Ancestries Reported - United States (%)
Ancestries Reported - Welsh (%)
Ancestries Reported - West Indian (%)
Ancestries Reported - Other (%)
Geographical mobility - Same house 1 year ago (%)
Geographical mobility - Same house 1 year ago (%) - White
Geographical mobility - Same house 1 year ago (%) - Black or African American
Geographical mobility - Same house 1 year ago (%) - Asian
Geographical mobility - Same house 1 year ago (%) - Hispanic or Latino
Geographical mobility - Same house 1 year ago (%) - American Indian and Alaska Native
Geographical mobility - Same house 1 year ago (%) - Multirace
Geographical mobility - Same house 1 year ago (%) - Other Race
Geographical mobility - Moved within same county (%)
Geographical mobility - Moved within same county (%) - White
Geographical mobility - Moved within same county (%) - Black or African American
Geographical mobility - Moved within same county (%) - Asian
Geographical mobility - Moved within same county (%) - Hispanic or Latino
Geographical mobility - Moved within same county (%) - American Indian and Alaska Native
Geographical mobility - Moved within same county (%) - Multirace
Geographical mobility - Moved within same county (%) - Other Race
Geographical mobility - Moved from different county within same state (%)
Geographical mobility - Moved from different county within same state (%) - White
Geographical mobility - Moved from different county within same state (%) - Black or African American
Geographical mobility - Moved from different county within same state (%) - Asian
Geographical mobility - Moved from different county within same state (%) - Hispanic or Latino
Geographical mobility - Moved from different county within same state (%) - American Indian and Alaska Native
Geographical mobility - Moved from different county within same state (%) - Multirace
Geographical mobility - Moved from different county within same state (%) - Other Race
Geographical mobility - Moved from different state (%)
Geographical mobility - Moved from different state (%) - White
Geographical mobility - Moved from different state (%) - Black or African American
Geographical mobility - Moved from different state (%) - Asian
Geographical mobility - Moved from different state (%) - Hispanic or Latino
Geographical mobility - Moved from different state (%) - American Indian and Alaska Native
Geographical mobility - Moved from different state (%) - Multirace
Geographical mobility - Moved from different state (%) - Other Race
Geographical mobility - Moved from abroad (%)
Geographical mobility - Moved from abroad (%) - White
Geographical mobility - Moved from abroad (%) - Black or African American
Geographical mobility - Moved from abroad (%) - Asian
Geographical mobility - Moved from abroad (%) - Hispanic or Latino
Geographical mobility - Moved from abroad (%) - American Indian and Alaska Native
Geographical mobility - Moved from abroad (%) - Multirace
Geographical mobility - Moved from abroad (%) - Other Race
Place of birth for the foreign-born population - Ireland (%)
Place of birth for the foreign-born population - Denmark (%)
Place of birth for the foreign-born population - Norway (%)
Place of birth for the foreign-born population - Sweden (%)
Place of birth for the foreign-born population - United Kingdom (%)
Place of birth for the foreign-born population - England (%)
Place of birth for the foreign-born population - Scotland (%)
Place of birth for the foreign-born population - Other Northern Europe (%)
Place of birth for the foreign-born population - Austria (%)
Place of birth for the foreign-born population - Belgium (%)
Place of birth for the foreign-born population - France (%)
Place of birth for the foreign-born population - Germany (%)
Place of birth for the foreign-born population - Netherlands (%)
Place of birth for the foreign-born population - Switzerland (%)
Place of birth for the foreign-born population - Other Western Europe (%)
Place of birth for the foreign-born population - Greece (%)
Place of birth for the foreign-born population - Italy (%)
Place of birth for the foreign-born population - Portugal (%)
Place of birth for the foreign-born population - Spain (%)
Place of birth for the foreign-born population - Other Southern Europe (%)
Place of birth for the foreign-born population - Albania (%)
Place of birth for the foreign-born population - Belarus (%)
Place of birth for the foreign-born population - Bosnia and Herzegovina (%)
Place of birth for the foreign-born population - Bulgaria (%)
Place of birth for the foreign-born population - Croatia (%)
Place of birth for the foreign-born population - Czechoslovakia (%)
Place of birth for the foreign-born population - Hungary (%)
Place of birth for the foreign-born population - Latvia (%)
Place of birth for the foreign-born population - Lithuania (%)
Place of birth for the foreign-born population - North Macedonia (Macedonia) (%)
Place of birth for the foreign-born population - Moldova (%)
Place of birth for the foreign-born population - Poland (%)
Place of birth for the foreign-born population - Romania (%)
Place of birth for the foreign-born population - Russia (%)
Place of birth for the foreign-born population - Serbia (%)
Place of birth for the foreign-born population - Ukraine (%)
Place of birth for the foreign-born population - Other Eastern Europe (%)
Place of birth for the foreign-born population - China (%)
Place of birth for the foreign-born population - Hong Kong (%)
Place of birth for the foreign-born population - Taiwan (%)
Place of birth for the foreign-born population - Japan (%)
Place of birth for the foreign-born population - Korea (%)
Place of birth for the foreign-born population - Other Eastern Asia (%)
Place of birth for the foreign-born population - Afghanistan (%)
Place of birth for the foreign-born population - Bangladesh (%)
Place of birth for the foreign-born population - India (%)
Place of birth for the foreign-born population - Iran (%)
Place of birth for the foreign-born population - Kazakhstan (%)
Place of birth for the foreign-born population - Nepal (%)
Place of birth for the foreign-born population - Pakistan (%)
Place of birth for the foreign-born population - Sri Lanka (%)
Place of birth for the foreign-born population - Uzbekistan (%)
Place of birth for the foreign-born population - Other South Central Asia (%)
Place of birth for the foreign-born population - Burma (%)
Place of birth for the foreign-born population - Cambodia (%)
Place of birth for the foreign-born population - Indonesia (%)
Place of birth for the foreign-born population - Laos (%)
Place of birth for the foreign-born population - Malaysia (%)
Place of birth for the foreign-born population - Philippines (%)
Place of birth for the foreign-born population - Singapore (%)
Place of birth for the foreign-born population - Thailand (%)
Place of birth for the foreign-born population - Vietnam (%)
Place of birth for the foreign-born population - Other South Eastern Asia (%)
Place of birth for the foreign-born population - Armenia (%)
Place of birth for the foreign-born population - Iraq (%)
Place of birth for the foreign-born population - Israel (%)
Place of birth for the foreign-born population - Jordan (%)
Place of birth for the foreign-born population - Kuwait (%)
Place of birth for the foreign-born population - Lebanon (%)
Place of birth for the foreign-born population - Saudi Arabia (%)
Place of birth for the foreign-born population - Syria (%)
Place of birth for the foreign-born population - Turkey (%)
Place of birth for the foreign-born population - Yemen (%)
Place of birth for the foreign-born population - Other Western Asia (%)
Place of birth for the foreign-born population - Eritrea (%)
Place of birth for the foreign-born population - Ethiopia (%)
Place of birth for the foreign-born population - Kenya (%)
Place of birth for the foreign-born population - Somalia (%)
Place of birth for the foreign-born population - Uganda (%)
Place of birth for the foreign-born population - Zimbabwe (%)
Place of birth for the foreign-born population - Other Eastern Africa (%)
Place of birth for the foreign-born population - Cameroon (%)
Place of birth for the foreign-born population - Congo (%)
Place of birth for the foreign-born population - Democratic Republic of Congo (Zaire) (%)
Place of birth for the foreign-born population - Other Middle Africa (%)
Place of birth for the foreign-born population - Egypt (%)
Place of birth for the foreign-born population - Morocco (%)
Place of birth for the foreign-born population - Sudan (%)
Place of birth for the foreign-born population - Other Northern Africa (%)
Place of birth for the foreign-born population - South Africa (%)
Place of birth for the foreign-born population - Other Southern Africa (%)
Place of birth for the foreign-born population - Cabo Verde (%)
Place of birth for the foreign-born population - Ghana (%)
Place of birth for the foreign-born population - Liberia (%)
Place of birth for the foreign-born population - Nigeria (%)
Place of birth for the foreign-born population - Senegal (%)
Place of birth for the foreign-born population - Sierra Leone (%)
Place of birth for the foreign-born population - Other Western Africa (%)
Place of birth for the foreign-born population - Australia (%)
Place of birth for the foreign-born population - New Zealand (%)
Place of birth for the foreign-born population - Fiji (%)
Place of birth for the foreign-born population - Micronesia (%)
Place of birth for the foreign-born population - Bahamas (%)
Place of birth for the foreign-born population - Barbados (%)
Place of birth for the foreign-born population - Cuba (%)
Place of birth for the foreign-born population - Dominica (%)
Place of birth for the foreign-born population - Dominican Republic (%)
Place of birth for the foreign-born population - Grenada (%)
Place of birth for the foreign-born population - Haiti (%)
Place of birth for the foreign-born population - Jamaica (%)
Place of birth for the foreign-born population - St. Vincent and the Grenadines (%)
Place of birth for the foreign-born population - Trinidad and Tobago (%)
Place of birth for the foreign-born population - West Indies (%)
Place of birth for the foreign-born population - Other Caribbean (%)
Place of birth for the foreign-born population - Belize (%)
Place of birth for the foreign-born population - Costa Rica (%)
Place of birth for the foreign-born population - El Salvador (%)
Place of birth for the foreign-born population - Guatemala (%)
Place of birth for the foreign-born population - Honduras (%)
Place of birth for the foreign-born population - Mexico (%)
Place of birth for the foreign-born population - Nicaragua (%)
Place of birth for the foreign-born population - Panama (%)
Place of birth for the foreign-born population - Other Central America (%)
Place of birth for the foreign-born population - Argentina (%)
Place of birth for the foreign-born population - Bolivia (%)
Place of birth for the foreign-born population - Brazil (%)
Place of birth for the foreign-born population - Chile (%)
Place of birth for the foreign-born population - Colombia (%)
Place of birth for the foreign-born population - Ecuador (%)
Place of birth for the foreign-born population - Guyana (%)
Place of birth for the foreign-born population - Peru (%)
Place of birth for the foreign-born population - Uruguay (%)
Place of birth for the foreign-born population - Venezuela (%)
Place of birth for the foreign-born population - Other South America (%)
Place of birth for the foreign-born population - Canada (%)
Place of birth for the foreign-born population - Other Northern America (%)
Place of birth for the foreign-born population - Other (%)
Latest news about races in Lockport, IL collected exclusively by city-data.com from local newspapers, TV, and radio stations
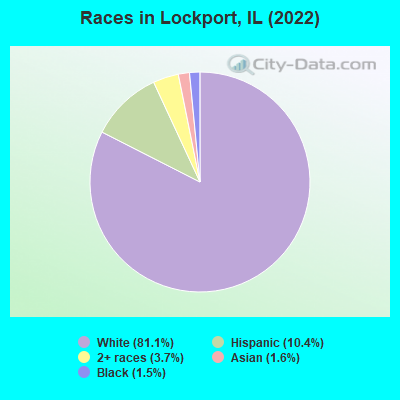
According to 2022 data, the most numerous races in Lockport, IL are White alone (21,180 residents), Hispanic (2,719 residents), and Black alone (390 residents). 84.7% of Lockport residents speak English at home. 8.0% of Lockport, IL residents are foreign-born (4.4% born in Europe, 2.0% born in Asia, 1.2% born in Latin America), which is 74.5% less than the foreign-born rate of 14.0% across the entire state of Illinois.
Race distribution in Lockport
2000 2022
8,424,140 67.8% White alone 1,856,152 14.9% Black alone 1,530,262 12.3% Hispanic 419,916 3.4% Asian alone 153,996 1.2% Two or more races 13,479 0.1% Other race alone 18,232 0.1% American Indian alone 3,116 0.03% Native Hawaiian and Other
7,356,301 58.5% White alone 2,299,726 18.3% Hispanic 1,660,423 13.2% Black alone 747,296 5.9% Asian alone 458,599 3.6% Two or more races 45,386 0.4% Other race alone 10,405 0.08% American Indian alone 3,896 0.03% Native Hawaiian and Other
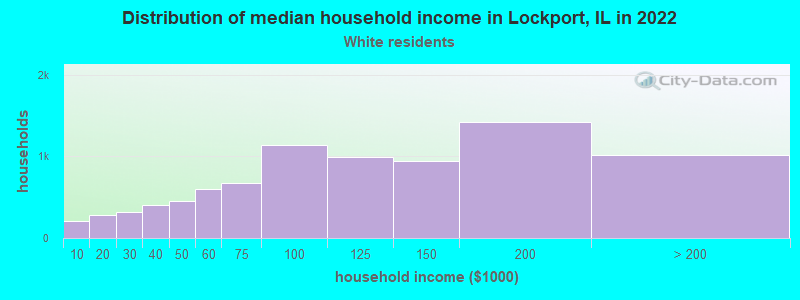
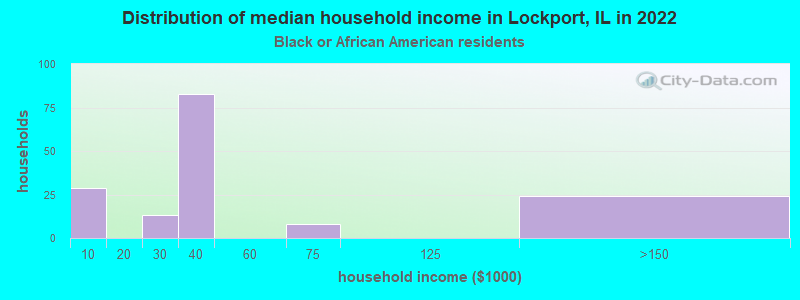
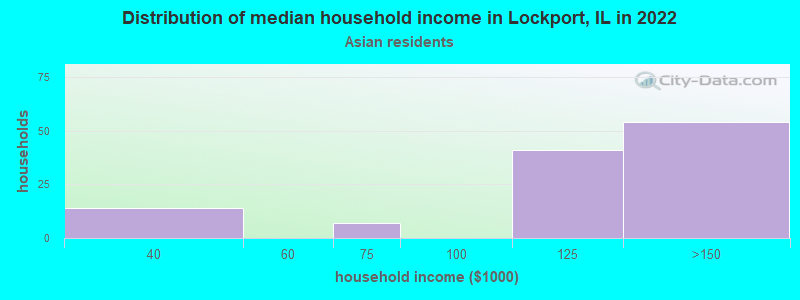
Income and house value in Lockport Median household income in 2022 $99,712 White non-Hispanic householders$119,620 Asian householders$41,318 Some other race householders$129,229 Two or more races householders$105,123 Hispanic or Latino race householdersMedian 2022 house value $309,670 White Non-Hispanic householders$162,551 Black or African American householders$462,962 American Indian or Alaska Native householders $174,897 Asian householders$501,646 Some other race householders$282,921 Two or more races householders$288,888 Hispanic or Latino householders
Median age by race in Lockport
41.2 Median age for White residents41.1 41.1 32.2 Median age for Black or African American residents33.0 32.3 -801,714,897.4 Median age for American Indian / Alaska Native residents-764,890,281.4 -844,733,984.0 32.3 Median age for Asian residents51.3 19.7 -593,236,714.4 Median age for Native Hawaiian / Pacific Islander residents-658,536,584.7 -576,015,108.0 38.0 Median age for Other race residents42.9 37.7 22.6 Median age for Two or more races residents19.9 23.4 41.3 Median age for White alone residents41.6 40.8 24.1 Median age for Hispanic or Latino residents20.5 25.8
Owner/renter occupied households by race in Lockport
House owners and renters - White residents 7,091 84.4% Owner occupied1,314 15.6% Renter occupiedHouse owners and renters - Black or African American residents 97 72.7% Owner occupied36 27.3% Renter occupiedHouse owners and renters - Asian residents 73 71.3% Owner occupied29 28.7% Renter occupiedHouse owners and renters - Other race residents 67 42.4% Owner occupied91 57.6% Renter occupiedHouse owners and renters - Two or more races residents 451 87.0% Owner occupied68 13.0% Renter occupiedHouse owners and renters - White alone residents 6,952 83.4% Owner occupied1,382 16.6% Renter occupiedHouse owners and renters - Hispanic or Latino residents 481 76.9% Owner occupied145 23.1% Renter occupied
Language usage in Lockport
English speakers - Total 84.7% of residents of Lockport speak English at home.
3.5% of residents speak Spanish at home 677 77.5% Speak English very well196 22.5% Speak English less than very well11.4% of residents speak other language at home 1,774 62.5% Speak English very well1,066 37.5% Speak English less than very well
English speakers - Born in the United States 95.0% of residents of Lockport speak English at home.
2.7% of residents speak Spanish at home 62 100.0% Speak English very well1.6% of residents speak other language at home 37 100.0% Speak English very well
English speakers - Native, born elsewhere 57.5% of residents of Lockport speak English at home.
12.6% of residents speak Spanish at home 8 72.7% Speak English very well3 27.3% Speak English less than very well27.6% of residents speak other language at home 24 100.0% Speak English very well
English speakers - Foreign-born 1.7% of residents of Lockport speak English at home.
14.1% of residents speak Spanish at home 187 57.7% Speak English very well137 42.3% Speak English less than very well88.1% of residents speak other language at home 1,042 51.4% Speak English very well987 48.6% Speak English less than very well
White (Caucasian) - Speak only English Native:
97.0% (18,448)Foreign-born:
1.6% (22)
White (Caucasian) - Speak another language Native:
3.5% (659)Foreign-born:
95.7% (1,321)
Black or African American - Speak only English Native:
99.5% (269)Foreign-born:
4.7% (8)
Asian - Speak only English Native:
78.2% (177)Foreign-born:
3.8% (8)
Asian - Speak another language Native:
8.7% (20)Foreign-born:
99.2% (196)
Other race - Speak another language Native:
43.4% (123)Foreign-born:
99.0% (159)
Two or more races - Speak another language Native:
9.2% (186)Foreign-born:
99.7% (44)
White alone - Speak only English Native:
96.2% (17,982)Foreign-born:
0.4% (7)
White alone - Speak another language Native:
3.8% (713)Foreign-born:
100.0% (1,687)
Hispanic or Latino - Speak only English Native:
79.3% (1,691)Foreign-born:
5.6% (18)
Hispanic or Latino - Speak another language Native:
22.6% (482)Foreign-born:
94.4% (305)
Foreign-born residents in Lockport 2,096 residents are foreign born (4.4% Europe , 2.0% Asia , 1.2% Latin America ).
This city:
8.0%Illinois:
14.1%
Marital status for residents in Lockport Marital status - White (Caucasian) population 15 years and over
Males 33.4% Never married55.3% Now married0.6% Separated1.5% Widowed9.1% DivorcedFemales 26.9% Never married53.0% Now married0.4% Separated9.2% Widowed10.6% DivorcedWomen who gave birth in the past 12 months Now married:
100.0% (200)Unmarried:
0.0% (0)
Women who did not give birth in the past 12 months Now married:
49.0% (2,401)Unmarried:
51.0% (2,496)
Marital status - Black or African American population 15 years and over
Males 50.6% Never married43.4% Now married6.0% Separated0.0% Widowed0.0% DivorcedFemales 50.3% Never married35.0% Now married0.0% Separated0.0% Widowed14.7% DivorcedWomen who gave birth in the past 12 months Now married:
100.0% (18)Unmarried:
0.0% (0)
Women who did not give birth in the past 12 months Now married:
28.9% (40)Unmarried:
71.1% (98)
Marital status - Asian population 15 years and over
Males 0.0% Never married94.4% Now married0.0% Separated0.0% Widowed5.6% DivorcedFemales 38.3% Never married45.0% Now married0.0% Separated0.0% Widowed16.8% DivorcedWomen who did not give birth in the past 12 months Now married:
26.8% (32)Unmarried:
73.2% (89)
Marital status - Other race population 15 years and over
Males 16.9% Never married74.7% Now married0.0% Separated0.0% Widowed8.4% DivorcedFemales 36.6% Never married46.2% Now married0.0% Separated0.0% Widowed17.2% DivorcedWomen who gave birth in the past 12 months Now married:
0.0% (0)Unmarried:
100.0% (80)
Women who did not give birth in the past 12 months Now married:
88.0% (119)Unmarried:
12.0% (16)
Marital status - Two or more races population 15 years and over
Males 51.2% Never married36.9% Now married0.0% Separated1.7% Widowed10.2% DivorcedFemales 53.3% Never married39.3% Now married2.9% Separated0.0% Widowed4.4% DivorcedWomen who gave birth in the past 12 months Now married:
0.0% (0)Unmarried:
100.0% (24)
Women who did not give birth in the past 12 months Now married:
37.2% (269)Unmarried:
62.8% (455)
Marital status - White alone, not Hispanic / Latino population 15 years and over
Males 33.3% Never married55.0% Now married0.7% Separated1.6% Widowed9.4% DivorcedFemales 25.9% Never married53.4% Now married0.4% Separated9.2% Widowed11.0% DivorcedWomen who gave birth in the past 12 months Now married:
100.0% (213)Unmarried:
0.0% (0)
Women who did not give birth in the past 12 months Now married:
49.6% (2,444)Unmarried:
50.4% (2,481)
Marital status - Hispanic or Latino population 15 years and over
Males 40.8% Never married50.5% Now married0.0% Separated1.1% Widowed7.6% DivorcedFemales 49.2% Never married40.2% Now married1.9% Separated3.1% Widowed5.5% DivorcedWomen who gave birth in the past 12 months Now married:
0.0% (0)Unmarried:
100.0% (86)
Women who did not give birth in the past 12 months Now married:
43.0% (320)Unmarried:
57.0% (423)
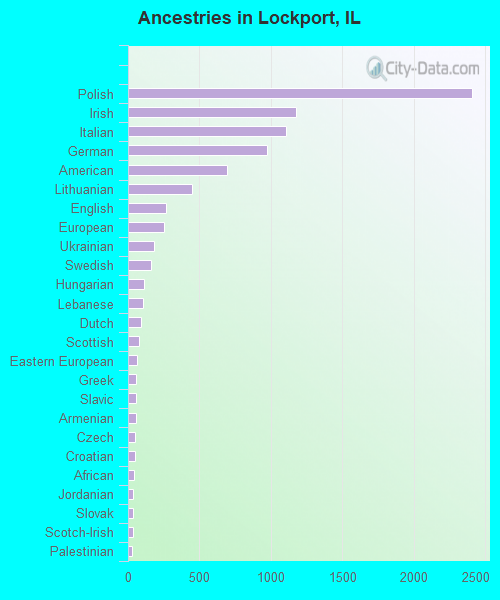
Ancestries in Lockport
2,405 23.2% Polish1,176 11.3% Irish1,105 10.7% Italian975 9.4% German694 6.7% American446 4.3% Lithuanian265 2.6% English254 2.4% European182 1.8% Ukrainian164 1.6% Swedish115 1.1% Hungarian105 1.0% Lebanese94 0.9% Dutch77 0.7% Scottish63 0.6% Eastern European57 0.5% Greek56 0.5% Slavic55 0.5% Armenian49 0.5% Czech47 0.5% Croatian41 0.4% African37 0.4% Jordanian33 0.3% Slovak32 0.3% Scotch-Irish30 0.3% Palestinian29 0.3% Yugoslavian19 0.2% French15 0.1% Slovene14 0.1% Norwegian10 0.10% Latvian9 0.09% Russian6 0.06% Czechoslovakian5 0.05% Danish
Geographical mobility in Lockport Same house 1 year ago 18,905 89.3% White (Caucasian)160 40.4% Black or African American438 100.0% Asian481 100.0% Other race1,817 77.4% Two or more races18,907 90.0% White alone, not Hispanic / Latino2,244 83.6% Hispanic or LatinoMoved within same county 1,296 6.1% White / Caucasian50 12.5% Black or African American74 3.1% Two or more races1,163 5.5% White alone, not Hispanic / Latino306 11.4% Hispanic or LatinoMoved within same state 647 3.1% White / Caucasian145 36.5% Black or African American308 13.1% Two or more races598 2.8% White alone, not Hispanic / Latino102 3.8% Hispanic or LatinoMoved from different state 208 1.0% White / Caucasian4 1.0% Asian229 1.1% White alone, not Hispanic / LatinoMoved from abroad 10 0.0% White33 8.4% Black or African American10 0.0% White alone, not Hispanic / Latino
Children Nativity (place of birth) in Lockport
Children under 6 years - Living with two parents Both parents native 892 100.0% NativeBoth parents foreign-born 210 87.1% Native31 12.9% Foreign-bornOne native, one foreign-born parent 54 100.0% NativeChildren under 6 years - Living with one parent Native parent 347 100.0% NativeChildren 6 to 17 years - Living with two parents Both parents native 3,152 98.9% Native35 1.1% Foreign-bornBoth parents foreign-born 320 100.0% NativeOne native, one foreign-born parent 222 90.1% Native24 9.9% Foreign-bornChildren 6 to 17 years - Living with one parent Native parent 639 94.5% Native37 5.5% Foreign-bornForeign-born parent 137 73.2% Native50 26.8% Foreign-born
Grandparents responsible for own grandchildren in Lockport
Grandparents (30 to 59 years) White / Caucasian 8 100.0% Not responsible for grandchildrenOther race 11 100.0% Not responsible for grandchildrenTwo or more races 28 100.0% Not responsible for grandchildrenWhite alone, not Hispanic / Latino 10 100.0% Not responsible for grandchildrenHispanic or Latino 12 100.0% Not responsible for grandchildrenGrandparents (60 years and over) White / Caucasian 47 38.2% Responsible for grandchildren77 61.8% Not responsible for grandchildrenOther race 27 100.0% Not responsible for grandchildrenWhite alone, not Hispanic / Latino 52 39.9% Responsible for grandchildren78 60.1% Not responsible for grandchildrenHispanic or Latino 33 100.0% Not responsible for grandchildren