Races in Lockhart, Florida (FL) Detailed Stats
Data:
Races - White alone (%)
Races - White alone (% change since 2000)
Races - Black alone (%)
Races - Black alone (% change since 2000)
Races - American Indian alone (%)
Races - American Indian alone (% change since 2000)
Races - Asian alone (%)
Races - Asian alone (% change since 2000)
Races - Hispanic (%)
Races - Hispanic (% change since 2000)
Races - Native Hawaiian and Other Pacific Islander alone (%)
Races - Native Hawaiian and Other Pacific Islander alone (% change since 2000)
Races - Two or more races(%)
Races - Two or more races(% change since 2000)
Races - Other race alone (%)
Races - Other race alone (% change since 2000)
Racial diversity
Place of birth - Born in state of residence (%)
Place of birth - Born in state of residence (%) - White
Place of birth - Born in state of residence (%) - Black or African American
Place of birth - Born in state of residence (%) - Asian
Place of birth - Born in state of residence (%) - Hispanic or Latino
Place of birth - Born in state of residence (%) - American Indian and Alaska Native
Place of birth - Born in state of residence (%) - Multirace
Place of birth - Born in state of residence (%) - Other Race
Place of birth - Born in other state (%)
Place of birth - Born in other state (%) - White
Place of birth - Born in other state (%) - Black or African American
Place of birth - Born in other state (%) - Asian
Place of birth - Born in other state (%) - Hispanic or Latino
Place of birth - Born in other state (%) - American Indian and Alaska Native
Place of birth - Born in other state (%) - Multirace
Place of birth - Born in other state (%) - Other Race
Place of birth - Native, outside of US (%)
Place of birth - Native, outside of US (%) - White
Place of birth - Native, outside of US (%) - Black or African American
Place of birth - Native, outside of US (%) - Asian
Place of birth - Native, outside of US (%) - Hispanic or Latino
Place of birth - Native, outside of US (%) - American Indian and Alaska Native
Place of birth - Native, outside of US (%) - Multirace
Place of birth - Native, outside of US (%) - Other Race
Place of birth - Foreign born (%)
Place of birth - Foreign born (%) - White
Place of birth - Foreign born (%) - Black or African American
Place of birth - Foreign born (%) - Asian
Place of birth - Foreign born (%) - Hispanic or Latino
Place of birth - Foreign born (%) - American Indian and Alaska Native
Place of birth - Foreign born (%) - Multirace
Place of birth - Foreign born (%) - Other Race
Residents speaking English at home (%)
Residents speaking English at home - Born in the United States (%)
Residents speaking English at home - Native, born elsewhere (%)
Residents speaking English at home - Foreign born (%)
Residents speaking Spanish at home (%)
Residents speaking Spanish at home - Born in the United States (%)
Residents speaking Spanish at home - Native, born elsewhere (%)
Residents speaking Spanish at home - Foreign born (%)
Residents speaking other language at home (%)
Residents speaking other language at home - Born in the United States (%)
Residents speaking other language at home - Native, born elsewhere (%)
Residents speaking other language at home - Foreign born (%)
Marital status - Never married (%)
Marital status - Now married (%)
Marital status - Separated (%)
Marital status - Widowed (%)
Marital status - Divorced (%)
Ancestries Reported - Arab (%)
Ancestries Reported - Czech (%)
Ancestries Reported - Danish (%)
Ancestries Reported - Dutch (%)
Ancestries Reported - English (%)
Ancestries Reported - French (%)
Ancestries Reported - French Canadian (%)
Ancestries Reported - German (%)
Ancestries Reported - Greek (%)
Ancestries Reported - Hungarian (%)
Ancestries Reported - Irish (%)
Ancestries Reported - Italian (%)
Ancestries Reported - Lithuanian (%)
Ancestries Reported - Norwegian (%)
Ancestries Reported - Polish (%)
Ancestries Reported - Portuguese (%)
Ancestries Reported - Russian (%)
Ancestries Reported - Scotch-Irish (%)
Ancestries Reported - Scottish (%)
Ancestries Reported - Slovak (%)
Ancestries Reported - Subsaharan African (%)
Ancestries Reported - Swedish (%)
Ancestries Reported - Swiss (%)
Ancestries Reported - Ukrainian (%)
Ancestries Reported - United States (%)
Ancestries Reported - Welsh (%)
Ancestries Reported - West Indian (%)
Ancestries Reported - Other (%)
Geographical mobility - Same house 1 year ago (%)
Geographical mobility - Same house 1 year ago (%) - White
Geographical mobility - Same house 1 year ago (%) - Black or African American
Geographical mobility - Same house 1 year ago (%) - Asian
Geographical mobility - Same house 1 year ago (%) - Hispanic or Latino
Geographical mobility - Same house 1 year ago (%) - American Indian and Alaska Native
Geographical mobility - Same house 1 year ago (%) - Multirace
Geographical mobility - Same house 1 year ago (%) - Other Race
Geographical mobility - Moved within same county (%)
Geographical mobility - Moved within same county (%) - White
Geographical mobility - Moved within same county (%) - Black or African American
Geographical mobility - Moved within same county (%) - Asian
Geographical mobility - Moved within same county (%) - Hispanic or Latino
Geographical mobility - Moved within same county (%) - American Indian and Alaska Native
Geographical mobility - Moved within same county (%) - Multirace
Geographical mobility - Moved within same county (%) - Other Race
Geographical mobility - Moved from different county within same state (%)
Geographical mobility - Moved from different county within same state (%) - White
Geographical mobility - Moved from different county within same state (%) - Black or African American
Geographical mobility - Moved from different county within same state (%) - Asian
Geographical mobility - Moved from different county within same state (%) - Hispanic or Latino
Geographical mobility - Moved from different county within same state (%) - American Indian and Alaska Native
Geographical mobility - Moved from different county within same state (%) - Multirace
Geographical mobility - Moved from different county within same state (%) - Other Race
Geographical mobility - Moved from different state (%)
Geographical mobility - Moved from different state (%) - White
Geographical mobility - Moved from different state (%) - Black or African American
Geographical mobility - Moved from different state (%) - Asian
Geographical mobility - Moved from different state (%) - Hispanic or Latino
Geographical mobility - Moved from different state (%) - American Indian and Alaska Native
Geographical mobility - Moved from different state (%) - Multirace
Geographical mobility - Moved from different state (%) - Other Race
Geographical mobility - Moved from abroad (%)
Geographical mobility - Moved from abroad (%) - White
Geographical mobility - Moved from abroad (%) - Black or African American
Geographical mobility - Moved from abroad (%) - Asian
Geographical mobility - Moved from abroad (%) - Hispanic or Latino
Geographical mobility - Moved from abroad (%) - American Indian and Alaska Native
Geographical mobility - Moved from abroad (%) - Multirace
Geographical mobility - Moved from abroad (%) - Other Race
Place of birth for the foreign-born population - Ireland (%)
Place of birth for the foreign-born population - Denmark (%)
Place of birth for the foreign-born population - Norway (%)
Place of birth for the foreign-born population - Sweden (%)
Place of birth for the foreign-born population - United Kingdom (%)
Place of birth for the foreign-born population - England (%)
Place of birth for the foreign-born population - Scotland (%)
Place of birth for the foreign-born population - Other Northern Europe (%)
Place of birth for the foreign-born population - Austria (%)
Place of birth for the foreign-born population - Belgium (%)
Place of birth for the foreign-born population - France (%)
Place of birth for the foreign-born population - Germany (%)
Place of birth for the foreign-born population - Netherlands (%)
Place of birth for the foreign-born population - Switzerland (%)
Place of birth for the foreign-born population - Other Western Europe (%)
Place of birth for the foreign-born population - Greece (%)
Place of birth for the foreign-born population - Italy (%)
Place of birth for the foreign-born population - Portugal (%)
Place of birth for the foreign-born population - Spain (%)
Place of birth for the foreign-born population - Other Southern Europe (%)
Place of birth for the foreign-born population - Albania (%)
Place of birth for the foreign-born population - Belarus (%)
Place of birth for the foreign-born population - Bosnia and Herzegovina (%)
Place of birth for the foreign-born population - Bulgaria (%)
Place of birth for the foreign-born population - Croatia (%)
Place of birth for the foreign-born population - Czechoslovakia (%)
Place of birth for the foreign-born population - Hungary (%)
Place of birth for the foreign-born population - Latvia (%)
Place of birth for the foreign-born population - Lithuania (%)
Place of birth for the foreign-born population - North Macedonia (Macedonia) (%)
Place of birth for the foreign-born population - Moldova (%)
Place of birth for the foreign-born population - Poland (%)
Place of birth for the foreign-born population - Romania (%)
Place of birth for the foreign-born population - Russia (%)
Place of birth for the foreign-born population - Serbia (%)
Place of birth for the foreign-born population - Ukraine (%)
Place of birth for the foreign-born population - Other Eastern Europe (%)
Place of birth for the foreign-born population - China (%)
Place of birth for the foreign-born population - Hong Kong (%)
Place of birth for the foreign-born population - Taiwan (%)
Place of birth for the foreign-born population - Japan (%)
Place of birth for the foreign-born population - Korea (%)
Place of birth for the foreign-born population - Other Eastern Asia (%)
Place of birth for the foreign-born population - Afghanistan (%)
Place of birth for the foreign-born population - Bangladesh (%)
Place of birth for the foreign-born population - India (%)
Place of birth for the foreign-born population - Iran (%)
Place of birth for the foreign-born population - Kazakhstan (%)
Place of birth for the foreign-born population - Nepal (%)
Place of birth for the foreign-born population - Pakistan (%)
Place of birth for the foreign-born population - Sri Lanka (%)
Place of birth for the foreign-born population - Uzbekistan (%)
Place of birth for the foreign-born population - Other South Central Asia (%)
Place of birth for the foreign-born population - Burma (%)
Place of birth for the foreign-born population - Cambodia (%)
Place of birth for the foreign-born population - Indonesia (%)
Place of birth for the foreign-born population - Laos (%)
Place of birth for the foreign-born population - Malaysia (%)
Place of birth for the foreign-born population - Philippines (%)
Place of birth for the foreign-born population - Singapore (%)
Place of birth for the foreign-born population - Thailand (%)
Place of birth for the foreign-born population - Vietnam (%)
Place of birth for the foreign-born population - Other South Eastern Asia (%)
Place of birth for the foreign-born population - Armenia (%)
Place of birth for the foreign-born population - Iraq (%)
Place of birth for the foreign-born population - Israel (%)
Place of birth for the foreign-born population - Jordan (%)
Place of birth for the foreign-born population - Kuwait (%)
Place of birth for the foreign-born population - Lebanon (%)
Place of birth for the foreign-born population - Saudi Arabia (%)
Place of birth for the foreign-born population - Syria (%)
Place of birth for the foreign-born population - Turkey (%)
Place of birth for the foreign-born population - Yemen (%)
Place of birth for the foreign-born population - Other Western Asia (%)
Place of birth for the foreign-born population - Eritrea (%)
Place of birth for the foreign-born population - Ethiopia (%)
Place of birth for the foreign-born population - Kenya (%)
Place of birth for the foreign-born population - Somalia (%)
Place of birth for the foreign-born population - Uganda (%)
Place of birth for the foreign-born population - Zimbabwe (%)
Place of birth for the foreign-born population - Other Eastern Africa (%)
Place of birth for the foreign-born population - Cameroon (%)
Place of birth for the foreign-born population - Congo (%)
Place of birth for the foreign-born population - Democratic Republic of Congo (Zaire) (%)
Place of birth for the foreign-born population - Other Middle Africa (%)
Place of birth for the foreign-born population - Egypt (%)
Place of birth for the foreign-born population - Morocco (%)
Place of birth for the foreign-born population - Sudan (%)
Place of birth for the foreign-born population - Other Northern Africa (%)
Place of birth for the foreign-born population - South Africa (%)
Place of birth for the foreign-born population - Other Southern Africa (%)
Place of birth for the foreign-born population - Cabo Verde (%)
Place of birth for the foreign-born population - Ghana (%)
Place of birth for the foreign-born population - Liberia (%)
Place of birth for the foreign-born population - Nigeria (%)
Place of birth for the foreign-born population - Senegal (%)
Place of birth for the foreign-born population - Sierra Leone (%)
Place of birth for the foreign-born population - Other Western Africa (%)
Place of birth for the foreign-born population - Australia (%)
Place of birth for the foreign-born population - New Zealand (%)
Place of birth for the foreign-born population - Fiji (%)
Place of birth for the foreign-born population - Micronesia (%)
Place of birth for the foreign-born population - Bahamas (%)
Place of birth for the foreign-born population - Barbados (%)
Place of birth for the foreign-born population - Cuba (%)
Place of birth for the foreign-born population - Dominica (%)
Place of birth for the foreign-born population - Dominican Republic (%)
Place of birth for the foreign-born population - Grenada (%)
Place of birth for the foreign-born population - Haiti (%)
Place of birth for the foreign-born population - Jamaica (%)
Place of birth for the foreign-born population - St. Vincent and the Grenadines (%)
Place of birth for the foreign-born population - Trinidad and Tobago (%)
Place of birth for the foreign-born population - West Indies (%)
Place of birth for the foreign-born population - Other Caribbean (%)
Place of birth for the foreign-born population - Belize (%)
Place of birth for the foreign-born population - Costa Rica (%)
Place of birth for the foreign-born population - El Salvador (%)
Place of birth for the foreign-born population - Guatemala (%)
Place of birth for the foreign-born population - Honduras (%)
Place of birth for the foreign-born population - Mexico (%)
Place of birth for the foreign-born population - Nicaragua (%)
Place of birth for the foreign-born population - Panama (%)
Place of birth for the foreign-born population - Other Central America (%)
Place of birth for the foreign-born population - Argentina (%)
Place of birth for the foreign-born population - Bolivia (%)
Place of birth for the foreign-born population - Brazil (%)
Place of birth for the foreign-born population - Chile (%)
Place of birth for the foreign-born population - Colombia (%)
Place of birth for the foreign-born population - Ecuador (%)
Place of birth for the foreign-born population - Guyana (%)
Place of birth for the foreign-born population - Peru (%)
Place of birth for the foreign-born population - Uruguay (%)
Place of birth for the foreign-born population - Venezuela (%)
Place of birth for the foreign-born population - Other South America (%)
Place of birth for the foreign-born population - Canada (%)
Place of birth for the foreign-born population - Other Northern America (%)
Place of birth for the foreign-born population - Other (%)
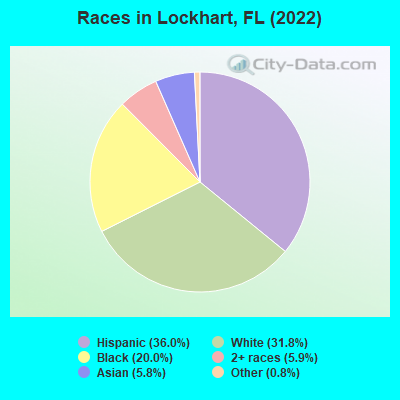
According to 2022 data, the most numerous races in Lockhart, FL are White alone (4,855 residents), Hispanic (5,507 residents), and Black alone (3,053 residents). 68.2% of Lockhart residents speak English at home. 17.7% of Lockhart, FL residents are foreign-born (8.9% born in Latin America, 4.0% born in Asia, 3.6% born in Europe), which is 18.6% less than the foreign-born rate of 21.0% across the entire state of Florida.
Race distribution in Lockhart
2000 2022
10,458,509 65.4% White alone 2,682,715 16.8% Hispanic 2,264,268 14.2% Black alone 261,693 1.6% Asian alone 236,954 1.5% Two or more races 42,358 0.3% American Indian alone 28,994 0.2% Other race alone 6,887 0.04% Native Hawaiian and Other
11,309,403 50.8% White alone 6,025,039 27.1% Hispanic 3,241,015 14.6% Black alone 861,630 3.9% Two or more races 623,692 2.8% Asian alone 152,054 0.7% Other race alone 22,504 0.1% American Indian alone 9,486 0.04% Native Hawaiian and Other
Income and house value in Lockhart Median household income in 2022 $85,233 White non-Hispanic householders$50,327 Black householders$63,869 Asian householders$71,687 Some other race householders$47,062 Two or more races householders$71,144 Hispanic or Latino race householdersMedian 2022 house value $268,598 White Non-Hispanic householders$273,852 Black or African American householders$290,926 American Indian or Alaska Native householders $323,762 Asian householders$253,822 Some other race householders$242,329 Two or more races householders$267,941 Hispanic or Latino householders
Median age by race in Lockhart
44.5 Median age for White residents44.7 45.2 34.4 Median age for Black or African American residents41.6 30.1 -614,300,100.1 Median age for American Indian / Alaska Native residents-735,632,183.2 -529,680,364.8 35.2 Median age for Asian residents32.4 41.1 -679,790,025.6 Median age for Native Hawaiian / Pacific Islander residents-1,327,635,326.3 -611,111,110.5 32.3 Median age for Other race residents28.4 39.2 29.7 Median age for Two or more races residents32.0 27.1 45.6 Median age for White alone residents43.6 51.1 31.2 Median age for Hispanic or Latino residents31.9 28.4
Owner/renter occupied households by race in Lockhart
House owners and renters - White residents 1,954 76.2% Owner occupied612 23.8% Renter occupiedHouse owners and renters - Black or African American residents 416 26.4% Owner occupied1,158 73.6% Renter occupiedHouse owners and renters - American Indian / Alaska Native residents 25 100.0% Owner occupiedHouse owners and renters - Asian residents 246 89.5% Owner occupied29 10.5% Renter occupiedHouse owners and renters - Other race residents 387 54.6% Owner occupied322 45.4% Renter occupiedHouse owners and renters - Two or more races residents 827 80.2% Owner occupied204 19.8% Renter occupiedHouse owners and renters - White alone residents 1,800 75.3% Owner occupied589 24.7% Renter occupiedHouse owners and renters - Hispanic or Latino residents 1,056 61.2% Owner occupied669 38.8% Renter occupied
Language usage in Lockhart
English speakers - Total 68.2% of residents of Lockhart speak English at home.
22.4% of residents speak Spanish at home 2,433 74.9% Speak English very well815 25.1% Speak English less than very well9.3% of residents speak other language at home 803 59.5% Speak English very well546 40.5% Speak English less than very well
English speakers - Born in the United States 89.1% of residents of Lockhart speak English at home.
9.5% of residents speak Spanish at home 463 99.4% Speak English very well3 0.6% Speak English less than very well1.4% of residents speak other language at home 51 76.1% Speak English very well16 23.9% Speak English less than very well
English speakers - Native, born elsewhere 32.1% of residents of Lockhart speak English at home.
71.1% of residents speak Spanish at home 988 82.6% Speak English very well208 17.4% Speak English less than very well
English speakers - Foreign-born 20.7% of residents of Lockhart speak English at home.
36.7% of residents speak Spanish at home 436 43.2% Speak English very well574 56.8% Speak English less than very well42.5% of residents speak other language at home 648 55.5% Speak English very well520 44.5% Speak English less than very well
White (Caucasian) - Speak only English Native:
100.0% (4,135)Foreign-born:
17.3% (106)
White (Caucasian) - Speak another language Native:
5.0% (206)Foreign-born:
82.3% (504)
Black or African American - Speak only English Native:
86.8% (3,063)Foreign-born:
92.8% (221)
Black or African American - Speak another language Native:
13.5% (475)Foreign-born:
13.7% (33)
American Indian / Alaska Native - Speak only English Native:
82.4% (16)Foreign-born:
100.0% (6)
Asian - Speak only English Native:
91.4% (183)Foreign-born:
13.5% (92)
Asian - Speak another language Native:
13.4% (27)Foreign-born:
85.2% (584)
Other race - Speak only English Native:
40.2% (633)Foreign-born:
9.1% (42)
Other race - Speak another language Native:
61.0% (962)Foreign-born:
90.3% (419)
Two or more races - Speak only English Native:
54.9% (1,548)Foreign-born:
18.6% (94)
Two or more races - Speak another language Native:
44.5% (1,255)Foreign-born:
81.1% (408)
White alone - Speak only English Native:
96.9% (3,958)Foreign-born:
20.3% (125)
White alone - Speak another language Native:
3.2% (130)Foreign-born:
80.9% (500)
Hispanic or Latino - Speak only English Native:
49.6% (1,975)Foreign-born:
3.2% (33)
Hispanic or Latino - Speak another language Native:
52.9% (2,107)Foreign-born:
97.1% (1,009)
Foreign-born residents in Lockhart 2,705 residents are foreign born (8.9% Latin America , 4.0% Asia , 3.6% Europe ).
This city:
17.7%Florida:
21.1%
Marital status for residents in Lockhart Marital status - White (Caucasian) population 15 years and over
Males 35.3% Never married50.5% Now married4.5% Separated1.6% Widowed8.1% DivorcedFemales 22.0% Never married53.4% Now married1.8% Separated4.7% Widowed18.2% DivorcedWomen who gave birth in the past 12 months Now married:
100.0% (22)Unmarried:
0.0% (0)
Women who did not give birth in the past 12 months Now married:
53.0% (528)Unmarried:
47.0% (468)
Marital status - Black or African American population 15 years and over
Males 40.2% Never married25.8% Now married1.5% Separated0.0% Widowed32.4% DivorcedFemales 71.8% Never married13.9% Now married0.4% Separated1.3% Widowed12.5% DivorcedWomen who gave birth in the past 12 months Now married:
44.8% (26)Unmarried:
55.2% (32)
Women who did not give birth in the past 12 months Now married:
5.8% (76)Unmarried:
94.2% (1,232)
Marital status - Asian population 15 years and over
Males 41.9% Never married58.1% Now married0.0% Separated0.0% Widowed0.0% DivorcedFemales 14.2% Never married73.4% Now married0.0% Separated12.4% Widowed0.0% DivorcedWomen who did not give birth in the past 12 months Now married:
80.9% (267)Unmarried:
19.1% (63)
Marital status - Other race population 15 years and over
Males 51.4% Never married30.5% Now married7.2% Separated2.1% Widowed8.8% DivorcedFemales 43.4% Never married45.8% Now married3.0% Separated0.0% Widowed7.8% DivorcedWomen who gave birth in the past 12 months Now married:
0.0% (0)Unmarried:
100.0% (17)
Women who did not give birth in the past 12 months Now married:
46.3% (266)Unmarried:
53.7% (309)
Marital status - Two or more races population 15 years and over
Males 46.6% Never married48.0% Now married0.0% Separated2.9% Widowed2.5% DivorcedFemales 40.5% Never married40.8% Now married0.0% Separated8.7% Widowed9.9% DivorcedWomen who gave birth in the past 12 months Now married:
0.0% (0)Unmarried:
100.0% (54)
Women who did not give birth in the past 12 months Now married:
36.4% (304)Unmarried:
63.6% (531)
Marital status - White alone, not Hispanic / Latino population 15 years and over
Males 36.3% Never married50.6% Now married4.8% Separated1.9% Widowed6.4% DivorcedFemales 20.3% Never married55.3% Now married2.2% Separated4.4% Widowed17.8% DivorcedWomen who gave birth in the past 12 months Now married:
100.0% (12)Unmarried:
0.0% (0)
Women who did not give birth in the past 12 months Now married:
57.4% (516)Unmarried:
42.6% (382)
Marital status - Hispanic or Latino population 15 years and over
Males 38.6% Never married32.0% Now married3.2% Separated1.0% Widowed25.2% DivorcedFemales 45.8% Never married35.5% Now married0.7% Separated5.4% Widowed12.7% DivorcedWomen who gave birth in the past 12 months Now married:
23.1% (15)Unmarried:
76.9% (51)
Women who did not give birth in the past 12 months Now married:
31.7% (483)Unmarried:
68.3% (1,039)
Ancestries in Lockhart
1,275 15.3% American631 7.6% African278 3.3% English275 3.3% Irish266 3.2% Russian232 2.8% German135 1.6% Italian83 1.0% European74 0.9% Portuguese68 0.8% Jamaican64 0.8% Trinidadian and Tobagonian39 0.5% French28 0.3% Swedish28 0.3% Haitian26 0.3% Canadian24 0.3% Dutch24 0.3% West Indian23 0.3% Cajun22 0.3% Scottish19 0.2% Bulgarian17 0.2% Scotch-Irish17 0.2% Welsh16 0.2% Guyanese14 0.2% Hungarian12 0.1% Ukrainian11 0.1% Danish10 0.1% Eastern European8 0.10% Ethiopian7 0.08% Greek7 0.08% Polish6 0.07% South African3 0.04% Iranian
Geographical mobility in Lockhart Same house 1 year ago 4,265 85.4% White (Caucasian)3,730 91.9% Black or African American27 100.0% American Indian / Alaska Native917 100.0% Asian1,706 83.1% Other race3,045 84.1% Two or more races4,398 90.8% White alone, not Hispanic / Latino4,383 80.8% Hispanic or LatinoMoved within same county 353 7.1% White / Caucasian212 5.2% Black or African American14 0.7% Other race453 12.5% Two or more races212 4.4% White alone, not Hispanic / Latino536 9.9% Hispanic or LatinoMoved within same state 146 2.9% White / Caucasian190 4.7% Black or African American187 9.1% Other race20 0.6% Two or more races71 1.5% White alone, not Hispanic / Latino237 4.4% Hispanic or LatinoMoved from different state 105 2.1% White / Caucasian1 0.0% Black or African American232 11.3% Other race19 0.5% Two or more races29 0.6% White alone, not Hispanic / Latino256 4.7% Hispanic or LatinoMoved from abroad 77 1.5% White2 0.1% Two or more races120 2.5% White alone, not Hispanic / Latino1 0.0% Hispanic or Latino
Children Nativity (place of birth) in Lockhart
Children under 6 years - Living with two parents Both parents native 153 100.0% NativeBoth parents foreign-born 14 100.0% NativeOne native, one foreign-born parent 82 100.0% NativeChildren under 6 years - Living with one parent Native parent 755 100.0% NativeForeign-born parent 40 100.0% NativeChildren 6 to 17 years - Living with two parents Both parents native 492 99.9% Native0 0.1% Foreign-bornBoth parents foreign-born 279 88.1% Native38 11.9% Foreign-bornOne native, one foreign-born parent 81 100.0% NativeChildren 6 to 17 years - Living with one parent Native parent 865 100.0% NativeForeign-born parent 102 56.2% Native80 43.8% Foreign-born
Grandparents responsible for own grandchildren in Lockhart
Grandparents (30 to 59 years) White / Caucasian 10 100.0% Not responsible for grandchildrenBlack or African American 128 40.6% Responsible for grandchildren187 59.4% Not responsible for grandchildrenTwo or more races 22 100.0% Responsible for grandchildrenWhite alone, not Hispanic / Latino 14 100.0% Not responsible for grandchildrenHispanic or Latino 347 100.0% Not responsible for grandchildrenGrandparents (60 years and over) White / Caucasian 17 35.1% Responsible for grandchildren31 64.9% Not responsible for grandchildrenBlack or African American 38 53.7% Responsible for grandchildren33 46.3% Not responsible for grandchildrenTwo or more races 32 100.0% Not responsible for grandchildrenWhite alone, not Hispanic / Latino 24 36.6% Responsible for grandchildren42 63.4% Not responsible for grandchildren