Races in Lochearn, Maryland (MD) Detailed Stats
Data:
Races - White alone (%)
Races - White alone (% change since 2000)
Races - Black alone (%)
Races - Black alone (% change since 2000)
Races - American Indian alone (%)
Races - American Indian alone (% change since 2000)
Races - Asian alone (%)
Races - Asian alone (% change since 2000)
Races - Hispanic (%)
Races - Hispanic (% change since 2000)
Races - Native Hawaiian and Other Pacific Islander alone (%)
Races - Native Hawaiian and Other Pacific Islander alone (% change since 2000)
Races - Two or more races(%)
Races - Two or more races(% change since 2000)
Races - Other race alone (%)
Races - Other race alone (% change since 2000)
Racial diversity
Place of birth - Born in state of residence (%)
Place of birth - Born in state of residence (%) - White
Place of birth - Born in state of residence (%) - Black or African American
Place of birth - Born in state of residence (%) - Asian
Place of birth - Born in state of residence (%) - Hispanic or Latino
Place of birth - Born in state of residence (%) - American Indian and Alaska Native
Place of birth - Born in state of residence (%) - Multirace
Place of birth - Born in state of residence (%) - Other Race
Place of birth - Born in other state (%)
Place of birth - Born in other state (%) - White
Place of birth - Born in other state (%) - Black or African American
Place of birth - Born in other state (%) - Asian
Place of birth - Born in other state (%) - Hispanic or Latino
Place of birth - Born in other state (%) - American Indian and Alaska Native
Place of birth - Born in other state (%) - Multirace
Place of birth - Born in other state (%) - Other Race
Place of birth - Native, outside of US (%)
Place of birth - Native, outside of US (%) - White
Place of birth - Native, outside of US (%) - Black or African American
Place of birth - Native, outside of US (%) - Asian
Place of birth - Native, outside of US (%) - Hispanic or Latino
Place of birth - Native, outside of US (%) - American Indian and Alaska Native
Place of birth - Native, outside of US (%) - Multirace
Place of birth - Native, outside of US (%) - Other Race
Place of birth - Foreign born (%)
Place of birth - Foreign born (%) - White
Place of birth - Foreign born (%) - Black or African American
Place of birth - Foreign born (%) - Asian
Place of birth - Foreign born (%) - Hispanic or Latino
Place of birth - Foreign born (%) - American Indian and Alaska Native
Place of birth - Foreign born (%) - Multirace
Place of birth - Foreign born (%) - Other Race
Residents speaking English at home (%)
Residents speaking English at home - Born in the United States (%)
Residents speaking English at home - Native, born elsewhere (%)
Residents speaking English at home - Foreign born (%)
Residents speaking Spanish at home (%)
Residents speaking Spanish at home - Born in the United States (%)
Residents speaking Spanish at home - Native, born elsewhere (%)
Residents speaking Spanish at home - Foreign born (%)
Residents speaking other language at home (%)
Residents speaking other language at home - Born in the United States (%)
Residents speaking other language at home - Native, born elsewhere (%)
Residents speaking other language at home - Foreign born (%)
Marital status - Never married (%)
Marital status - Now married (%)
Marital status - Separated (%)
Marital status - Widowed (%)
Marital status - Divorced (%)
Ancestries Reported - Arab (%)
Ancestries Reported - Czech (%)
Ancestries Reported - Danish (%)
Ancestries Reported - Dutch (%)
Ancestries Reported - English (%)
Ancestries Reported - French (%)
Ancestries Reported - French Canadian (%)
Ancestries Reported - German (%)
Ancestries Reported - Greek (%)
Ancestries Reported - Hungarian (%)
Ancestries Reported - Irish (%)
Ancestries Reported - Italian (%)
Ancestries Reported - Lithuanian (%)
Ancestries Reported - Norwegian (%)
Ancestries Reported - Polish (%)
Ancestries Reported - Portuguese (%)
Ancestries Reported - Russian (%)
Ancestries Reported - Scotch-Irish (%)
Ancestries Reported - Scottish (%)
Ancestries Reported - Slovak (%)
Ancestries Reported - Subsaharan African (%)
Ancestries Reported - Swedish (%)
Ancestries Reported - Swiss (%)
Ancestries Reported - Ukrainian (%)
Ancestries Reported - United States (%)
Ancestries Reported - Welsh (%)
Ancestries Reported - West Indian (%)
Ancestries Reported - Other (%)
Geographical mobility - Same house 1 year ago (%)
Geographical mobility - Same house 1 year ago (%) - White
Geographical mobility - Same house 1 year ago (%) - Black or African American
Geographical mobility - Same house 1 year ago (%) - Asian
Geographical mobility - Same house 1 year ago (%) - Hispanic or Latino
Geographical mobility - Same house 1 year ago (%) - American Indian and Alaska Native
Geographical mobility - Same house 1 year ago (%) - Multirace
Geographical mobility - Same house 1 year ago (%) - Other Race
Geographical mobility - Moved within same county (%)
Geographical mobility - Moved within same county (%) - White
Geographical mobility - Moved within same county (%) - Black or African American
Geographical mobility - Moved within same county (%) - Asian
Geographical mobility - Moved within same county (%) - Hispanic or Latino
Geographical mobility - Moved within same county (%) - American Indian and Alaska Native
Geographical mobility - Moved within same county (%) - Multirace
Geographical mobility - Moved within same county (%) - Other Race
Geographical mobility - Moved from different county within same state (%)
Geographical mobility - Moved from different county within same state (%) - White
Geographical mobility - Moved from different county within same state (%) - Black or African American
Geographical mobility - Moved from different county within same state (%) - Asian
Geographical mobility - Moved from different county within same state (%) - Hispanic or Latino
Geographical mobility - Moved from different county within same state (%) - American Indian and Alaska Native
Geographical mobility - Moved from different county within same state (%) - Multirace
Geographical mobility - Moved from different county within same state (%) - Other Race
Geographical mobility - Moved from different state (%)
Geographical mobility - Moved from different state (%) - White
Geographical mobility - Moved from different state (%) - Black or African American
Geographical mobility - Moved from different state (%) - Asian
Geographical mobility - Moved from different state (%) - Hispanic or Latino
Geographical mobility - Moved from different state (%) - American Indian and Alaska Native
Geographical mobility - Moved from different state (%) - Multirace
Geographical mobility - Moved from different state (%) - Other Race
Geographical mobility - Moved from abroad (%)
Geographical mobility - Moved from abroad (%) - White
Geographical mobility - Moved from abroad (%) - Black or African American
Geographical mobility - Moved from abroad (%) - Asian
Geographical mobility - Moved from abroad (%) - Hispanic or Latino
Geographical mobility - Moved from abroad (%) - American Indian and Alaska Native
Geographical mobility - Moved from abroad (%) - Multirace
Geographical mobility - Moved from abroad (%) - Other Race
Place of birth for the foreign-born population - Ireland (%)
Place of birth for the foreign-born population - Denmark (%)
Place of birth for the foreign-born population - Norway (%)
Place of birth for the foreign-born population - Sweden (%)
Place of birth for the foreign-born population - United Kingdom (%)
Place of birth for the foreign-born population - England (%)
Place of birth for the foreign-born population - Scotland (%)
Place of birth for the foreign-born population - Other Northern Europe (%)
Place of birth for the foreign-born population - Austria (%)
Place of birth for the foreign-born population - Belgium (%)
Place of birth for the foreign-born population - France (%)
Place of birth for the foreign-born population - Germany (%)
Place of birth for the foreign-born population - Netherlands (%)
Place of birth for the foreign-born population - Switzerland (%)
Place of birth for the foreign-born population - Other Western Europe (%)
Place of birth for the foreign-born population - Greece (%)
Place of birth for the foreign-born population - Italy (%)
Place of birth for the foreign-born population - Portugal (%)
Place of birth for the foreign-born population - Spain (%)
Place of birth for the foreign-born population - Other Southern Europe (%)
Place of birth for the foreign-born population - Albania (%)
Place of birth for the foreign-born population - Belarus (%)
Place of birth for the foreign-born population - Bosnia and Herzegovina (%)
Place of birth for the foreign-born population - Bulgaria (%)
Place of birth for the foreign-born population - Croatia (%)
Place of birth for the foreign-born population - Czechoslovakia (%)
Place of birth for the foreign-born population - Hungary (%)
Place of birth for the foreign-born population - Latvia (%)
Place of birth for the foreign-born population - Lithuania (%)
Place of birth for the foreign-born population - North Macedonia (Macedonia) (%)
Place of birth for the foreign-born population - Moldova (%)
Place of birth for the foreign-born population - Poland (%)
Place of birth for the foreign-born population - Romania (%)
Place of birth for the foreign-born population - Russia (%)
Place of birth for the foreign-born population - Serbia (%)
Place of birth for the foreign-born population - Ukraine (%)
Place of birth for the foreign-born population - Other Eastern Europe (%)
Place of birth for the foreign-born population - China (%)
Place of birth for the foreign-born population - Hong Kong (%)
Place of birth for the foreign-born population - Taiwan (%)
Place of birth for the foreign-born population - Japan (%)
Place of birth for the foreign-born population - Korea (%)
Place of birth for the foreign-born population - Other Eastern Asia (%)
Place of birth for the foreign-born population - Afghanistan (%)
Place of birth for the foreign-born population - Bangladesh (%)
Place of birth for the foreign-born population - India (%)
Place of birth for the foreign-born population - Iran (%)
Place of birth for the foreign-born population - Kazakhstan (%)
Place of birth for the foreign-born population - Nepal (%)
Place of birth for the foreign-born population - Pakistan (%)
Place of birth for the foreign-born population - Sri Lanka (%)
Place of birth for the foreign-born population - Uzbekistan (%)
Place of birth for the foreign-born population - Other South Central Asia (%)
Place of birth for the foreign-born population - Burma (%)
Place of birth for the foreign-born population - Cambodia (%)
Place of birth for the foreign-born population - Indonesia (%)
Place of birth for the foreign-born population - Laos (%)
Place of birth for the foreign-born population - Malaysia (%)
Place of birth for the foreign-born population - Philippines (%)
Place of birth for the foreign-born population - Singapore (%)
Place of birth for the foreign-born population - Thailand (%)
Place of birth for the foreign-born population - Vietnam (%)
Place of birth for the foreign-born population - Other South Eastern Asia (%)
Place of birth for the foreign-born population - Armenia (%)
Place of birth for the foreign-born population - Iraq (%)
Place of birth for the foreign-born population - Israel (%)
Place of birth for the foreign-born population - Jordan (%)
Place of birth for the foreign-born population - Kuwait (%)
Place of birth for the foreign-born population - Lebanon (%)
Place of birth for the foreign-born population - Saudi Arabia (%)
Place of birth for the foreign-born population - Syria (%)
Place of birth for the foreign-born population - Turkey (%)
Place of birth for the foreign-born population - Yemen (%)
Place of birth for the foreign-born population - Other Western Asia (%)
Place of birth for the foreign-born population - Eritrea (%)
Place of birth for the foreign-born population - Ethiopia (%)
Place of birth for the foreign-born population - Kenya (%)
Place of birth for the foreign-born population - Somalia (%)
Place of birth for the foreign-born population - Uganda (%)
Place of birth for the foreign-born population - Zimbabwe (%)
Place of birth for the foreign-born population - Other Eastern Africa (%)
Place of birth for the foreign-born population - Cameroon (%)
Place of birth for the foreign-born population - Congo (%)
Place of birth for the foreign-born population - Democratic Republic of Congo (Zaire) (%)
Place of birth for the foreign-born population - Other Middle Africa (%)
Place of birth for the foreign-born population - Egypt (%)
Place of birth for the foreign-born population - Morocco (%)
Place of birth for the foreign-born population - Sudan (%)
Place of birth for the foreign-born population - Other Northern Africa (%)
Place of birth for the foreign-born population - South Africa (%)
Place of birth for the foreign-born population - Other Southern Africa (%)
Place of birth for the foreign-born population - Cabo Verde (%)
Place of birth for the foreign-born population - Ghana (%)
Place of birth for the foreign-born population - Liberia (%)
Place of birth for the foreign-born population - Nigeria (%)
Place of birth for the foreign-born population - Senegal (%)
Place of birth for the foreign-born population - Sierra Leone (%)
Place of birth for the foreign-born population - Other Western Africa (%)
Place of birth for the foreign-born population - Australia (%)
Place of birth for the foreign-born population - New Zealand (%)
Place of birth for the foreign-born population - Fiji (%)
Place of birth for the foreign-born population - Micronesia (%)
Place of birth for the foreign-born population - Bahamas (%)
Place of birth for the foreign-born population - Barbados (%)
Place of birth for the foreign-born population - Cuba (%)
Place of birth for the foreign-born population - Dominica (%)
Place of birth for the foreign-born population - Dominican Republic (%)
Place of birth for the foreign-born population - Grenada (%)
Place of birth for the foreign-born population - Haiti (%)
Place of birth for the foreign-born population - Jamaica (%)
Place of birth for the foreign-born population - St. Vincent and the Grenadines (%)
Place of birth for the foreign-born population - Trinidad and Tobago (%)
Place of birth for the foreign-born population - West Indies (%)
Place of birth for the foreign-born population - Other Caribbean (%)
Place of birth for the foreign-born population - Belize (%)
Place of birth for the foreign-born population - Costa Rica (%)
Place of birth for the foreign-born population - El Salvador (%)
Place of birth for the foreign-born population - Guatemala (%)
Place of birth for the foreign-born population - Honduras (%)
Place of birth for the foreign-born population - Mexico (%)
Place of birth for the foreign-born population - Nicaragua (%)
Place of birth for the foreign-born population - Panama (%)
Place of birth for the foreign-born population - Other Central America (%)
Place of birth for the foreign-born population - Argentina (%)
Place of birth for the foreign-born population - Bolivia (%)
Place of birth for the foreign-born population - Brazil (%)
Place of birth for the foreign-born population - Chile (%)
Place of birth for the foreign-born population - Colombia (%)
Place of birth for the foreign-born population - Ecuador (%)
Place of birth for the foreign-born population - Guyana (%)
Place of birth for the foreign-born population - Peru (%)
Place of birth for the foreign-born population - Uruguay (%)
Place of birth for the foreign-born population - Venezuela (%)
Place of birth for the foreign-born population - Other South America (%)
Place of birth for the foreign-born population - Canada (%)
Place of birth for the foreign-born population - Other Northern America (%)
Place of birth for the foreign-born population - Other (%)
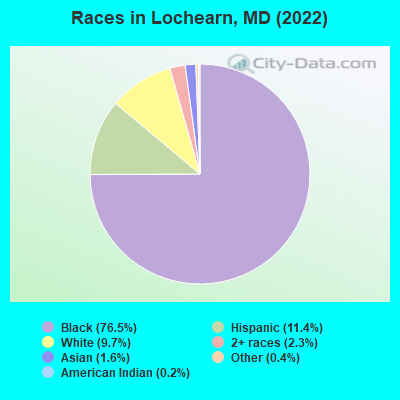
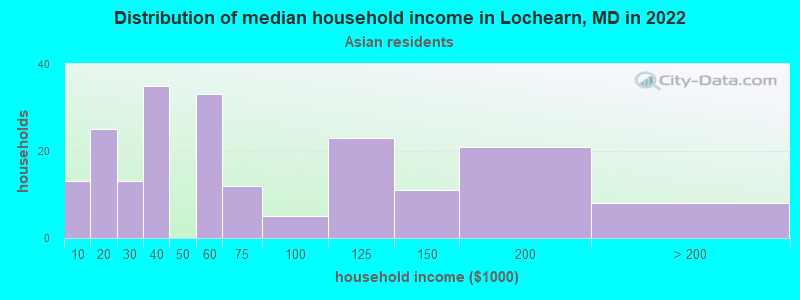
According to 2022 data, the most numerous races in Lochearn, MD are White alone (2,614 residents), Black alone (20,613 residents), and Hispanic (3,067 residents). 85.0% of Lochearn residents speak English at home. 15.5% of Lochearn, MD residents are foreign-born (6.8% born in Africa, 6.4% born in Latin America), which is 2.9% less than the foreign-born rate of 16.0% across the entire state of Maryland.
Race distribution in Lochearn
2000 2022
3,286,547 62.1% White alone 1,464,735 27.7% Black alone 227,916 4.3% Hispanic 209,738 4.0% Asian alone 82,946 1.6% Two or more races 13,312 0.3% American Indian alone 9,379 0.2% Other race alone 1,913 0.04% Native Hawaiian and Other
2,906,492 47.1% White alone 1,800,914 29.2% Black alone 705,842 11.4% Hispanic 401,818 6.5% Asian alone 291,317 4.7% Two or more races 46,930 0.8% Other race alone 8,930 0.1% American Indian alone 2,417 0.04% Native Hawaiian and Other
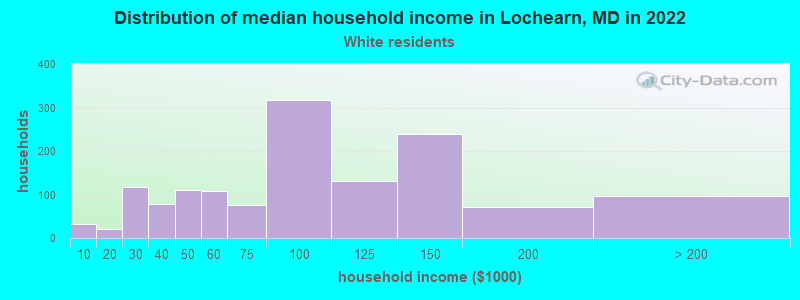
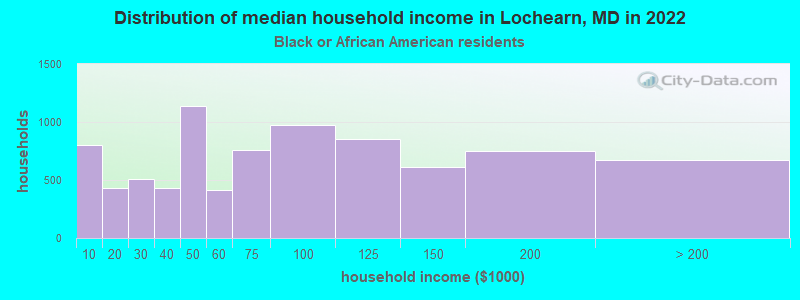
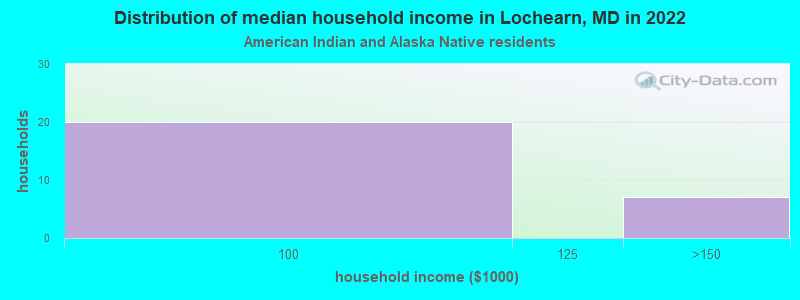
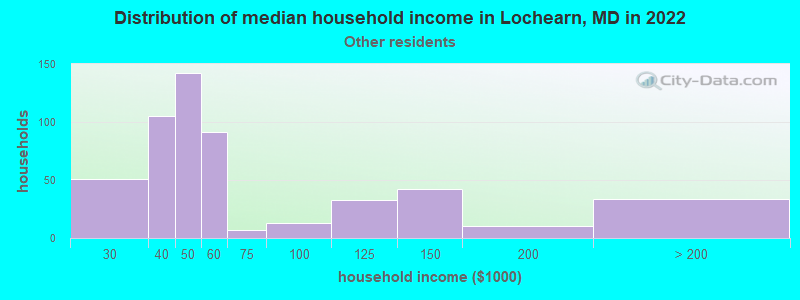
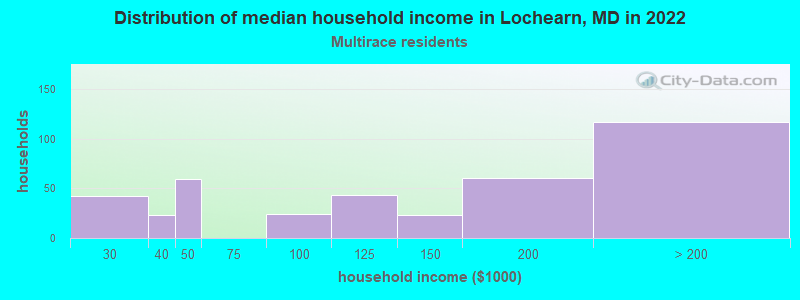
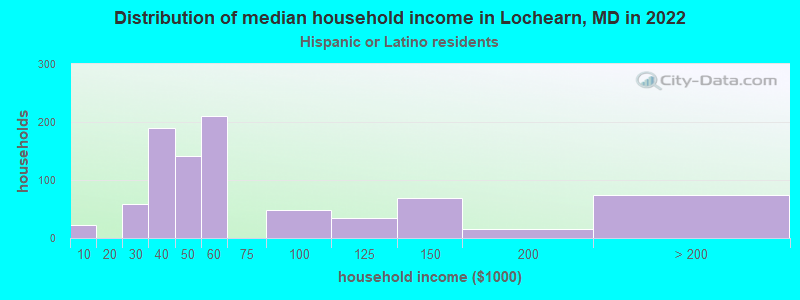
Income and house value in Lochearn Median household income in 2022 $79,478 White non-Hispanic householders$67,792 Black householders$53,547 Asian householders$49,088 Some other race householders$122,820 Two or more races householders$44,163 Hispanic or Latino race householdersMedian 2022 house value $252,981 White Non-Hispanic householders$275,955 Black or African American householders$219,422 American Indian or Alaska Native householders $295,316 Asian householders$548,556 Some other race householders$284,474 Two or more races householders$281,893 Hispanic or Latino householders
Median age by race in Lochearn
57.0 Median age for White residents54.8 58.2 40.9 Median age for Black or African American residents37.1 43.9 51.3 Median age for American Indian / Alaska Native residents57.7 57.7 33.2 Median age for Asian residents31.3 36.5 15.5 Median age for Native Hawaiian / Pacific Islander residents4.6 10.2 14.4 Median age for Other race residents13.6 22.3 12.3 Median age for Two or more races residents12.4 11.1 57.1 Median age for White alone residents54.2 60.5 12.4 Median age for Hispanic or Latino residents12.1 17.2
Owner/renter occupied households by race in Lochearn
House owners and renters - White residents 1,115 80.7% Owner occupied267 19.3% Renter occupiedHouse owners and renters - Black or African American residents 6,314 72.3% Owner occupied2,421 27.7% Renter occupiedHouse owners and renters - American Indian / Alaska Native residents 59 100.0% Owner occupiedHouse owners and renters - Asian residents 118 58.8% Owner occupied83 41.2% Renter occupiedHouse owners and renters - Native Hawaiian / Pacific Islander residents 14 100.0% Owner occupiedHouse owners and renters - Other race residents 132 23.8% Owner occupied421 76.2% Renter occupiedHouse owners and renters - Two or more races residents 278 70.6% Owner occupied115 29.4% Renter occupiedHouse owners and renters - White alone residents 1,077 83.7% Owner occupied209 16.3% Renter occupiedHouse owners and renters - Hispanic or Latino residents 211 26.8% Owner occupied576 73.2% Renter occupied
Language usage in Lochearn
English speakers - Total 85.0% of residents of Lochearn speak English at home.
4.9% of residents speak Spanish at home 565 46.0% Speak English very well664 54.0% Speak English less than very well9.9% of residents speak other language at home 1,825 73.7% Speak English very well650 26.3% Speak English less than very well
English speakers - Born in the United States 93.4% of residents of Lochearn speak English at home.
2.2% of residents speak Spanish at home 104 90.4% Speak English very well11 9.6% Speak English less than very well4.1% of residents speak other language at home 214 100.0% Speak English very well
English speakers - Native, born elsewhere 79.0% of residents of Lochearn speak English at home.
4.5% of residents speak Spanish at home 14 100.0% Speak English very well14.3% of residents speak other language at home 44 97.8% Speak English very well1 2.2% Speak English less than very well
English speakers - Foreign-born 42.8% of residents of Lochearn speak English at home.
16.4% of residents speak Spanish at home 105 15.5% Speak English very well571 84.5% Speak English less than very well44.0% of residents speak other language at home 1,202 66.3% Speak English very well611 33.7% Speak English less than very well
White (Caucasian) - Speak only English Native:
97.6% (2,573)Foreign-born:
21.6% (18)
White (Caucasian) - Speak another language Native:
2.4% (63)Foreign-born:
77.9% (67)
Black or African American - Speak only English Native:
96.1% (16,492)Foreign-born:
47.9% (1,288)
Black or African American - Speak another language Native:
3.6% (618)Foreign-born:
52.7% (1,416)
Asian - Speak only English Native:
49.6% (45)Foreign-born:
36.6% (97)
Asian - Speak another language Native:
50.5% (45)Foreign-born:
66.6% (176)
Native Hawaiian / Pacific Islander - Speak another language Native:
95.6% (41)Foreign-born:
100.0% (37)
Other race - Speak only English Native:
50.8% (497)Foreign-born:
29.2% (284)
Other race - Speak another language Native:
49.3% (484)Foreign-born:
63.2% (615)
Two or more races - Speak only English Native:
79.7% (439)Foreign-born:
52.2% (167)
Two or more races - Speak another language Native:
15.2% (84)Foreign-born:
52.4% (168)
White alone - Speak only English Native:
98.9% (2,495)Foreign-born:
14.8% (6)
White alone - Speak another language Native:
1.3% (33)Foreign-born:
86.1% (34)
Hispanic or Latino - Speak only English Native:
53.6% (633)Foreign-born:
32.8% (325)
Hispanic or Latino - Speak another language Native:
45.2% (533)Foreign-born:
67.1% (663)
Foreign-born residents in Lochearn 4,187 residents are foreign born (6.8% Africa , 6.4% Latin America ).
This city:
15.5%Maryland:
15.7%
Marital status for residents in Lochearn Marital status - White (Caucasian) population 15 years and over
Males 29.2% Never married41.8% Now married13.0% Separated5.0% Widowed10.9% DivorcedFemales 25.7% Never married38.3% Now married1.2% Separated19.1% Widowed15.7% DivorcedWomen who gave birth in the past 12 months Now married:
100.0% (21)Unmarried:
0.0% (0)
Women who did not give birth in the past 12 months Now married:
42.9% (177)Unmarried:
57.1% (236)
Marital status - Black or African American population 15 years and over
Males 47.1% Never married36.8% Now married3.4% Separated3.9% Widowed8.8% DivorcedFemales 38.0% Never married32.4% Now married4.6% Separated11.2% Widowed13.7% DivorcedWomen who gave birth in the past 12 months Now married:
85.2% (109)Unmarried:
14.8% (19)
Women who did not give birth in the past 12 months Now married:
30.4% (1,417)Unmarried:
69.6% (3,238)
Marital status - American Indian / Alaska Native population 15 years and over
Males 86.7% Never married0.0% Now married0.0% Separated13.3% Widowed0.0% DivorcedFemales 40.5% Never married11.9% Now married0.0% Separated0.0% Widowed47.6% DivorcedWomen who did not give birth in the past 12 months Now married:
29.4% (7)Unmarried:
70.6% (18)
Marital status - Asian population 15 years and over
Males 24.6% Never married75.4% Now married0.0% Separated0.0% Widowed0.0% DivorcedFemales 18.6% Never married69.2% Now married0.0% Separated2.3% Widowed10.0% DivorcedWomen who gave birth in the past 12 months Now married:
100.0% (33)Unmarried:
0.0% (0)
Women who did not give birth in the past 12 months Now married:
65.9% (54)Unmarried:
34.1% (28)
Marital status - Native Hawaiian / Pacific Islander population 15 years and over
Males 0.0% Never married100.0% Now married0.0% Separated0.0% Widowed0.0% DivorcedFemales 44.0% Never married48.0% Now married0.0% Separated0.0% Widowed8.0% DivorcedWomen who did not give birth in the past 12 months Now married:
48.0% (13)Unmarried:
52.0% (14)
Marital status - Other race population 15 years and over
Males 38.3% Never married49.0% Now married11.1% Separated0.0% Widowed1.6% DivorcedFemales 44.1% Never married55.9% Now married0.0% Separated0.0% Widowed0.0% DivorcedWomen who gave birth in the past 12 months Now married:
100.0% (44)Unmarried:
0.0% (0)
Women who did not give birth in the past 12 months Now married:
55.8% (268)Unmarried:
44.2% (212)
Marital status - Two or more races population 15 years and over
Males 49.0% Never married46.0% Now married0.0% Separated5.0% Widowed0.0% DivorcedFemales 50.1% Never married38.0% Now married0.0% Separated2.4% Widowed9.5% DivorcedWomen who gave birth in the past 12 months Now married:
100.0% (48)Unmarried:
0.0% (0)
Women who did not give birth in the past 12 months Now married:
16.4% (46)Unmarried:
83.6% (233)
Marital status - White alone, not Hispanic / Latino population 15 years and over
Males 29.8% Never married41.7% Now married11.8% Separated5.3% Widowed11.4% DivorcedFemales 22.9% Never married37.6% Now married1.3% Separated21.0% Widowed17.2% DivorcedWomen who gave birth in the past 12 months Now married:
100.0% (22)Unmarried:
0.0% (0)
Women who did not give birth in the past 12 months Now married:
43.0% (133)Unmarried:
57.0% (176)
Marital status - Hispanic or Latino population 15 years and over
Males 41.4% Never married46.5% Now married11.3% Separated0.8% Widowed0.0% DivorcedFemales 42.8% Never married52.5% Now married1.9% Separated0.0% Widowed2.7% DivorcedWomen who gave birth in the past 12 months Now married:
100.0% (73)Unmarried:
0.0% (0)
Women who did not give birth in the past 12 months Now married:
50.6% (297)Unmarried:
49.4% (289)
Ancestries in Lochearn
725 3.8% African678 3.5% Kenyan509 2.6% American507 2.6% Nigerian427 2.2% Jamaican221 1.2% Trinidadian and Tobagonian185 1.0% Irish177 0.9% German148 0.8% English119 0.6% Liberian65 0.3% British West Indian62 0.3% Eastern European61 0.3% Polish60 0.3% Scottish47 0.2% Ghanaian38 0.2% European31 0.2% Swedish20 0.1% Italian19 0.10% Haitian17 0.09% British16 0.08% Serbian15 0.08% Russian14 0.07% South African13 0.07% Hungarian10 0.05% Canadian9 0.05% Lithuanian8 0.04% Brazilian7 0.04% Scotch-Irish6 0.03% Slovene6 0.03% West Indian4 0.02% Ukrainian2 0.01% French
Geographical mobility in Lochearn Same house 1 year ago 2,528 92.3% White (Caucasian)18,931 91.1% Black or African American125 98.9% American Indian / Alaska Native387 89.6% Asian129 100.0% Native Hawaiian / Pacific Islander2,098 97.6% Other race788 66.5% Two or more races2,472 95.4% White alone, not Hispanic / Latino2,367 86.6% Hispanic or LatinoMoved within same county 148 5.4% White / Caucasian1,072 5.2% Black or African American13 2.9% Asian14 0.7% Other race245 20.6% Two or more races70 2.7% White alone, not Hispanic / Latino315 11.5% Hispanic or LatinoMoved within same state 21 0.8% White / Caucasian296 1.4% Black or African American31 7.1% Asian26 2.2% Two or more races21 0.8% White alone, not Hispanic / LatinoMoved from different state 29 1.0% White / Caucasian359 1.7% Black or African American62 2.9% Other race29 1.1% White alone, not Hispanic / Latino125 4.6% Hispanic or LatinoMoved from abroad 156 0.8% Black or African American8 0.4% Other race
Children Nativity (place of birth) in Lochearn
Children under 6 years - Living with two parents Both parents native 343 98.5% Native5 1.5% Foreign-bornBoth parents foreign-born 747 96.8% Native25 3.2% Foreign-bornOne native, one foreign-born parent 78 100.0% NativeChildren under 6 years - Living with one parent Native parent 479 100.0% NativeForeign-born parent 237 91.4% Native22 8.6% Foreign-bornChildren 6 to 17 years - Living with two parents Both parents native 957 100.0% NativeBoth parents foreign-born 584 79.9% Native147 20.1% Foreign-bornOne native, one foreign-born parent 184 100.0% NativeChildren 6 to 17 years - Living with one parent Native parent 1,398 100.0% NativeForeign-born parent 355 56.9% Native269 43.1% Foreign-born
Grandparents responsible for own grandchildren in Lochearn
Grandparents (30 to 59 years) White / Caucasian 3 100.0% Not responsible for grandchildrenBlack or African American 16 12.3% Responsible for grandchildren116 87.7% Not responsible for grandchildrenTwo or more races 20 100.0% Responsible for grandchildrenHispanic or Latino 4 100.0% Not responsible for grandchildrenGrandparents (60 years and over) Black or African American 89 15.1% Responsible for grandchildren502 84.9% Not responsible for grandchildren