Races in Lizella, Georgia (GA) Detailed Stats
Ancestries, Foreign-born residents, place of birth
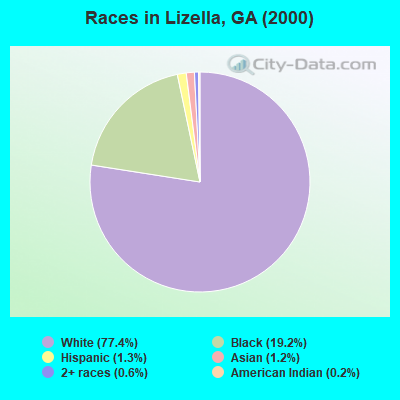
Race distribution in Lizella

- 13,91877.4%White alone
- 3,45919.2%Black alone
- 2321.3%Hispanic
- 2181.2%Asian alone
- 1090.6%Two or more races
- 270.2%American Indian alone
- 140.08%Other race alone
2000
2022
-
- 5,128,66162.6%White alone
- 2,331,46528.5%Black alone
- 435,2275.3%Hispanic
- 171,5132.1%Asian alone
- 87,3641.1%Two or more races
- 17,6700.2%American Indian alone
- 11,2750.1%Other race alone
- 3,2780.04%Native Hawaiian and Other
Pacific Islander alone

-
- 5,415,65749.6%White alone
- 3,349,24030.7%Black alone
- 1,132,60410.4%Hispanic
- 479,1564.4%Asian alone
- 462,9234.2%Two or more races
- 54,4160.5%Other race alone
- 11,9230.1%American Indian alone
- 6,9570.06%Native Hawaiian and Other
Pacific Islander alone

Income and house value in Lizella
- Median household income in 2022
- $83,976White non-Hispanic householders
- $77,243Black householders
- $41,675Asian householders
- $112,939Some other race householders
- $34,178Two or more races householders
- $97,060Hispanic or Latino race householders
- Median 2022 house value
- $239,851White Non-Hispanic householders
- $250,223Black or African American householders
- $243,092American Indian or Alaska Native householders
- $252,167Asian householders
- $205,278Native Hawaiian and other Pacific Islander householders
- $351,133Some other race householders
- $59,422Two or more races householders
- $189,504Hispanic or Latino householders
Household income for White non-Hispanic householders

Household income for Black householders

Household income for American Indian and Alaska Native householders

Household income for Asian householders

Household income for Native Hawaiian and other Pacific Islander householders

Household income for Two or more races householders

Household income for Hispanic or Latino race householders

Zip code: 31052