Races in Lionville-Marchwood, Pennsylvania (PA) Detailed Stats
Ancestries, Foreign-born residents, place of birth

Discuss Lionville-Marchwood, Pennsylvania races on our local forum with over 2,400,000 registered users
8.7% of Lionville-Marchwood, PA residents are foreign-born (4.6% born in Europe, 2.8% born in Asia, 0.9% born in Latin America), which is 19.7% greater than the foreign-born rate of 7.0% across the entire state of Pennsylvania.
Race distribution in Lionville-Marchwood

- 5,75291.3%White alone
- 2343.7%Asian alone
- 1612.6%Black alone
- 761.2%Hispanic
- 611.0%Two or more races
- 70.1%Other race alone
- 60.10%American Indian alone
- 10.02%Native Hawaiian and Other
Pacific Islander alone

2000
2022
-
- 10,322,45584.1%White alone
- 1,202,4379.8%Black alone
- 394,0883.2%Hispanic
- 218,2961.8%Asian alone
- 113,0970.9%Two or more races
- 13,0860.1%Other race alone
- 14,9040.1%American Indian alone
- 2,6910.02%Native Hawaiian and Other
Pacific Islander alone

-
- 9,487,22873.1%White alone
- 1,311,58110.1%Black alone
- 1,115,9978.6%Hispanic
- 493,9423.8%Two or more races
- 487,1243.8%Asian alone
- 63,5820.5%Other race alone
- 10,1300.08%American Indian alone
- 2,4240.02%Native Hawaiian and Other
Pacific Islander alone

Income and house value in Lionville-Marchwood
- Median household income in 2022
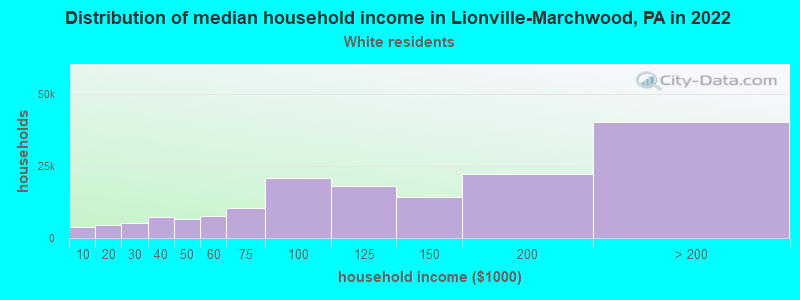
- $114,633White non-Hispanic householders
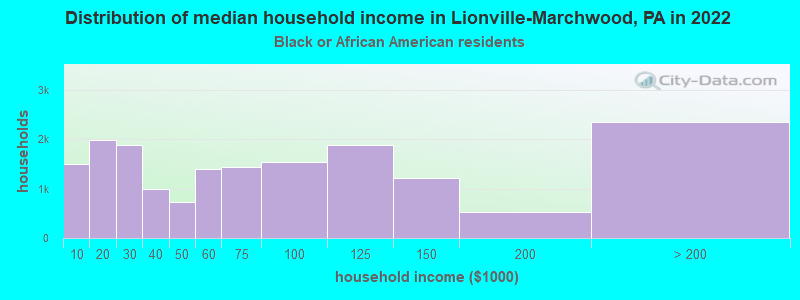
- $112,314Black householders
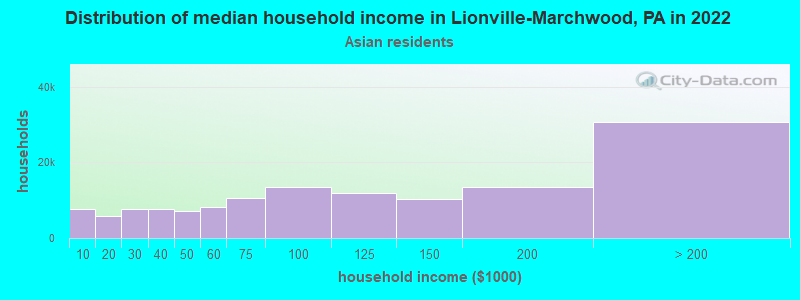
- $168,327Asian householders
- $69,639Two or more races householders
- $129,143Hispanic or Latino race householders
- Median 2022 house value
- $418,424White Non-Hispanic householders
- $497,434Black or African American householders
- $82,567American Indian or Alaska Native householders
- $450,943Asian householders
Household income for White non-Hispanic householders
Household income for Black householders
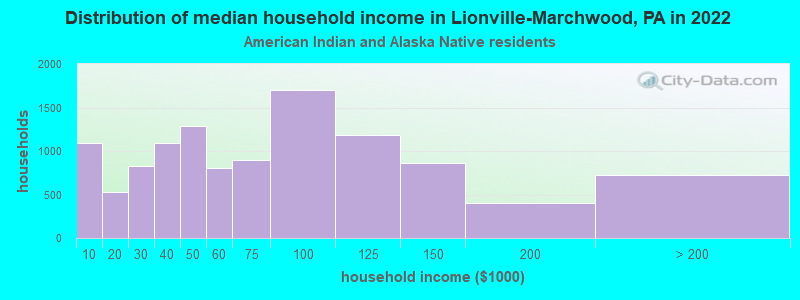
Household income for American Indian and Alaska Native householders
Household income for Asian householders
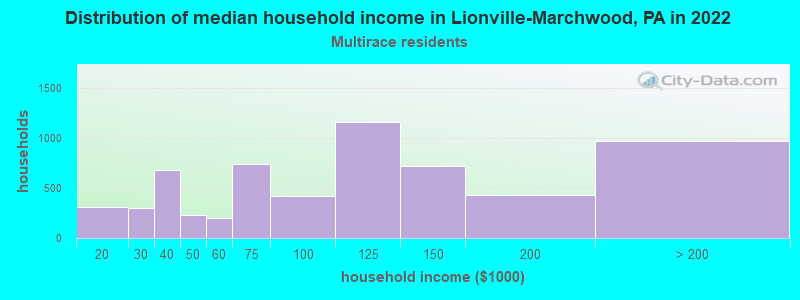
Household income for Two or more races householders
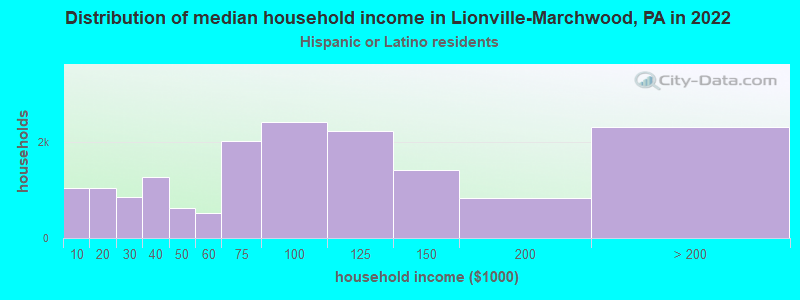
Household income for Hispanic or Latino race householders
Foreign-born residents in Lionville-Marchwood
549 residents are foreign born (4.6% Europe, 2.8% Asia, 0.9% Latin America).
| This city: | 8.7% |
| Pennsylvania: | 4.1% |
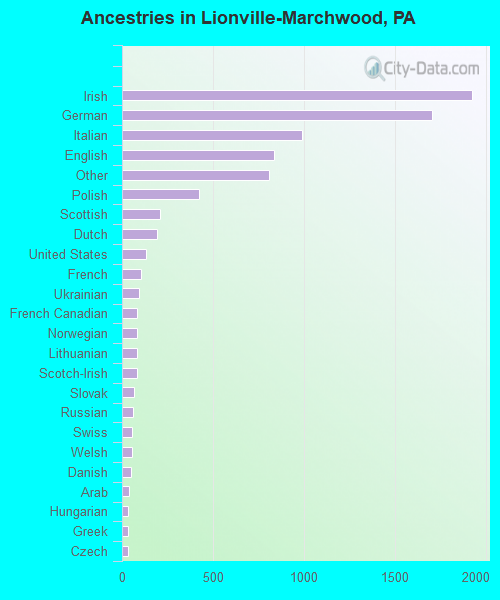
Ancestries in Lionville-Marchwood

- 1,92123.5%Irish
- 1,70620.8%German
- 99112.1%Italian
- 83410.2%English
- 8109.9%Other
- 4245.2%Polish
- 2072.5%Scottish
- 1922.3%Dutch
- 1311.6%United States
- 1041.3%French
- 961.2%Ukrainian
- 851.0%French Canadian
- 841.0%Norwegian
- 811.0%Lithuanian
- 801.0%Scotch-Irish
- 640.8%Slovak
- 630.8%Russian
- 570.7%Swiss
- 530.6%Welsh
- 490.6%Danish
- 400.5%Arab
- 340.4%Hungarian
- 320.4%Greek
- 310.4%Czech
- 170.2%Swedish
Zip codes: 19341.