Races in Linton Hall, Virginia (VA) Detailed Stats
Data:
Races - White alone (%)
Races - White alone (% change since 2000)
Races - Black alone (%)
Races - Black alone (% change since 2000)
Races - American Indian alone (%)
Races - American Indian alone (% change since 2000)
Races - Asian alone (%)
Races - Asian alone (% change since 2000)
Races - Hispanic (%)
Races - Hispanic (% change since 2000)
Races - Native Hawaiian and Other Pacific Islander alone (%)
Races - Native Hawaiian and Other Pacific Islander alone (% change since 2000)
Races - Two or more races(%)
Races - Two or more races(% change since 2000)
Races - Other race alone (%)
Races - Other race alone (% change since 2000)
Racial diversity
Place of birth - Born in state of residence (%)
Place of birth - Born in state of residence (%) - White
Place of birth - Born in state of residence (%) - Black or African American
Place of birth - Born in state of residence (%) - Asian
Place of birth - Born in state of residence (%) - Hispanic or Latino
Place of birth - Born in state of residence (%) - American Indian and Alaska Native
Place of birth - Born in state of residence (%) - Multirace
Place of birth - Born in state of residence (%) - Other Race
Place of birth - Born in other state (%)
Place of birth - Born in other state (%) - White
Place of birth - Born in other state (%) - Black or African American
Place of birth - Born in other state (%) - Asian
Place of birth - Born in other state (%) - Hispanic or Latino
Place of birth - Born in other state (%) - American Indian and Alaska Native
Place of birth - Born in other state (%) - Multirace
Place of birth - Born in other state (%) - Other Race
Place of birth - Native, outside of US (%)
Place of birth - Native, outside of US (%) - White
Place of birth - Native, outside of US (%) - Black or African American
Place of birth - Native, outside of US (%) - Asian
Place of birth - Native, outside of US (%) - Hispanic or Latino
Place of birth - Native, outside of US (%) - American Indian and Alaska Native
Place of birth - Native, outside of US (%) - Multirace
Place of birth - Native, outside of US (%) - Other Race
Place of birth - Foreign born (%)
Place of birth - Foreign born (%) - White
Place of birth - Foreign born (%) - Black or African American
Place of birth - Foreign born (%) - Asian
Place of birth - Foreign born (%) - Hispanic or Latino
Place of birth - Foreign born (%) - American Indian and Alaska Native
Place of birth - Foreign born (%) - Multirace
Place of birth - Foreign born (%) - Other Race
Residents speaking English at home (%)
Residents speaking English at home - Born in the United States (%)
Residents speaking English at home - Native, born elsewhere (%)
Residents speaking English at home - Foreign born (%)
Residents speaking Spanish at home (%)
Residents speaking Spanish at home - Born in the United States (%)
Residents speaking Spanish at home - Native, born elsewhere (%)
Residents speaking Spanish at home - Foreign born (%)
Residents speaking other language at home (%)
Residents speaking other language at home - Born in the United States (%)
Residents speaking other language at home - Native, born elsewhere (%)
Residents speaking other language at home - Foreign born (%)
Marital status - Never married (%)
Marital status - Now married (%)
Marital status - Separated (%)
Marital status - Widowed (%)
Marital status - Divorced (%)
Ancestries Reported - Arab (%)
Ancestries Reported - Czech (%)
Ancestries Reported - Danish (%)
Ancestries Reported - Dutch (%)
Ancestries Reported - English (%)
Ancestries Reported - French (%)
Ancestries Reported - French Canadian (%)
Ancestries Reported - German (%)
Ancestries Reported - Greek (%)
Ancestries Reported - Hungarian (%)
Ancestries Reported - Irish (%)
Ancestries Reported - Italian (%)
Ancestries Reported - Lithuanian (%)
Ancestries Reported - Norwegian (%)
Ancestries Reported - Polish (%)
Ancestries Reported - Portuguese (%)
Ancestries Reported - Russian (%)
Ancestries Reported - Scotch-Irish (%)
Ancestries Reported - Scottish (%)
Ancestries Reported - Slovak (%)
Ancestries Reported - Subsaharan African (%)
Ancestries Reported - Swedish (%)
Ancestries Reported - Swiss (%)
Ancestries Reported - Ukrainian (%)
Ancestries Reported - United States (%)
Ancestries Reported - Welsh (%)
Ancestries Reported - West Indian (%)
Ancestries Reported - Other (%)
Geographical mobility - Same house 1 year ago (%)
Geographical mobility - Same house 1 year ago (%) - White
Geographical mobility - Same house 1 year ago (%) - Black or African American
Geographical mobility - Same house 1 year ago (%) - Asian
Geographical mobility - Same house 1 year ago (%) - Hispanic or Latino
Geographical mobility - Same house 1 year ago (%) - American Indian and Alaska Native
Geographical mobility - Same house 1 year ago (%) - Multirace
Geographical mobility - Same house 1 year ago (%) - Other Race
Geographical mobility - Moved within same county (%)
Geographical mobility - Moved within same county (%) - White
Geographical mobility - Moved within same county (%) - Black or African American
Geographical mobility - Moved within same county (%) - Asian
Geographical mobility - Moved within same county (%) - Hispanic or Latino
Geographical mobility - Moved within same county (%) - American Indian and Alaska Native
Geographical mobility - Moved within same county (%) - Multirace
Geographical mobility - Moved within same county (%) - Other Race
Geographical mobility - Moved from different county within same state (%)
Geographical mobility - Moved from different county within same state (%) - White
Geographical mobility - Moved from different county within same state (%) - Black or African American
Geographical mobility - Moved from different county within same state (%) - Asian
Geographical mobility - Moved from different county within same state (%) - Hispanic or Latino
Geographical mobility - Moved from different county within same state (%) - American Indian and Alaska Native
Geographical mobility - Moved from different county within same state (%) - Multirace
Geographical mobility - Moved from different county within same state (%) - Other Race
Geographical mobility - Moved from different state (%)
Geographical mobility - Moved from different state (%) - White
Geographical mobility - Moved from different state (%) - Black or African American
Geographical mobility - Moved from different state (%) - Asian
Geographical mobility - Moved from different state (%) - Hispanic or Latino
Geographical mobility - Moved from different state (%) - American Indian and Alaska Native
Geographical mobility - Moved from different state (%) - Multirace
Geographical mobility - Moved from different state (%) - Other Race
Geographical mobility - Moved from abroad (%)
Geographical mobility - Moved from abroad (%) - White
Geographical mobility - Moved from abroad (%) - Black or African American
Geographical mobility - Moved from abroad (%) - Asian
Geographical mobility - Moved from abroad (%) - Hispanic or Latino
Geographical mobility - Moved from abroad (%) - American Indian and Alaska Native
Geographical mobility - Moved from abroad (%) - Multirace
Geographical mobility - Moved from abroad (%) - Other Race
Place of birth for the foreign-born population - Ireland (%)
Place of birth for the foreign-born population - Denmark (%)
Place of birth for the foreign-born population - Norway (%)
Place of birth for the foreign-born population - Sweden (%)
Place of birth for the foreign-born population - United Kingdom (%)
Place of birth for the foreign-born population - England (%)
Place of birth for the foreign-born population - Scotland (%)
Place of birth for the foreign-born population - Other Northern Europe (%)
Place of birth for the foreign-born population - Austria (%)
Place of birth for the foreign-born population - Belgium (%)
Place of birth for the foreign-born population - France (%)
Place of birth for the foreign-born population - Germany (%)
Place of birth for the foreign-born population - Netherlands (%)
Place of birth for the foreign-born population - Switzerland (%)
Place of birth for the foreign-born population - Other Western Europe (%)
Place of birth for the foreign-born population - Greece (%)
Place of birth for the foreign-born population - Italy (%)
Place of birth for the foreign-born population - Portugal (%)
Place of birth for the foreign-born population - Spain (%)
Place of birth for the foreign-born population - Other Southern Europe (%)
Place of birth for the foreign-born population - Albania (%)
Place of birth for the foreign-born population - Belarus (%)
Place of birth for the foreign-born population - Bosnia and Herzegovina (%)
Place of birth for the foreign-born population - Bulgaria (%)
Place of birth for the foreign-born population - Croatia (%)
Place of birth for the foreign-born population - Czechoslovakia (%)
Place of birth for the foreign-born population - Hungary (%)
Place of birth for the foreign-born population - Latvia (%)
Place of birth for the foreign-born population - Lithuania (%)
Place of birth for the foreign-born population - North Macedonia (Macedonia) (%)
Place of birth for the foreign-born population - Moldova (%)
Place of birth for the foreign-born population - Poland (%)
Place of birth for the foreign-born population - Romania (%)
Place of birth for the foreign-born population - Russia (%)
Place of birth for the foreign-born population - Serbia (%)
Place of birth for the foreign-born population - Ukraine (%)
Place of birth for the foreign-born population - Other Eastern Europe (%)
Place of birth for the foreign-born population - China (%)
Place of birth for the foreign-born population - Hong Kong (%)
Place of birth for the foreign-born population - Taiwan (%)
Place of birth for the foreign-born population - Japan (%)
Place of birth for the foreign-born population - Korea (%)
Place of birth for the foreign-born population - Other Eastern Asia (%)
Place of birth for the foreign-born population - Afghanistan (%)
Place of birth for the foreign-born population - Bangladesh (%)
Place of birth for the foreign-born population - India (%)
Place of birth for the foreign-born population - Iran (%)
Place of birth for the foreign-born population - Kazakhstan (%)
Place of birth for the foreign-born population - Nepal (%)
Place of birth for the foreign-born population - Pakistan (%)
Place of birth for the foreign-born population - Sri Lanka (%)
Place of birth for the foreign-born population - Uzbekistan (%)
Place of birth for the foreign-born population - Other South Central Asia (%)
Place of birth for the foreign-born population - Burma (%)
Place of birth for the foreign-born population - Cambodia (%)
Place of birth for the foreign-born population - Indonesia (%)
Place of birth for the foreign-born population - Laos (%)
Place of birth for the foreign-born population - Malaysia (%)
Place of birth for the foreign-born population - Philippines (%)
Place of birth for the foreign-born population - Singapore (%)
Place of birth for the foreign-born population - Thailand (%)
Place of birth for the foreign-born population - Vietnam (%)
Place of birth for the foreign-born population - Other South Eastern Asia (%)
Place of birth for the foreign-born population - Armenia (%)
Place of birth for the foreign-born population - Iraq (%)
Place of birth for the foreign-born population - Israel (%)
Place of birth for the foreign-born population - Jordan (%)
Place of birth for the foreign-born population - Kuwait (%)
Place of birth for the foreign-born population - Lebanon (%)
Place of birth for the foreign-born population - Saudi Arabia (%)
Place of birth for the foreign-born population - Syria (%)
Place of birth for the foreign-born population - Turkey (%)
Place of birth for the foreign-born population - Yemen (%)
Place of birth for the foreign-born population - Other Western Asia (%)
Place of birth for the foreign-born population - Eritrea (%)
Place of birth for the foreign-born population - Ethiopia (%)
Place of birth for the foreign-born population - Kenya (%)
Place of birth for the foreign-born population - Somalia (%)
Place of birth for the foreign-born population - Uganda (%)
Place of birth for the foreign-born population - Zimbabwe (%)
Place of birth for the foreign-born population - Other Eastern Africa (%)
Place of birth for the foreign-born population - Cameroon (%)
Place of birth for the foreign-born population - Congo (%)
Place of birth for the foreign-born population - Democratic Republic of Congo (Zaire) (%)
Place of birth for the foreign-born population - Other Middle Africa (%)
Place of birth for the foreign-born population - Egypt (%)
Place of birth for the foreign-born population - Morocco (%)
Place of birth for the foreign-born population - Sudan (%)
Place of birth for the foreign-born population - Other Northern Africa (%)
Place of birth for the foreign-born population - South Africa (%)
Place of birth for the foreign-born population - Other Southern Africa (%)
Place of birth for the foreign-born population - Cabo Verde (%)
Place of birth for the foreign-born population - Ghana (%)
Place of birth for the foreign-born population - Liberia (%)
Place of birth for the foreign-born population - Nigeria (%)
Place of birth for the foreign-born population - Senegal (%)
Place of birth for the foreign-born population - Sierra Leone (%)
Place of birth for the foreign-born population - Other Western Africa (%)
Place of birth for the foreign-born population - Australia (%)
Place of birth for the foreign-born population - New Zealand (%)
Place of birth for the foreign-born population - Fiji (%)
Place of birth for the foreign-born population - Micronesia (%)
Place of birth for the foreign-born population - Bahamas (%)
Place of birth for the foreign-born population - Barbados (%)
Place of birth for the foreign-born population - Cuba (%)
Place of birth for the foreign-born population - Dominica (%)
Place of birth for the foreign-born population - Dominican Republic (%)
Place of birth for the foreign-born population - Grenada (%)
Place of birth for the foreign-born population - Haiti (%)
Place of birth for the foreign-born population - Jamaica (%)
Place of birth for the foreign-born population - St. Vincent and the Grenadines (%)
Place of birth for the foreign-born population - Trinidad and Tobago (%)
Place of birth for the foreign-born population - West Indies (%)
Place of birth for the foreign-born population - Other Caribbean (%)
Place of birth for the foreign-born population - Belize (%)
Place of birth for the foreign-born population - Costa Rica (%)
Place of birth for the foreign-born population - El Salvador (%)
Place of birth for the foreign-born population - Guatemala (%)
Place of birth for the foreign-born population - Honduras (%)
Place of birth for the foreign-born population - Mexico (%)
Place of birth for the foreign-born population - Nicaragua (%)
Place of birth for the foreign-born population - Panama (%)
Place of birth for the foreign-born population - Other Central America (%)
Place of birth for the foreign-born population - Argentina (%)
Place of birth for the foreign-born population - Bolivia (%)
Place of birth for the foreign-born population - Brazil (%)
Place of birth for the foreign-born population - Chile (%)
Place of birth for the foreign-born population - Colombia (%)
Place of birth for the foreign-born population - Ecuador (%)
Place of birth for the foreign-born population - Guyana (%)
Place of birth for the foreign-born population - Peru (%)
Place of birth for the foreign-born population - Uruguay (%)
Place of birth for the foreign-born population - Venezuela (%)
Place of birth for the foreign-born population - Other South America (%)
Place of birth for the foreign-born population - Canada (%)
Place of birth for the foreign-born population - Other Northern America (%)
Place of birth for the foreign-born population - Other (%)
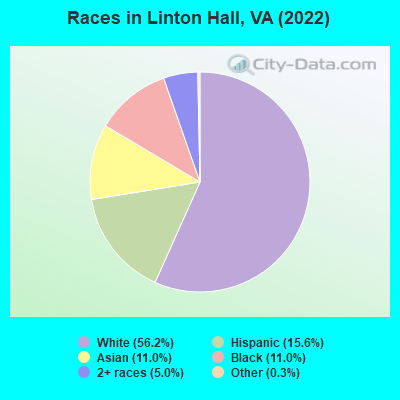
According to 2022 data, the most numerous races in Linton Hall, VA are White alone (24,276 residents), Black alone (4,757 residents), and Hispanic (6,726 residents). 74.5% of Linton Hall residents speak English at home. 17.7% of Linton Hall, VA residents are foreign-born (9.3% born in Asia, 5.0% born in Latin America, 2.4% born in Africa), which is 32.1% greater than the foreign-born rate of 12.0% across the entire state of Virginia.
Race distribution in Linton Hall
2000 2022
4,965,637 70.2% White alone 1,376,378 19.4% Black alone 329,540 4.7% Hispanic 259,277 3.7% Asian alone 114,022 1.6% Two or more races 18,596 0.3% American Indian alone 11,685 0.2% Other race alone 3,380 0.05% Native Hawaiian and Other
5,095,130 58.7% White alone 1,594,785 18.4% Black alone 905,750 10.4% Hispanic 602,881 6.9% Asian alone 406,047 4.7% Two or more races 60,419 0.7% Other race alone 11,738 0.1% American Indian alone 6,869 0.08% Native Hawaiian and Other
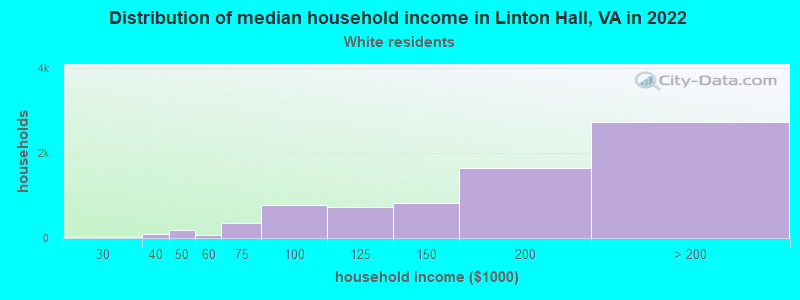
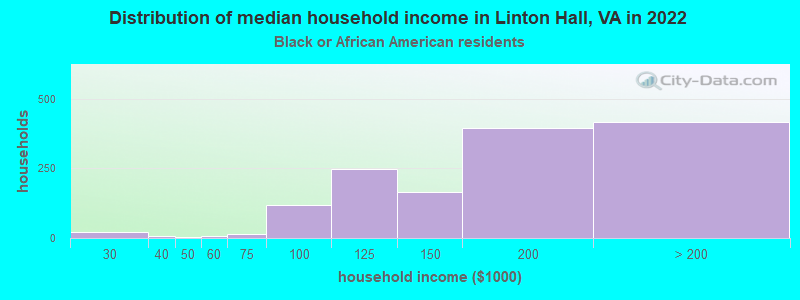
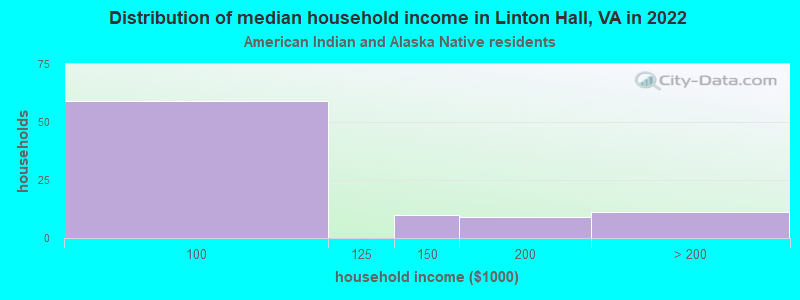
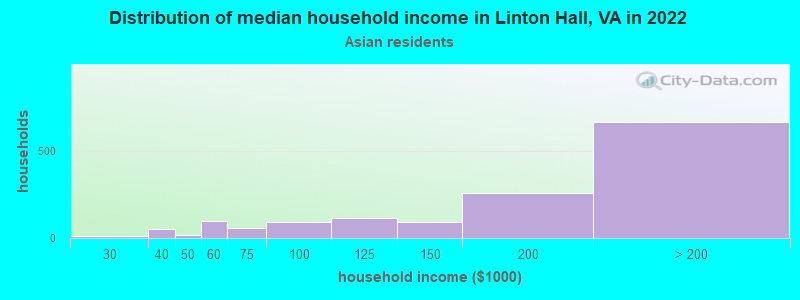
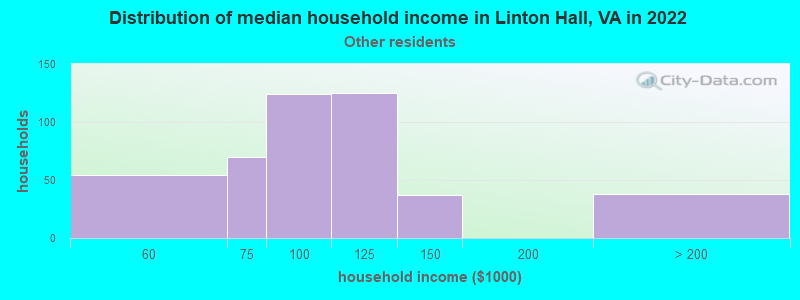
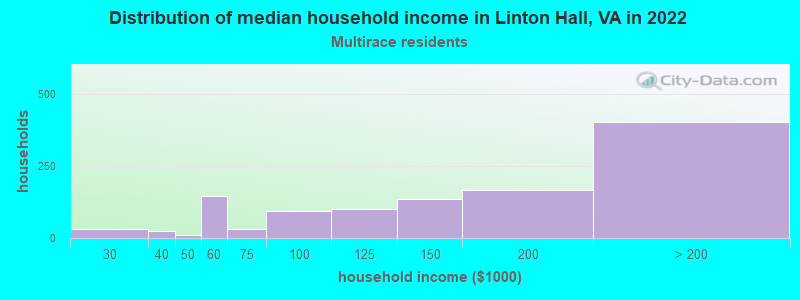
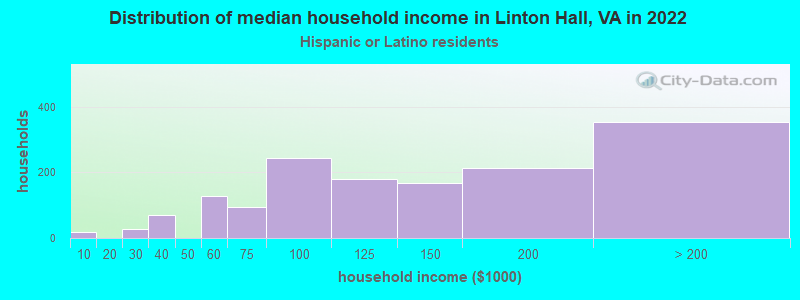
Income and house value in Linton Hall Median household income in 2022 $167,816 White non-Hispanic householders$155,952 Black householders$192,099 Asian householders$93,065 Some other race householders$145,818 Two or more races householders$119,505 Hispanic or Latino race householdersMedian 2022 house value $614,497 White Non-Hispanic householders$502,904 Black or African American householders $637,169 Asian householders$563,264 Some other race householders$677,213 Two or more races householders$567,975 Hispanic or Latino householders
Median age by race in Linton Hall
37.1 Median age for White residents35.0 38.6 37.6 Median age for Black or African American residents40.3 31.6 38.6 Median age for American Indian / Alaska Native residents39.3 52.6 39.9 Median age for Asian residents38.2 41.7 -611,955,419.9 Median age for Native Hawaiian / Pacific Islander residents-541,531,822.5 -714,150,046.8 42.6 Median age for Other race residents47.5 37.7 22.3 Median age for Two or more races residents21.7 23.3 37.3 Median age for White alone residents36.3 37.5 29.5 Median age for Hispanic or Latino residents26.8 35.9
Owner/renter occupied households by race in Linton Hall
House owners and renters - White residents 6,686 89.9% Owner occupied748 10.1% Renter occupiedHouse owners and renters - Black or African American residents 1,359 91.0% Owner occupied135 9.0% Renter occupiedHouse owners and renters - American Indian / Alaska Native residents 110 100.0% Owner occupiedHouse owners and renters - Asian residents 1,177 86.8% Owner occupied179 13.2% Renter occupiedHouse owners and renters - Other race residents 420 82.4% Owner occupied90 17.6% Renter occupiedHouse owners and renters - Two or more races residents 990 83.9% Owner occupied190 16.1% Renter occupiedHouse owners and renters - White alone residents 6,607 89.2% Owner occupied800 10.8% Renter occupiedHouse owners and renters - Hispanic or Latino residents 1,365 89.9% Owner occupied153 10.1% Renter occupied
Language usage in Linton Hall
English speakers - Total 74.5% of residents of Linton Hall speak English at home.
10.4% of residents speak Spanish at home 3,004 71.7% Speak English very well1,187 28.3% Speak English less than very well15.2% of residents speak other language at home 3,914 63.7% Speak English very well2,233 36.3% Speak English less than very well
English speakers - Born in the United States 91.8% of residents of Linton Hall speak English at home.
6.5% of residents speak Spanish at home 737 72.1% Speak English very well285 27.9% Speak English less than very well2.1% of residents speak other language at home 324 96.4% Speak English very well12 3.6% Speak English less than very well
English speakers - Native, born elsewhere 51.8% of residents of Linton Hall speak English at home.
30.7% of residents speak Spanish at home 226 53.6% Speak English very well196 46.4% Speak English less than very well15.8% of residents speak other language at home 175 80.3% Speak English very well43 19.7% Speak English less than very well
English speakers - Foreign-born 16.2% of residents of Linton Hall speak English at home.
24.7% of residents speak Spanish at home 1,076 59.1% Speak English very well745 40.9% Speak English less than very well59.5% of residents speak other language at home 2,348 53.5% Speak English very well2,038 46.5% Speak English less than very well
White (Caucasian) - Speak only English Native:
97.2% (20,953)Foreign-born:
20.3% (271)
White (Caucasian) - Speak another language Native:
4.4% (941)Foreign-born:
80.5% (1,076)
Black or African American - Speak only English Native:
95.1% (3,957)Foreign-born:
26.3% (175)
Black or African American - Speak another language Native:
4.8% (198)Foreign-born:
64.1% (426)
American Indian / Alaska Native - Speak another language Native:
29.8% (44)Foreign-born:
100.0% (46)
Asian - Speak only English Native:
41.9% (636)Foreign-born:
15.0% (465)
Asian - Speak another language Native:
56.4% (855)Foreign-born:
84.9% (2,638)
Other race - Speak only English Native:
40.8% (442)Foreign-born:
10.6% (44)
Other race - Speak another language Native:
59.0% (639)Foreign-born:
90.0% (371)
Two or more races - Speak only English Native:
63.9% (2,529)Foreign-born:
7.2% (79)
Two or more races - Speak another language Native:
37.7% (1,492)Foreign-born:
92.2% (1,010)
White alone - Speak only English Native:
96.6% (20,450)Foreign-born:
16.7% (242)
White alone - Speak another language Native:
3.4% (712)Foreign-born:
84.7% (1,229)
Hispanic or Latino - Speak only English Native:
48.3% (2,013)Foreign-born:
12.1% (246)
Hispanic or Latino - Speak another language Native:
52.2% (2,172)Foreign-born:
89.2% (1,809)
Foreign-born residents in Linton Hall 7,641 residents are foreign born (9.3% Asia , 5.0% Latin America , 2.4% Africa ).
This city:
17.7%Virginia:
12.6%
Marital status for residents in Linton Hall Marital status - White (Caucasian) population 15 years and over
Males 26.7% Never married65.2% Now married1.7% Separated1.9% Widowed4.4% DivorcedFemales 20.0% Never married62.9% Now married2.5% Separated4.8% Widowed9.9% DivorcedWomen who gave birth in the past 12 months Now married:
88.7% (205)Unmarried:
11.3% (26)
Women who did not give birth in the past 12 months Now married:
64.3% (3,504)Unmarried:
35.7% (1,941)
Marital status - Black or African American population 15 years and over
Males 28.8% Never married64.0% Now married1.8% Separated3.6% Widowed1.8% DivorcedFemales 31.4% Never married57.8% Now married0.6% Separated3.1% Widowed7.1% DivorcedWomen who gave birth in the past 12 months Now married:
0.0% (0)Unmarried:
100.0% (11)
Women who did not give birth in the past 12 months Now married:
59.9% (815)Unmarried:
40.1% (545)
Marital status - American Indian / Alaska Native population 15 years and over
Males 36.4% Never married20.0% Now married0.0% Separated0.0% Widowed43.6% DivorcedFemales 13.3% Never married65.0% Now married0.0% Separated0.0% Widowed21.7% DivorcedWomen who did not give birth in the past 12 months Now married:
100.0% (22)Unmarried:
0.0% (0)
Marital status - Asian population 15 years and over
Males 30.7% Never married63.8% Now married0.0% Separated2.4% Widowed3.1% DivorcedFemales 21.8% Never married65.4% Now married0.0% Separated9.3% Widowed3.6% DivorcedWomen who gave birth in the past 12 months Now married:
100.0% (60)Unmarried:
0.0% (0)
Women who did not give birth in the past 12 months Now married:
58.1% (684)Unmarried:
41.9% (492)
Marital status - Other race population 15 years and over
Males 33.5% Never married57.2% Now married0.0% Separated1.8% Widowed7.5% DivorcedFemales 42.9% Never married48.3% Now married0.0% Separated6.2% Widowed2.6% DivorcedWomen who gave birth in the past 12 months Now married:
0.0% (0)Unmarried:
100.0% (15)
Women who did not give birth in the past 12 months Now married:
50.0% (211)Unmarried:
50.0% (211)
Marital status - Two or more races population 15 years and over
Males 45.5% Never married51.2% Now married0.0% Separated0.0% Widowed3.3% DivorcedFemales 29.4% Never married60.7% Now married0.0% Separated1.7% Widowed8.2% DivorcedWomen who gave birth in the past 12 months Now married:
100.0% (15)Unmarried:
0.0% (0)
Women who did not give birth in the past 12 months Now married:
55.8% (815)Unmarried:
44.2% (645)
Marital status - White alone, not Hispanic / Latino population 15 years and over
Males 25.7% Never married66.0% Now married1.6% Separated2.1% Widowed4.6% DivorcedFemales 21.1% Never married61.2% Now married2.8% Separated5.4% Widowed9.5% DivorcedWomen who gave birth in the past 12 months Now married:
88.2% (229)Unmarried:
11.8% (31)
Women who did not give birth in the past 12 months Now married:
62.2% (3,477)Unmarried:
37.8% (2,114)
Marital status - Hispanic or Latino population 15 years and over
Males 33.9% Never married57.9% Now married1.2% Separated0.4% Widowed6.6% DivorcedFemales 21.2% Never married69.4% Now married0.0% Separated1.2% Widowed8.2% DivorcedWomen who gave birth in the past 12 months Now married:
64.5% (21)Unmarried:
35.5% (11)
Women who did not give birth in the past 12 months Now married:
68.6% (1,117)Unmarried:
31.4% (512)
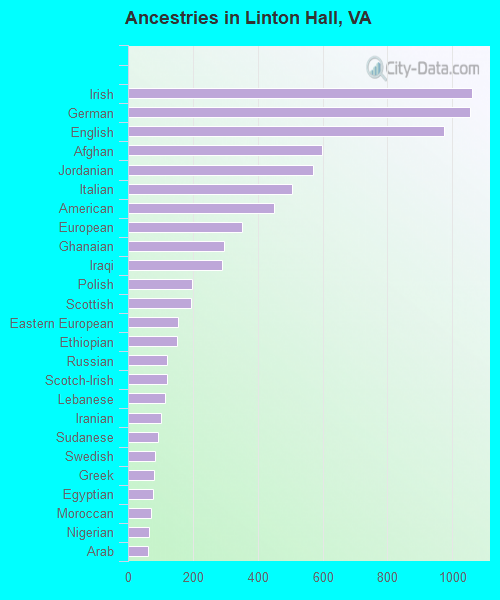
Ancestries in Linton Hall
1,060 5.7% Irish1,054 5.7% German975 5.3% English598 3.2% Afghan569 3.1% Jordanian505 2.7% Italian451 2.4% American353 1.9% European297 1.6% Ghanaian291 1.6% Iraqi196 1.1% Polish194 1.1% Scottish155 0.8% Eastern European152 0.8% Ethiopian121 0.7% Russian119 0.6% Scotch-Irish115 0.6% Lebanese103 0.6% Iranian92 0.5% Sudanese84 0.5% Swedish79 0.4% Greek78 0.4% Egyptian71 0.4% Moroccan64 0.3% Nigerian63 0.3% Arab63 0.3% Dutch59 0.3% Kenyan52 0.3% Turkish51 0.3% French48 0.3% Portuguese45 0.2% Lithuanian44 0.2% Norwegian44 0.2% Ukrainian41 0.2% Liberian41 0.2% Albanian39 0.2% Romanian35 0.2% Hungarian35 0.2% Jamaican31 0.2% Northern European30 0.2% Slovene29 0.2% Palestinian27 0.1% Croatian25 0.1% African22 0.1% Czechoslovakian20 0.1% British19 0.1% Czech18 0.10% Scandinavian18 0.10% Belgian18 0.10% Austrian11 0.06% French Canadian11 0.06% Haitian7 0.04% British West Indian6 0.03% Welsh5 0.03% West Indian
Geographical mobility in Linton Hall Same house 1 year ago 21,333 89.7% White (Caucasian)3,995 82.6% Black or African American177 88.7% American Indian / Alaska Native4,303 89.6% Asian1,396 89.9% Other race4,915 88.5% Two or more races21,749 90.7% White alone, not Hispanic / Latino5,969 89.0% Hispanic or LatinoMoved within same county 882 3.7% White / Caucasian533 11.0% Black or African American267 5.6% Asian22 1.4% Other race359 6.5% Two or more races806 3.4% White alone, not Hispanic / Latino332 4.9% Hispanic or LatinoMoved within same state 947 4.0% White / Caucasian189 3.9% Black or African American65 1.3% Asian104 6.7% Other race171 3.1% Two or more races927 3.9% White alone, not Hispanic / Latino174 2.6% Hispanic or LatinoMoved from different state 397 1.7% White / Caucasian78 1.6% Black or African American14 6.9% American Indian / Alaska Native47 1.0% Asian29 0.5% Two or more races352 1.5% White alone, not Hispanic / Latino40 0.6% Hispanic or LatinoMoved from abroad 33 0.1% White38 0.7% Two or more races53 0.2% White alone, not Hispanic / Latino29 0.4% Hispanic or Latino
Children Nativity (place of birth) in Linton Hall
Children under 6 years - Living with two parents Both parents native 2,064 100.0% Native0 0.0% Foreign-bornBoth parents foreign-born 747 98.1% Native14 1.9% Foreign-bornOne native, one foreign-born parent 344 100.0% NativeChildren under 6 years - Living with one parent Native parent 204 100.0% NativeForeign-born parent 21 84.1% Native4 15.9% Foreign-bornChildren 6 to 17 years - Living with two parents Both parents native 5,737 97.6% Native138 2.4% Foreign-bornBoth parents foreign-born 1,508 83.0% Native309 17.0% Foreign-bornOne native, one foreign-born parent 641 100.0% NativeChildren 6 to 17 years - Living with one parent Native parent 811 100.0% NativeForeign-born parent 454 50.7% Native442 49.3% Foreign-born
Grandparents responsible for own grandchildren in Linton Hall
Grandparents (30 to 59 years) White / Caucasian 65 34.9% Responsible for grandchildren121 65.1% Not responsible for grandchildrenBlack or African American 60 53.2% Responsible for grandchildren53 46.8% Not responsible for grandchildrenAsian 96 100.0% Not responsible for grandchildrenOther race 26 100.0% Not responsible for grandchildrenTwo or more races 20 100.0% Not responsible for grandchildrenWhite alone, not Hispanic / Latino 5 2.9% Responsible for grandchildren170 97.1% Not responsible for grandchildrenHispanic or Latino 105 79.7% Responsible for grandchildren27 20.3% Not responsible for grandchildrenGrandparents (60 years and over) White / Caucasian 53 16.5% Responsible for grandchildren271 83.5% Not responsible for grandchildrenBlack or African American 97 71.3% Responsible for grandchildren39 28.7% Not responsible for grandchildrenAsian 23 18.0% Responsible for grandchildren103 82.0% Not responsible for grandchildrenOther race 27 100.0% Not responsible for grandchildrenTwo or more races 7 13.4% Responsible for grandchildren43 86.6% Not responsible for grandchildrenWhite alone, not Hispanic / Latino 62 18.0% Responsible for grandchildren281 82.0% Not responsible for grandchildrenHispanic or Latino 100 100.0% Not responsible for grandchildren