Races in Lindenwold, New Jersey (NJ) Detailed Stats
Data:
Races - White alone (%)
Races - White alone (% change since 2000)
Races - Black alone (%)
Races - Black alone (% change since 2000)
Races - American Indian alone (%)
Races - American Indian alone (% change since 2000)
Races - Asian alone (%)
Races - Asian alone (% change since 2000)
Races - Hispanic (%)
Races - Hispanic (% change since 2000)
Races - Native Hawaiian and Other Pacific Islander alone (%)
Races - Native Hawaiian and Other Pacific Islander alone (% change since 2000)
Races - Two or more races(%)
Races - Two or more races(% change since 2000)
Races - Other race alone (%)
Races - Other race alone (% change since 2000)
Racial diversity
Place of birth - Born in state of residence (%)
Place of birth - Born in state of residence (%) - White
Place of birth - Born in state of residence (%) - Black or African American
Place of birth - Born in state of residence (%) - Asian
Place of birth - Born in state of residence (%) - Hispanic or Latino
Place of birth - Born in state of residence (%) - American Indian and Alaska Native
Place of birth - Born in state of residence (%) - Multirace
Place of birth - Born in state of residence (%) - Other Race
Place of birth - Born in other state (%)
Place of birth - Born in other state (%) - White
Place of birth - Born in other state (%) - Black or African American
Place of birth - Born in other state (%) - Asian
Place of birth - Born in other state (%) - Hispanic or Latino
Place of birth - Born in other state (%) - American Indian and Alaska Native
Place of birth - Born in other state (%) - Multirace
Place of birth - Born in other state (%) - Other Race
Place of birth - Native, outside of US (%)
Place of birth - Native, outside of US (%) - White
Place of birth - Native, outside of US (%) - Black or African American
Place of birth - Native, outside of US (%) - Asian
Place of birth - Native, outside of US (%) - Hispanic or Latino
Place of birth - Native, outside of US (%) - American Indian and Alaska Native
Place of birth - Native, outside of US (%) - Multirace
Place of birth - Native, outside of US (%) - Other Race
Place of birth - Foreign born (%)
Place of birth - Foreign born (%) - White
Place of birth - Foreign born (%) - Black or African American
Place of birth - Foreign born (%) - Asian
Place of birth - Foreign born (%) - Hispanic or Latino
Place of birth - Foreign born (%) - American Indian and Alaska Native
Place of birth - Foreign born (%) - Multirace
Place of birth - Foreign born (%) - Other Race
Residents speaking English at home (%)
Residents speaking English at home - Born in the United States (%)
Residents speaking English at home - Native, born elsewhere (%)
Residents speaking English at home - Foreign born (%)
Residents speaking Spanish at home (%)
Residents speaking Spanish at home - Born in the United States (%)
Residents speaking Spanish at home - Native, born elsewhere (%)
Residents speaking Spanish at home - Foreign born (%)
Residents speaking other language at home (%)
Residents speaking other language at home - Born in the United States (%)
Residents speaking other language at home - Native, born elsewhere (%)
Residents speaking other language at home - Foreign born (%)
Marital status - Never married (%)
Marital status - Now married (%)
Marital status - Separated (%)
Marital status - Widowed (%)
Marital status - Divorced (%)
Ancestries Reported - Arab (%)
Ancestries Reported - Czech (%)
Ancestries Reported - Danish (%)
Ancestries Reported - Dutch (%)
Ancestries Reported - English (%)
Ancestries Reported - French (%)
Ancestries Reported - French Canadian (%)
Ancestries Reported - German (%)
Ancestries Reported - Greek (%)
Ancestries Reported - Hungarian (%)
Ancestries Reported - Irish (%)
Ancestries Reported - Italian (%)
Ancestries Reported - Lithuanian (%)
Ancestries Reported - Norwegian (%)
Ancestries Reported - Polish (%)
Ancestries Reported - Portuguese (%)
Ancestries Reported - Russian (%)
Ancestries Reported - Scotch-Irish (%)
Ancestries Reported - Scottish (%)
Ancestries Reported - Slovak (%)
Ancestries Reported - Subsaharan African (%)
Ancestries Reported - Swedish (%)
Ancestries Reported - Swiss (%)
Ancestries Reported - Ukrainian (%)
Ancestries Reported - United States (%)
Ancestries Reported - Welsh (%)
Ancestries Reported - West Indian (%)
Ancestries Reported - Other (%)
Geographical mobility - Same house 1 year ago (%)
Geographical mobility - Same house 1 year ago (%) - White
Geographical mobility - Same house 1 year ago (%) - Black or African American
Geographical mobility - Same house 1 year ago (%) - Asian
Geographical mobility - Same house 1 year ago (%) - Hispanic or Latino
Geographical mobility - Same house 1 year ago (%) - American Indian and Alaska Native
Geographical mobility - Same house 1 year ago (%) - Multirace
Geographical mobility - Same house 1 year ago (%) - Other Race
Geographical mobility - Moved within same county (%)
Geographical mobility - Moved within same county (%) - White
Geographical mobility - Moved within same county (%) - Black or African American
Geographical mobility - Moved within same county (%) - Asian
Geographical mobility - Moved within same county (%) - Hispanic or Latino
Geographical mobility - Moved within same county (%) - American Indian and Alaska Native
Geographical mobility - Moved within same county (%) - Multirace
Geographical mobility - Moved within same county (%) - Other Race
Geographical mobility - Moved from different county within same state (%)
Geographical mobility - Moved from different county within same state (%) - White
Geographical mobility - Moved from different county within same state (%) - Black or African American
Geographical mobility - Moved from different county within same state (%) - Asian
Geographical mobility - Moved from different county within same state (%) - Hispanic or Latino
Geographical mobility - Moved from different county within same state (%) - American Indian and Alaska Native
Geographical mobility - Moved from different county within same state (%) - Multirace
Geographical mobility - Moved from different county within same state (%) - Other Race
Geographical mobility - Moved from different state (%)
Geographical mobility - Moved from different state (%) - White
Geographical mobility - Moved from different state (%) - Black or African American
Geographical mobility - Moved from different state (%) - Asian
Geographical mobility - Moved from different state (%) - Hispanic or Latino
Geographical mobility - Moved from different state (%) - American Indian and Alaska Native
Geographical mobility - Moved from different state (%) - Multirace
Geographical mobility - Moved from different state (%) - Other Race
Geographical mobility - Moved from abroad (%)
Geographical mobility - Moved from abroad (%) - White
Geographical mobility - Moved from abroad (%) - Black or African American
Geographical mobility - Moved from abroad (%) - Asian
Geographical mobility - Moved from abroad (%) - Hispanic or Latino
Geographical mobility - Moved from abroad (%) - American Indian and Alaska Native
Geographical mobility - Moved from abroad (%) - Multirace
Geographical mobility - Moved from abroad (%) - Other Race
Place of birth for the foreign-born population - Ireland (%)
Place of birth for the foreign-born population - Denmark (%)
Place of birth for the foreign-born population - Norway (%)
Place of birth for the foreign-born population - Sweden (%)
Place of birth for the foreign-born population - United Kingdom (%)
Place of birth for the foreign-born population - England (%)
Place of birth for the foreign-born population - Scotland (%)
Place of birth for the foreign-born population - Other Northern Europe (%)
Place of birth for the foreign-born population - Austria (%)
Place of birth for the foreign-born population - Belgium (%)
Place of birth for the foreign-born population - France (%)
Place of birth for the foreign-born population - Germany (%)
Place of birth for the foreign-born population - Netherlands (%)
Place of birth for the foreign-born population - Switzerland (%)
Place of birth for the foreign-born population - Other Western Europe (%)
Place of birth for the foreign-born population - Greece (%)
Place of birth for the foreign-born population - Italy (%)
Place of birth for the foreign-born population - Portugal (%)
Place of birth for the foreign-born population - Spain (%)
Place of birth for the foreign-born population - Other Southern Europe (%)
Place of birth for the foreign-born population - Albania (%)
Place of birth for the foreign-born population - Belarus (%)
Place of birth for the foreign-born population - Bosnia and Herzegovina (%)
Place of birth for the foreign-born population - Bulgaria (%)
Place of birth for the foreign-born population - Croatia (%)
Place of birth for the foreign-born population - Czechoslovakia (%)
Place of birth for the foreign-born population - Hungary (%)
Place of birth for the foreign-born population - Latvia (%)
Place of birth for the foreign-born population - Lithuania (%)
Place of birth for the foreign-born population - North Macedonia (Macedonia) (%)
Place of birth for the foreign-born population - Moldova (%)
Place of birth for the foreign-born population - Poland (%)
Place of birth for the foreign-born population - Romania (%)
Place of birth for the foreign-born population - Russia (%)
Place of birth for the foreign-born population - Serbia (%)
Place of birth for the foreign-born population - Ukraine (%)
Place of birth for the foreign-born population - Other Eastern Europe (%)
Place of birth for the foreign-born population - China (%)
Place of birth for the foreign-born population - Hong Kong (%)
Place of birth for the foreign-born population - Taiwan (%)
Place of birth for the foreign-born population - Japan (%)
Place of birth for the foreign-born population - Korea (%)
Place of birth for the foreign-born population - Other Eastern Asia (%)
Place of birth for the foreign-born population - Afghanistan (%)
Place of birth for the foreign-born population - Bangladesh (%)
Place of birth for the foreign-born population - India (%)
Place of birth for the foreign-born population - Iran (%)
Place of birth for the foreign-born population - Kazakhstan (%)
Place of birth for the foreign-born population - Nepal (%)
Place of birth for the foreign-born population - Pakistan (%)
Place of birth for the foreign-born population - Sri Lanka (%)
Place of birth for the foreign-born population - Uzbekistan (%)
Place of birth for the foreign-born population - Other South Central Asia (%)
Place of birth for the foreign-born population - Burma (%)
Place of birth for the foreign-born population - Cambodia (%)
Place of birth for the foreign-born population - Indonesia (%)
Place of birth for the foreign-born population - Laos (%)
Place of birth for the foreign-born population - Malaysia (%)
Place of birth for the foreign-born population - Philippines (%)
Place of birth for the foreign-born population - Singapore (%)
Place of birth for the foreign-born population - Thailand (%)
Place of birth for the foreign-born population - Vietnam (%)
Place of birth for the foreign-born population - Other South Eastern Asia (%)
Place of birth for the foreign-born population - Armenia (%)
Place of birth for the foreign-born population - Iraq (%)
Place of birth for the foreign-born population - Israel (%)
Place of birth for the foreign-born population - Jordan (%)
Place of birth for the foreign-born population - Kuwait (%)
Place of birth for the foreign-born population - Lebanon (%)
Place of birth for the foreign-born population - Saudi Arabia (%)
Place of birth for the foreign-born population - Syria (%)
Place of birth for the foreign-born population - Turkey (%)
Place of birth for the foreign-born population - Yemen (%)
Place of birth for the foreign-born population - Other Western Asia (%)
Place of birth for the foreign-born population - Eritrea (%)
Place of birth for the foreign-born population - Ethiopia (%)
Place of birth for the foreign-born population - Kenya (%)
Place of birth for the foreign-born population - Somalia (%)
Place of birth for the foreign-born population - Uganda (%)
Place of birth for the foreign-born population - Zimbabwe (%)
Place of birth for the foreign-born population - Other Eastern Africa (%)
Place of birth for the foreign-born population - Cameroon (%)
Place of birth for the foreign-born population - Congo (%)
Place of birth for the foreign-born population - Democratic Republic of Congo (Zaire) (%)
Place of birth for the foreign-born population - Other Middle Africa (%)
Place of birth for the foreign-born population - Egypt (%)
Place of birth for the foreign-born population - Morocco (%)
Place of birth for the foreign-born population - Sudan (%)
Place of birth for the foreign-born population - Other Northern Africa (%)
Place of birth for the foreign-born population - South Africa (%)
Place of birth for the foreign-born population - Other Southern Africa (%)
Place of birth for the foreign-born population - Cabo Verde (%)
Place of birth for the foreign-born population - Ghana (%)
Place of birth for the foreign-born population - Liberia (%)
Place of birth for the foreign-born population - Nigeria (%)
Place of birth for the foreign-born population - Senegal (%)
Place of birth for the foreign-born population - Sierra Leone (%)
Place of birth for the foreign-born population - Other Western Africa (%)
Place of birth for the foreign-born population - Australia (%)
Place of birth for the foreign-born population - New Zealand (%)
Place of birth for the foreign-born population - Fiji (%)
Place of birth for the foreign-born population - Micronesia (%)
Place of birth for the foreign-born population - Bahamas (%)
Place of birth for the foreign-born population - Barbados (%)
Place of birth for the foreign-born population - Cuba (%)
Place of birth for the foreign-born population - Dominica (%)
Place of birth for the foreign-born population - Dominican Republic (%)
Place of birth for the foreign-born population - Grenada (%)
Place of birth for the foreign-born population - Haiti (%)
Place of birth for the foreign-born population - Jamaica (%)
Place of birth for the foreign-born population - St. Vincent and the Grenadines (%)
Place of birth for the foreign-born population - Trinidad and Tobago (%)
Place of birth for the foreign-born population - West Indies (%)
Place of birth for the foreign-born population - Other Caribbean (%)
Place of birth for the foreign-born population - Belize (%)
Place of birth for the foreign-born population - Costa Rica (%)
Place of birth for the foreign-born population - El Salvador (%)
Place of birth for the foreign-born population - Guatemala (%)
Place of birth for the foreign-born population - Honduras (%)
Place of birth for the foreign-born population - Mexico (%)
Place of birth for the foreign-born population - Nicaragua (%)
Place of birth for the foreign-born population - Panama (%)
Place of birth for the foreign-born population - Other Central America (%)
Place of birth for the foreign-born population - Argentina (%)
Place of birth for the foreign-born population - Bolivia (%)
Place of birth for the foreign-born population - Brazil (%)
Place of birth for the foreign-born population - Chile (%)
Place of birth for the foreign-born population - Colombia (%)
Place of birth for the foreign-born population - Ecuador (%)
Place of birth for the foreign-born population - Guyana (%)
Place of birth for the foreign-born population - Peru (%)
Place of birth for the foreign-born population - Uruguay (%)
Place of birth for the foreign-born population - Venezuela (%)
Place of birth for the foreign-born population - Other South America (%)
Place of birth for the foreign-born population - Canada (%)
Place of birth for the foreign-born population - Other Northern America (%)
Place of birth for the foreign-born population - Other (%)
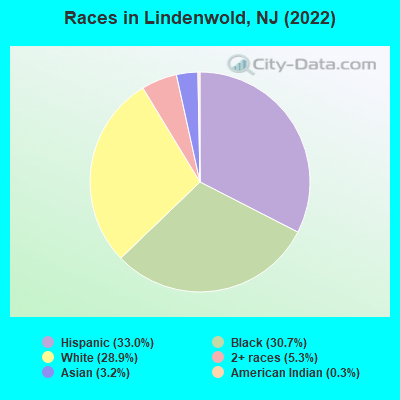
According to 2022 data, the most numerous races in Lindenwold, NJ are White alone (6,191 residents), Hispanic (7,067 residents), and Black alone (6,569 residents). 69.1% of Lindenwold residents speak English at home. 21.7% of Lindenwold, NJ residents are foreign-born (15.6% born in Latin America, 3.4% born in Asia), which is 6.1% less than the foreign-born rate of 23.0% across the entire state of New Jersey.
Race distribution in Lindenwold
2000 2022
5,557,209 66.0% White alone 1,117,191 13.3% Hispanic 1,096,171 13.0% Black alone 477,012 5.7% Asian alone 133,689 1.6% Two or more races 19,565 0.2% Other race alone 11,338 0.1% American Indian alone 2,175 0.03% Native Hawaiian and Other
4,766,476 51.5% White alone 2,028,470 21.9% Hispanic 1,111,632 12.0% Black alone 923,546 10.0% Asian alone 332,237 3.6% Two or more races 89,847 1.0% Other race alone 8,557 0.09% American Indian alone 934 0.01% Native Hawaiian and Other
Income and house value in Lindenwold Median household income in 2022 $66,199 White non-Hispanic householders$50,090 Black householders$92,965 American Indian and Alaska Native householders$78,345 Asian householders$37,719 Some other race householders$35,232 Two or more races householders$40,000 Hispanic or Latino race householdersMedian 2022 house value $176,192 White Non-Hispanic householders$181,448 Black or African American householders $169,884 Asian householders$236,534 Native Hawaiian and other Pacific Islander householders$193,012 Some other race householders$144,233 Two or more races householders$172,197 Hispanic or Latino householders
Median age by race in Lindenwold
47.2 Median age for White residents48.0 46.3 36.6 Median age for Black or African American residents36.1 35.9 35.1 Median age for American Indian / Alaska Native residents2.0 60.2 60.5 Median age for Asian residents60.1 50.1 -701,509,871.5 Median age for Native Hawaiian / Pacific Islander residents-860,335,194.7 -668,881,505.4 27.8 Median age for Other race residents24.6 31.9 29.0 Median age for Two or more races residents20.7 33.4 49.2 Median age for White alone residents49.5 48.2 26.9 Median age for Hispanic or Latino residents23.3 27.2
Owner/renter occupied households by race in Lindenwold
House owners and renters - White residents 2,099 57.9% Owner occupied1,528 42.1% Renter occupiedHouse owners and renters - Black or African American residents 629 20.2% Owner occupied2,480 79.8% Renter occupiedHouse owners and renters - American Indian / Alaska Native residents 4 4.5% Owner occupied87 95.5% Renter occupiedHouse owners and renters - Asian residents 164 51.2% Owner occupied156 48.8% Renter occupiedHouse owners and renters - Other race residents 222 15.4% Owner occupied1,223 84.6% Renter occupiedHouse owners and renters - Two or more races residents 161 23.3% Owner occupied531 76.7% Renter occupiedHouse owners and renters - White alone residents 1,933 56.4% Owner occupied1,494 43.6% Renter occupiedHouse owners and renters - Hispanic or Latino residents 482 23.0% Owner occupied1,613 77.0% Renter occupied
Language usage in Lindenwold
English speakers - Total 69.1% of residents of Lindenwold speak English at home.
28.7% of residents speak Spanish at home 2,563 44.8% Speak English very well3,157 55.2% Speak English less than very well4.5% of residents speak other language at home 395 43.9% Speak English very well504 56.1% Speak English less than very well
English speakers - Born in the United States 95.9% of residents of Lindenwold speak English at home.
4.6% of residents speak Spanish at home 129 56.1% Speak English very well101 43.9% Speak English less than very well
English speakers - Native, born elsewhere 16.3% of residents of Lindenwold speak English at home.
76.1% of residents speak Spanish at home 299 76.5% Speak English very well92 23.5% Speak English less than very well14.4% of residents speak other language at home 74 100.0% Speak English less than very well
English speakers - Foreign-born 17.6% of residents of Lindenwold speak English at home.
74.5% of residents speak Spanish at home 858 24.2% Speak English very well2,686 75.8% Speak English less than very well17.2% of residents speak other language at home 371 45.4% Speak English very well447 54.6% Speak English less than very well
White (Caucasian) - Speak only English Native:
90.3% (6,086)Foreign-born:
23.7% (90)
White (Caucasian) - Speak another language Native:
9.3% (625)Foreign-born:
76.4% (289)
Black or African American - Speak only English Native:
100.0% (5,407)Foreign-born:
72.4% (607)
Black or African American - Speak another language Native:
0.6% (31)Foreign-born:
31.4% (263)
Asian - Speak only English Native:
100.0% (45)Foreign-born:
16.0% (100)
Other race - Speak only English Native:
20.3% (361)Foreign-born:
2.0% (49)
Other race - Speak another language Native:
78.4% (1,392)Foreign-born:
97.8% (2,382)
Two or more races - Speak only English Native:
70.9% (870)Foreign-born:
5.0% (39)
Two or more races - Speak another language Native:
28.7% (352)Foreign-born:
94.4% (734)
White alone - Speak only English Native:
98.5% (5,899)Foreign-born:
43.5% (69)
White alone - Speak another language Native:
1.0% (63)Foreign-born:
55.1% (87)
Hispanic or Latino - Speak only English Native:
27.0% (805)Foreign-born:
3.2% (114)
Hispanic or Latino - Speak another language Native:
73.6% (2,192)Foreign-born:
97.9% (3,481)
Foreign-born residents in Lindenwold 4,644 residents are foreign born (15.6% Latin America , 3.4% Asia ).
This city:
21.7%New Jersey:
23.2%
Marital status for residents in Lindenwold Marital status - White (Caucasian) population 15 years and over
Males 36.6% Never married34.5% Now married7.6% Separated4.2% Widowed17.1% DivorcedFemales 32.9% Never married32.3% Now married1.0% Separated10.3% Widowed23.5% DivorcedWomen who gave birth in the past 12 months Now married:
100.0% (46)Unmarried:
0.0% (0)
Women who did not give birth in the past 12 months Now married:
29.5% (461)Unmarried:
70.5% (1,102)
Marital status - Black or African American population 15 years and over
Males 37.5% Never married35.9% Now married5.6% Separated3.0% Widowed18.0% DivorcedFemales 50.8% Never married27.4% Now married2.8% Separated9.1% Widowed9.9% DivorcedWomen who gave birth in the past 12 months Now married:
100.0% (31)Unmarried:
0.0% (0)
Women who did not give birth in the past 12 months Now married:
30.6% (530)Unmarried:
69.4% (1,201)
Marital status - American Indian / Alaska Native population 15 years and over
Males 41.7% Never married50.0% Now married0.0% Separated0.0% Widowed8.3% DivorcedFemales 34.6% Never married19.2% Now married12.8% Separated0.0% Widowed33.3% DivorcedWomen who did not give birth in the past 12 months Now married:
100.0% (39)Unmarried:
0.0% (0)
Marital status - Asian population 15 years and over
Males 9.1% Never married74.9% Now married4.2% Separated0.0% Widowed11.7% DivorcedFemales 18.6% Never married61.7% Now married0.0% Separated19.7% Widowed0.0% DivorcedWomen who gave birth in the past 12 months Now married:
100.0% (43)Unmarried:
0.0% (0)
Women who did not give birth in the past 12 months Now married:
67.9% (97)Unmarried:
32.1% (46)
Marital status - Other race population 15 years and over
Males 40.0% Never married47.8% Now married6.1% Separated0.0% Widowed6.1% DivorcedFemales 39.2% Never married50.2% Now married3.6% Separated0.9% Widowed6.1% DivorcedWomen who gave birth in the past 12 months Now married:
100.0% (13)Unmarried:
0.0% (0)
Women who did not give birth in the past 12 months Now married:
51.9% (652)Unmarried:
48.1% (604)
Marital status - Two or more races population 15 years and over
Males 35.9% Never married64.1% Now married0.0% Separated0.0% Widowed0.0% DivorcedFemales 41.6% Never married29.4% Now married3.9% Separated0.0% Widowed25.1% DivorcedWomen who gave birth in the past 12 months Now married:
100.0% (37)Unmarried:
0.0% (0)
Women who did not give birth in the past 12 months Now married:
33.7% (193)Unmarried:
66.3% (379)
Marital status - White alone, not Hispanic / Latino population 15 years and over
Males 35.0% Never married35.6% Now married8.2% Separated4.0% Widowed17.1% DivorcedFemales 32.7% Never married32.3% Now married1.1% Separated11.4% Widowed22.4% DivorcedWomen who gave birth in the past 12 months Now married:
100.0% (21)Unmarried:
0.0% (0)
Women who did not give birth in the past 12 months Now married:
30.7% (406)Unmarried:
69.3% (919)
Marital status - Hispanic or Latino population 15 years and over
Males 41.9% Never married44.7% Now married4.5% Separated1.1% Widowed7.8% DivorcedFemales 44.7% Never married41.8% Now married3.2% Separated1.0% Widowed9.3% DivorcedWomen who gave birth in the past 12 months Now married:
100.0% (68)Unmarried:
0.0% (0)
Women who did not give birth in the past 12 months Now married:
41.9% (818)Unmarried:
58.1% (1,135)
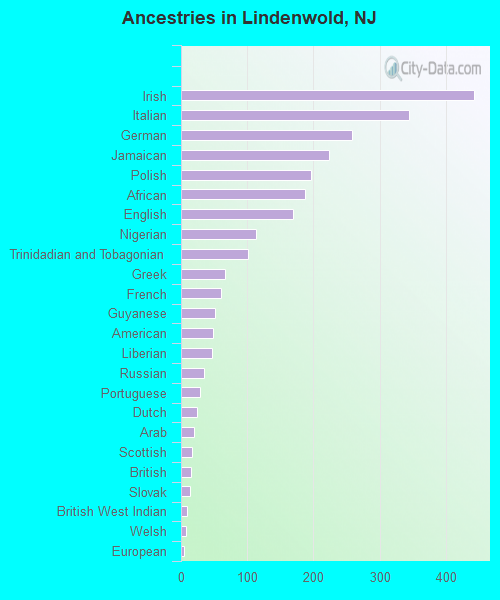
Ancestries in Lindenwold
443 3.6% Irish344 2.8% Italian258 2.1% German224 1.8% Jamaican197 1.6% Polish188 1.5% African169 1.4% English114 0.9% Nigerian101 0.8% Trinidadian and Tobagonian66 0.5% Greek60 0.5% French52 0.4% Guyanese49 0.4% American47 0.4% Liberian34 0.3% Russian29 0.2% Portuguese24 0.2% Dutch19 0.2% Arab16 0.1% Scottish15 0.1% British13 0.1% Slovak9 0.07% British West Indian8 0.06% Welsh5 0.04% European3 0.02% Scotch-Irish
Geographical mobility in Lindenwold Same house 1 year ago 6,402 87.7% White (Caucasian)5,593 85.1% Black or African American236 96.6% American Indian / Alaska Native663 94.0% Asian4,278 92.7% Other race1,982 90.0% Two or more races5,235 84.8% White alone, not Hispanic / Latino6,332 90.7% Hispanic or LatinoMoved within same county 468 6.4% White / Caucasian676 10.3% Black or African American11 1.6% Asian419 9.1% Other race124 5.7% Two or more races473 7.7% White alone, not Hispanic / Latino558 8.0% Hispanic or LatinoMoved within same state 153 2.1% White / Caucasian81 1.2% Black or African American32 4.5% Asian15 0.3% Other race164 2.7% White alone, not Hispanic / Latino10 0.1% Hispanic or LatinoMoved from different state 155 2.1% White / Caucasian86 1.3% Black or African American35 1.6% Two or more races156 2.5% White alone, not Hispanic / Latino15 0.2% Hispanic or LatinoMoved from abroad 60 0.9% Black or African American45 0.6% Hispanic or Latino
Children Nativity (place of birth) in Lindenwold
Children under 6 years - Living with two parents Both parents native 210 100.0% NativeBoth parents foreign-born 771 100.0% NativeOne native, one foreign-born parent 80 100.0% NativeChildren under 6 years - Living with one parent Native parent 491 100.0% NativeForeign-born parent 93 97.3% Native3 2.7% Foreign-bornChildren 6 to 17 years - Living with two parents Both parents native 298 100.0% NativeBoth parents foreign-born 902 88.7% Native115 11.3% Foreign-bornOne native, one foreign-born parent 80 100.0% NativeChildren 6 to 17 years - Living with one parent Native parent 900 100.0% NativeForeign-born parent 420 57.8% Native307 42.2% Foreign-born
Grandparents responsible for own grandchildren in Lindenwold
Grandparents (30 to 59 years) White / Caucasian 74 100.0% Not responsible for grandchildrenBlack or African American 109 76.1% Responsible for grandchildren34 23.9% Not responsible for grandchildrenAmerican Indian / Alaska Native 60 100.0% Not responsible for grandchildrenOther race 10 100.0% Not responsible for grandchildrenTwo or more races 13 100.0% Not responsible for grandchildrenWhite alone, not Hispanic / Latino 32 100.0% Not responsible for grandchildrenHispanic or Latino 107 100.0% Not responsible for grandchildren
Grandparents (60 years and over) White / Caucasian 61 100.0% Not responsible for grandchildrenBlack or African American 20 100.0% Not responsible for grandchildrenAmerican Indian / Alaska Native 52 100.0% Not responsible for grandchildrenTwo or more races 2 100.0% Not responsible for grandchildrenWhite alone, not Hispanic / Latino 22 100.0% Not responsible for grandchildrenHispanic or Latino 25 100.0% Not responsible for grandchildren