Races in Lincolnton, North Carolina (NC) Detailed Stats
Ancestries, Foreign-born residents, place of birth
Settings
X


Recent posts about races in Lincolnton, North Carolina on our local forum with over 2,400,000 registered users:
 | Possible job opportunity in Lincolnton, NC (12 replies) |
| Nice Burbs with built up downtowns (25 replies) |
| Areas in NC that are up and coming like Apex was but less expensive (18 replies) |
| Property Taxes - Dispelling the Myth that "Meck is the Highest" (36 replies) |
| Go back to my heritage? (17 replies) |
| Please help us decide between Statesville & Lincolnton (17 replies) |
Latest news about races in Lincolnton, NC collected exclusively by city-data.com from local newspapers, TV, and radio stations
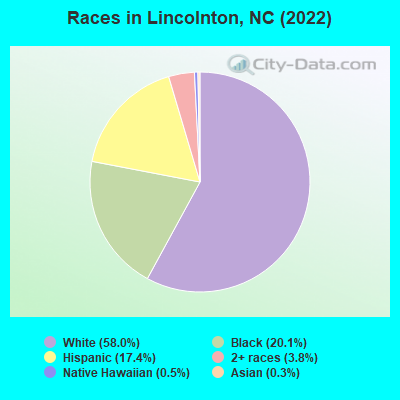
According to 2022 data, the most numerous races in Lincolnton, NC are White alone (6,656 residents), Black alone (2,308 residents), and Hispanic (1,998 residents). 85.6% of Lincolnton residents speak English at home. 7.9% of Lincolnton, NC residents are foreign-born (6.6% born in Latin America, 0.9% born in Europe), which is about the same as the foreign-born rate of 8.0% across the entire state of North Carolina.
Race distribution in Lincolnton
2000
2022

- 6,99970.2%White alone
- 1,49115.0%Hispanic
- 1,32813.3%Black alone
- 700.7%Two or more races
- 350.4%Asian alone
- 260.3%American Indian alone
- 160.2%Other race alone

-
- 6,65658.0%White alone
- 2,30820.1%Black alone
- 1,99817.4%Hispanic
- 4383.8%Two or more races
- 520.5%Native Hawaiian and Other
Pacific Islander alone - 400.3%Asian alone
2000
2022
-
- 5,647,15570.2%White alone
- 1,723,30121.4%Black alone
- 378,9634.7%Hispanic
- 112,4161.4%Asian alone
- 95,3331.2%American Indian alone
- 79,9651.0%Two or more races
- 9,0150.1%Other race alone
- 3,1650.04%Native Hawaiian and Other
Pacific Islander alone

-
- 6,497,51960.7%White alone
- 2,155,65020.1%Black alone
- 1,114,79910.4%Hispanic
- 438,0614.1%Two or more races
- 341,0523.2%Asian alone
- 91,7580.9%American Indian alone
- 50,1800.5%Other race alone
- 9,9540.09%Native Hawaiian and Other
Pacific Islander alone

Income and house value in Lincolnton
- Median household income in 2022
- $53,727White non-Hispanic householders
- $34,521Black householders
- $53,324Some other race householders
- $30,685Two or more races householders
- $45,947Hispanic or Latino race householders
- Median 2022 house value
- $251,294White Non-Hispanic householders
- $202,152Black or African American householders
- $125,647American Indian or Alaska Native householders
- $767,843Asian householders
- $163,620Some other race householders
- $205,223Hispanic or Latino householders
Household income for White non-Hispanic householders

Household income for Black householders

Household income for Some other race householders

Household income for Two or more races householders

Household income for Hispanic or Latino race householders

Median age by race in Lincolnton
- 43.3Median age for White residents
- 42.8Males
- 43.0Females
- 30.0Median age for Black or African American residents
- 40.1Males
- 27.5Females
- -666,666,666.0Median age for American Indian / Alaska Native residents
- -668,604,650.5Males
- -682,971,013.8Females
- 83.0Median age for Asian residents
- -682,080,924.2Males
- -689,075,629.6Females
- -666,666,666.0Median age for Native Hawaiian / Pacific Islander residents
- -666,666,666.0Males
- -666,666,666.0Females
- 49.0Median age for Other race residents
- 41.9Males
- 54.6Females
- 22.1Median age for Two or more races residents
- 20.7Males
- 23.7Females
- 46.6Median age for White alone residents
- 46.3Males
- 45.7Females
- 19.6Median age for Hispanic or Latino residents
- 18.3Males
- 24.0Females
Owner/renter occupied households by race in Lincolnton
- House owners and renters - White residents
- 1,90860.4%Owner occupied
- 1,25039.6%Renter occupied
- House owners and renters - Black or African American residents
- 15014.8%Owner occupied
- 86685.2%Renter occupied
- House owners and renters - Asian residents
- 10100.0%Owner occupied
- House owners and renters - Native Hawaiian / Pacific Islander residents
- 37100.0%Renter occupied
- House owners and renters - Other race residents
- 115.4%Owner occupied
- 19094.6%Renter occupied
- House owners and renters - Two or more races residents
- 9815.6%Owner occupied
- 53084.4%Renter occupied
- House owners and renters - White alone residents
- 1,89763.5%Owner occupied
- 1,08936.5%Renter occupied
- House owners and renters - Hispanic or Latino residents
- 8712.9%Owner occupied
- 59087.1%Renter occupied
Language usage in Lincolnton
- English speakers - Total
- 85.6% of residents of Lincolnton speak English at home.
- 11.8% of residents speak Spanish at home
- 60447.5%Speak English very well
- 66752.5%Speak English less than very well
- 2.3% of residents speak other language at home
- 22388.5%Speak English very well
- 2911.5%Speak English less than very well
- English speakers - Born in the United States
- 88.4% of residents of Lincolnton speak English at home.
- 14.2% of residents speak Spanish at home
- 58396.8%Speak English very well
- 193.2%Speak English less than very well
- English speakers - Native, born elsewhere
- 69.6% of residents of Lincolnton speak English at home.
- 10.8% of residents speak Spanish at home
- 17100.0%Speak English less than very well
- 20.3% of residents speak other language at home
- 32100.0%Speak English very well
- English speakers - Foreign-born
- 4.9% of residents of Lincolnton speak English at home.
- 80.6% of residents speak Spanish at home
- 5711.3%Speak English very well
- 44988.7%Speak English less than very well
- 20.7% of residents speak other language at home
- 6146.9%Speak English very well
- 6953.1%Speak English less than very well
White (Caucasian) - Speak another language
| Native: | 3.2% (207) |
| Foreign-born: | 83.5% (213) |
Other race - Speak only English
| Native: | 34.4% (30) |
| Foreign-born: | 22.1% (40) |
Other race - Speak another language
| Native: | 100.0% (88) |
| Foreign-born: | 97.8% (177) |
Two or more races - Speak another language
| Native: | 36.2% (458) |
| Foreign-born: | 100.0% (219) |
White alone - Speak another language
| Native: | 3.9% (239) |
| Foreign-born: | 99.9% (69) |
Hispanic or Latino - Speak only English
| Native: | 60.9% (738) |
| Foreign-born: | 9.5% (40) |
Hispanic or Latino - Speak another language
| Native: | 42.7% (518) |
| Foreign-born: | 100.0% (422) |
Foreign-born residents in Lincolnton
933 residents are foreign born (6.6% Latin America, 0.9% Europe).
| This city: | 7.9% |
| North Carolina: | 8.3% |


Marital status for residents in Lincolnton
Marital status - White (Caucasian) population 15 years and over
- Males
- 30.5%Never married
- 48.7%Now married
- 1.5%Separated
- 8.3%Widowed
- 10.9%Divorced
- Females
- 32.4%Never married
- 46.2%Now married
- 3.0%Separated
- 7.5%Widowed
- 10.9%Divorced
Women who gave birth in the past 12 months
| Now married: | 59.7% (74) |
| Unmarried: | 40.3% (50) |
Women who did not give birth in the past 12 months
| Now married: | 39.5% (596) |
| Unmarried: | 60.5% (912) |
Marital status - Black or African American population 15 years and over
- Males
- 52.3%Never married
- 40.3%Now married
- 1.8%Separated
- 3.2%Widowed
- 2.4%Divorced
- Females
- 58.7%Never married
- 18.6%Now married
- 3.7%Separated
- 4.5%Widowed
- 14.5%Divorced
Women who gave birth in the past 12 months
| Now married: | 16.8% (18) |
| Unmarried: | 83.2% (89) |
Women who did not give birth in the past 12 months
| Now married: | 17.2% (125) |
| Unmarried: | 82.8% (602) |
Marital status - Asian population 15 years and over
- Males
- 0.0%Never married
- 100.0%Now married
- 0.0%Separated
- 0.0%Widowed
- 0.0%Divorced
- Females
- 0.0%Never married
- 100.0%Now married
- 0.0%Separated
- 0.0%Widowed
- 0.0%Divorced
Marital status - Native Hawaiian / Pacific Islander population 15 years and over
- Males
- 100.0%Never married
- 0.0%Now married
- 0.0%Separated
- 0.0%Widowed
- 0.0%Divorced
- Females
- 0.0%Never married
- 0.0%Now married
- 0.0%Separated
- 0.0%Widowed
- 100.0%Divorced
Marital status - Other race population 15 years and over
- Males
- 8.8%Never married
- 80.4%Now married
- 0.0%Separated
- 0.0%Widowed
- 10.8%Divorced
- Females
- 35.5%Never married
- 56.2%Now married
- 0.0%Separated
- 0.0%Widowed
- 8.3%Divorced
Women who did not give birth in the past 12 months
| Now married: | 50.0% (59) |
| Unmarried: | 50.0% (59) |
Marital status - Two or more races population 15 years and over
- Males
- 43.7%Never married
- 49.5%Now married
- 0.0%Separated
- 0.0%Widowed
- 6.9%Divorced
- Females
- 16.7%Never married
- 73.7%Now married
- 0.0%Separated
- 0.0%Widowed
- 9.6%Divorced
Women who gave birth in the past 12 months
| Now married: | 0.0% (0) |
| Unmarried: | 100.0% (48) |
Women who did not give birth in the past 12 months
| Now married: | 94.5% (237) |
| Unmarried: | 5.5% (14) |
Marital status - White alone, not Hispanic / Latino population 15 years and over
- Males
- 28.4%Never married
- 49.1%Now married
- 1.6%Separated
- 9.0%Widowed
- 11.8%Divorced
- Females
- 32.4%Never married
- 45.6%Now married
- 3.3%Separated
- 8.1%Widowed
- 10.6%Divorced
Women who gave birth in the past 12 months
| Now married: | 59.7% (76) |
| Unmarried: | 40.3% (51) |
Women who did not give birth in the past 12 months
| Now married: | 36.7% (494) |
| Unmarried: | 63.3% (853) |
Marital status - Hispanic or Latino population 15 years and over
- Males
- 33.0%Never married
- 60.5%Now married
- 0.0%Separated
- 0.0%Widowed
- 6.5%Divorced
- Females
- 27.8%Never married
- 60.6%Now married
- 0.0%Separated
- 0.0%Widowed
- 11.5%Divorced
Women who gave birth in the past 12 months
| Now married: | 0.0% (0) |
| Unmarried: | 100.0% (38) |
Women who did not give birth in the past 12 months
| Now married: | 69.7% (346) |
| Unmarried: | 30.3% (150) |
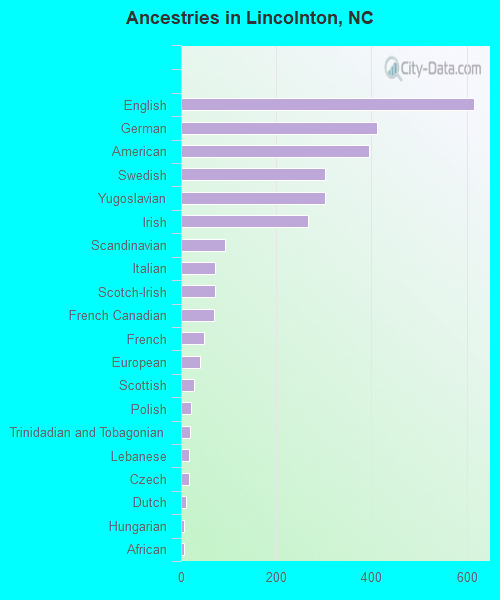
Ancestries in Lincolnton

- 6169.7%English
- 4116.5%German
- 3946.2%American
- 3034.8%Swedish
- 3034.8%Yugoslavian
- 2674.2%Irish
- 931.5%Scandinavian
- 711.1%Italian
- 711.1%Scotch-Irish
- 691.1%French Canadian
- 490.8%French
- 390.6%European
- 280.4%Scottish
- 200.3%Polish
- 180.3%Trinidadian and Tobagonian
- 170.3%Lebanese
- 170.3%Czech
- 100.2%Dutch
- 60.09%Hungarian
- 60.09%African
Geographical mobility in Lincolnton

- Same house 1 year ago
- 5,93982.3%White (Caucasian)
- 1,94186.0%Black or African American
- 41100.0%Asian
- 4694.8%Native Hawaiian / Pacific Islander
- 31691.4%Other race
- 1,14870.2%Two or more races
- 5,35281.0%White alone, not Hispanic / Latino
- 1,64278.6%Hispanic or Latino

-
- Moved within same county
- 5828.1%White / Caucasian
- 904.0%Black or African American
- 277.8%Other race
- 1418.6%Two or more races
- 5718.6%White alone, not Hispanic / Latino
- 1205.8%Hispanic or Latino

-
- Moved within same state
- 2463.4%White / Caucasian
- 1988.8%Black or African American
- 917.9%Native Hawaiian / Pacific Islander
- 2624.0%White alone, not Hispanic / Latino

-
- Moved from different state
- 4135.7%White / Caucasian
- 261.2%Black or African American
- 975.9%Two or more races
- 4717.1%White alone, not Hispanic / Latino
- 763.7%Hispanic or Latino

-
- Moved from abroad
- 450.6%White
- 19812.1%Two or more races
- 21310.2%Hispanic or Latino

Children Nativity (place of birth) in Lincolnton
Place of birth for residents in Lincolnton
![Place of birth for the foreign-born population - Regions]()
- 782Americas
- 782Latin America
- 710Central America
- 102Europe
- 68Eastern Europe
- 46Caribbean
- 33Southern Europe
- 29Oceania
- 25South America
- 19Asia
- 19South Eastern Asia

![Place of birth for the foreign-born population - Countries]()
- 382Costa Rica
- 328Mexico
- 68Bosnia and Herzegovina
- 33Spain
- 29Micronesia
- 27Cuba
- 19Vietnam
- 19Dominican Republic
- 13Venezuela
- 11Argentina

Grandparents responsible for own grandchildren in Lincolnton
Zip codes: 28092.