Races in Lincoln Park, New Jersey (NJ) Detailed Stats
Data:
Races - White alone (%)
Races - White alone (% change since 2000)
Races - Black alone (%)
Races - Black alone (% change since 2000)
Races - American Indian alone (%)
Races - American Indian alone (% change since 2000)
Races - Asian alone (%)
Races - Asian alone (% change since 2000)
Races - Hispanic (%)
Races - Hispanic (% change since 2000)
Races - Native Hawaiian and Other Pacific Islander alone (%)
Races - Native Hawaiian and Other Pacific Islander alone (% change since 2000)
Races - Two or more races(%)
Races - Two or more races(% change since 2000)
Races - Other race alone (%)
Races - Other race alone (% change since 2000)
Racial diversity
Place of birth - Born in state of residence (%)
Place of birth - Born in state of residence (%) - White
Place of birth - Born in state of residence (%) - Black or African American
Place of birth - Born in state of residence (%) - Asian
Place of birth - Born in state of residence (%) - Hispanic or Latino
Place of birth - Born in state of residence (%) - American Indian and Alaska Native
Place of birth - Born in state of residence (%) - Multirace
Place of birth - Born in state of residence (%) - Other Race
Place of birth - Born in other state (%)
Place of birth - Born in other state (%) - White
Place of birth - Born in other state (%) - Black or African American
Place of birth - Born in other state (%) - Asian
Place of birth - Born in other state (%) - Hispanic or Latino
Place of birth - Born in other state (%) - American Indian and Alaska Native
Place of birth - Born in other state (%) - Multirace
Place of birth - Born in other state (%) - Other Race
Place of birth - Native, outside of US (%)
Place of birth - Native, outside of US (%) - White
Place of birth - Native, outside of US (%) - Black or African American
Place of birth - Native, outside of US (%) - Asian
Place of birth - Native, outside of US (%) - Hispanic or Latino
Place of birth - Native, outside of US (%) - American Indian and Alaska Native
Place of birth - Native, outside of US (%) - Multirace
Place of birth - Native, outside of US (%) - Other Race
Place of birth - Foreign born (%)
Place of birth - Foreign born (%) - White
Place of birth - Foreign born (%) - Black or African American
Place of birth - Foreign born (%) - Asian
Place of birth - Foreign born (%) - Hispanic or Latino
Place of birth - Foreign born (%) - American Indian and Alaska Native
Place of birth - Foreign born (%) - Multirace
Place of birth - Foreign born (%) - Other Race
Residents speaking English at home (%)
Residents speaking English at home - Born in the United States (%)
Residents speaking English at home - Native, born elsewhere (%)
Residents speaking English at home - Foreign born (%)
Residents speaking Spanish at home (%)
Residents speaking Spanish at home - Born in the United States (%)
Residents speaking Spanish at home - Native, born elsewhere (%)
Residents speaking Spanish at home - Foreign born (%)
Residents speaking other language at home (%)
Residents speaking other language at home - Born in the United States (%)
Residents speaking other language at home - Native, born elsewhere (%)
Residents speaking other language at home - Foreign born (%)
Marital status - Never married (%)
Marital status - Now married (%)
Marital status - Separated (%)
Marital status - Widowed (%)
Marital status - Divorced (%)
Ancestries Reported - Arab (%)
Ancestries Reported - Czech (%)
Ancestries Reported - Danish (%)
Ancestries Reported - Dutch (%)
Ancestries Reported - English (%)
Ancestries Reported - French (%)
Ancestries Reported - French Canadian (%)
Ancestries Reported - German (%)
Ancestries Reported - Greek (%)
Ancestries Reported - Hungarian (%)
Ancestries Reported - Irish (%)
Ancestries Reported - Italian (%)
Ancestries Reported - Lithuanian (%)
Ancestries Reported - Norwegian (%)
Ancestries Reported - Polish (%)
Ancestries Reported - Portuguese (%)
Ancestries Reported - Russian (%)
Ancestries Reported - Scotch-Irish (%)
Ancestries Reported - Scottish (%)
Ancestries Reported - Slovak (%)
Ancestries Reported - Subsaharan African (%)
Ancestries Reported - Swedish (%)
Ancestries Reported - Swiss (%)
Ancestries Reported - Ukrainian (%)
Ancestries Reported - United States (%)
Ancestries Reported - Welsh (%)
Ancestries Reported - West Indian (%)
Ancestries Reported - Other (%)
Geographical mobility - Same house 1 year ago (%)
Geographical mobility - Same house 1 year ago (%) - White
Geographical mobility - Same house 1 year ago (%) - Black or African American
Geographical mobility - Same house 1 year ago (%) - Asian
Geographical mobility - Same house 1 year ago (%) - Hispanic or Latino
Geographical mobility - Same house 1 year ago (%) - American Indian and Alaska Native
Geographical mobility - Same house 1 year ago (%) - Multirace
Geographical mobility - Same house 1 year ago (%) - Other Race
Geographical mobility - Moved within same county (%)
Geographical mobility - Moved within same county (%) - White
Geographical mobility - Moved within same county (%) - Black or African American
Geographical mobility - Moved within same county (%) - Asian
Geographical mobility - Moved within same county (%) - Hispanic or Latino
Geographical mobility - Moved within same county (%) - American Indian and Alaska Native
Geographical mobility - Moved within same county (%) - Multirace
Geographical mobility - Moved within same county (%) - Other Race
Geographical mobility - Moved from different county within same state (%)
Geographical mobility - Moved from different county within same state (%) - White
Geographical mobility - Moved from different county within same state (%) - Black or African American
Geographical mobility - Moved from different county within same state (%) - Asian
Geographical mobility - Moved from different county within same state (%) - Hispanic or Latino
Geographical mobility - Moved from different county within same state (%) - American Indian and Alaska Native
Geographical mobility - Moved from different county within same state (%) - Multirace
Geographical mobility - Moved from different county within same state (%) - Other Race
Geographical mobility - Moved from different state (%)
Geographical mobility - Moved from different state (%) - White
Geographical mobility - Moved from different state (%) - Black or African American
Geographical mobility - Moved from different state (%) - Asian
Geographical mobility - Moved from different state (%) - Hispanic or Latino
Geographical mobility - Moved from different state (%) - American Indian and Alaska Native
Geographical mobility - Moved from different state (%) - Multirace
Geographical mobility - Moved from different state (%) - Other Race
Geographical mobility - Moved from abroad (%)
Geographical mobility - Moved from abroad (%) - White
Geographical mobility - Moved from abroad (%) - Black or African American
Geographical mobility - Moved from abroad (%) - Asian
Geographical mobility - Moved from abroad (%) - Hispanic or Latino
Geographical mobility - Moved from abroad (%) - American Indian and Alaska Native
Geographical mobility - Moved from abroad (%) - Multirace
Geographical mobility - Moved from abroad (%) - Other Race
Place of birth for the foreign-born population - Ireland (%)
Place of birth for the foreign-born population - Denmark (%)
Place of birth for the foreign-born population - Norway (%)
Place of birth for the foreign-born population - Sweden (%)
Place of birth for the foreign-born population - United Kingdom (%)
Place of birth for the foreign-born population - England (%)
Place of birth for the foreign-born population - Scotland (%)
Place of birth for the foreign-born population - Other Northern Europe (%)
Place of birth for the foreign-born population - Austria (%)
Place of birth for the foreign-born population - Belgium (%)
Place of birth for the foreign-born population - France (%)
Place of birth for the foreign-born population - Germany (%)
Place of birth for the foreign-born population - Netherlands (%)
Place of birth for the foreign-born population - Switzerland (%)
Place of birth for the foreign-born population - Other Western Europe (%)
Place of birth for the foreign-born population - Greece (%)
Place of birth for the foreign-born population - Italy (%)
Place of birth for the foreign-born population - Portugal (%)
Place of birth for the foreign-born population - Spain (%)
Place of birth for the foreign-born population - Other Southern Europe (%)
Place of birth for the foreign-born population - Albania (%)
Place of birth for the foreign-born population - Belarus (%)
Place of birth for the foreign-born population - Bosnia and Herzegovina (%)
Place of birth for the foreign-born population - Bulgaria (%)
Place of birth for the foreign-born population - Croatia (%)
Place of birth for the foreign-born population - Czechoslovakia (%)
Place of birth for the foreign-born population - Hungary (%)
Place of birth for the foreign-born population - Latvia (%)
Place of birth for the foreign-born population - Lithuania (%)
Place of birth for the foreign-born population - North Macedonia (Macedonia) (%)
Place of birth for the foreign-born population - Moldova (%)
Place of birth for the foreign-born population - Poland (%)
Place of birth for the foreign-born population - Romania (%)
Place of birth for the foreign-born population - Russia (%)
Place of birth for the foreign-born population - Serbia (%)
Place of birth for the foreign-born population - Ukraine (%)
Place of birth for the foreign-born population - Other Eastern Europe (%)
Place of birth for the foreign-born population - China (%)
Place of birth for the foreign-born population - Hong Kong (%)
Place of birth for the foreign-born population - Taiwan (%)
Place of birth for the foreign-born population - Japan (%)
Place of birth for the foreign-born population - Korea (%)
Place of birth for the foreign-born population - Other Eastern Asia (%)
Place of birth for the foreign-born population - Afghanistan (%)
Place of birth for the foreign-born population - Bangladesh (%)
Place of birth for the foreign-born population - India (%)
Place of birth for the foreign-born population - Iran (%)
Place of birth for the foreign-born population - Kazakhstan (%)
Place of birth for the foreign-born population - Nepal (%)
Place of birth for the foreign-born population - Pakistan (%)
Place of birth for the foreign-born population - Sri Lanka (%)
Place of birth for the foreign-born population - Uzbekistan (%)
Place of birth for the foreign-born population - Other South Central Asia (%)
Place of birth for the foreign-born population - Burma (%)
Place of birth for the foreign-born population - Cambodia (%)
Place of birth for the foreign-born population - Indonesia (%)
Place of birth for the foreign-born population - Laos (%)
Place of birth for the foreign-born population - Malaysia (%)
Place of birth for the foreign-born population - Philippines (%)
Place of birth for the foreign-born population - Singapore (%)
Place of birth for the foreign-born population - Thailand (%)
Place of birth for the foreign-born population - Vietnam (%)
Place of birth for the foreign-born population - Other South Eastern Asia (%)
Place of birth for the foreign-born population - Armenia (%)
Place of birth for the foreign-born population - Iraq (%)
Place of birth for the foreign-born population - Israel (%)
Place of birth for the foreign-born population - Jordan (%)
Place of birth for the foreign-born population - Kuwait (%)
Place of birth for the foreign-born population - Lebanon (%)
Place of birth for the foreign-born population - Saudi Arabia (%)
Place of birth for the foreign-born population - Syria (%)
Place of birth for the foreign-born population - Turkey (%)
Place of birth for the foreign-born population - Yemen (%)
Place of birth for the foreign-born population - Other Western Asia (%)
Place of birth for the foreign-born population - Eritrea (%)
Place of birth for the foreign-born population - Ethiopia (%)
Place of birth for the foreign-born population - Kenya (%)
Place of birth for the foreign-born population - Somalia (%)
Place of birth for the foreign-born population - Uganda (%)
Place of birth for the foreign-born population - Zimbabwe (%)
Place of birth for the foreign-born population - Other Eastern Africa (%)
Place of birth for the foreign-born population - Cameroon (%)
Place of birth for the foreign-born population - Congo (%)
Place of birth for the foreign-born population - Democratic Republic of Congo (Zaire) (%)
Place of birth for the foreign-born population - Other Middle Africa (%)
Place of birth for the foreign-born population - Egypt (%)
Place of birth for the foreign-born population - Morocco (%)
Place of birth for the foreign-born population - Sudan (%)
Place of birth for the foreign-born population - Other Northern Africa (%)
Place of birth for the foreign-born population - South Africa (%)
Place of birth for the foreign-born population - Other Southern Africa (%)
Place of birth for the foreign-born population - Cabo Verde (%)
Place of birth for the foreign-born population - Ghana (%)
Place of birth for the foreign-born population - Liberia (%)
Place of birth for the foreign-born population - Nigeria (%)
Place of birth for the foreign-born population - Senegal (%)
Place of birth for the foreign-born population - Sierra Leone (%)
Place of birth for the foreign-born population - Other Western Africa (%)
Place of birth for the foreign-born population - Australia (%)
Place of birth for the foreign-born population - New Zealand (%)
Place of birth for the foreign-born population - Fiji (%)
Place of birth for the foreign-born population - Micronesia (%)
Place of birth for the foreign-born population - Bahamas (%)
Place of birth for the foreign-born population - Barbados (%)
Place of birth for the foreign-born population - Cuba (%)
Place of birth for the foreign-born population - Dominica (%)
Place of birth for the foreign-born population - Dominican Republic (%)
Place of birth for the foreign-born population - Grenada (%)
Place of birth for the foreign-born population - Haiti (%)
Place of birth for the foreign-born population - Jamaica (%)
Place of birth for the foreign-born population - St. Vincent and the Grenadines (%)
Place of birth for the foreign-born population - Trinidad and Tobago (%)
Place of birth for the foreign-born population - West Indies (%)
Place of birth for the foreign-born population - Other Caribbean (%)
Place of birth for the foreign-born population - Belize (%)
Place of birth for the foreign-born population - Costa Rica (%)
Place of birth for the foreign-born population - El Salvador (%)
Place of birth for the foreign-born population - Guatemala (%)
Place of birth for the foreign-born population - Honduras (%)
Place of birth for the foreign-born population - Mexico (%)
Place of birth for the foreign-born population - Nicaragua (%)
Place of birth for the foreign-born population - Panama (%)
Place of birth for the foreign-born population - Other Central America (%)
Place of birth for the foreign-born population - Argentina (%)
Place of birth for the foreign-born population - Bolivia (%)
Place of birth for the foreign-born population - Brazil (%)
Place of birth for the foreign-born population - Chile (%)
Place of birth for the foreign-born population - Colombia (%)
Place of birth for the foreign-born population - Ecuador (%)
Place of birth for the foreign-born population - Guyana (%)
Place of birth for the foreign-born population - Peru (%)
Place of birth for the foreign-born population - Uruguay (%)
Place of birth for the foreign-born population - Venezuela (%)
Place of birth for the foreign-born population - Other South America (%)
Place of birth for the foreign-born population - Canada (%)
Place of birth for the foreign-born population - Other Northern America (%)
Place of birth for the foreign-born population - Other (%)
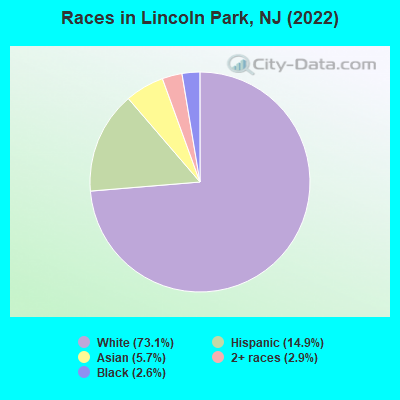
According to 2022 data, the most numerous races in Lincoln Park, NJ are White alone (7,993 residents), Hispanic (1,634 residents), and Black alone (289 residents). 73.4% of Lincoln Park residents speak English at home. 17.6% of Lincoln Park, NJ residents are foreign-born (8.6% born in Europe, 4.4% born in Latin America, 3.6% born in Asia), which is 30.8% less than the foreign-born rate of 23.0% across the entire state of New Jersey.
Race distribution in Lincoln Park
2000 2022
5,557,209 66.0% White alone 1,117,191 13.3% Hispanic 1,096,171 13.0% Black alone 477,012 5.7% Asian alone 133,689 1.6% Two or more races 19,565 0.2% Other race alone 11,338 0.1% American Indian alone 2,175 0.03% Native Hawaiian and Other
4,766,476 51.5% White alone 2,028,470 21.9% Hispanic 1,111,632 12.0% Black alone 923,546 10.0% Asian alone 332,237 3.6% Two or more races 89,847 1.0% Other race alone 8,557 0.09% American Indian alone 934 0.01% Native Hawaiian and Other
Income and house value in Lincoln Park Median household income in 2022 $109,646 White non-Hispanic householdersover $200,000 Black householders$152,649 Asian householders$101,464 Hispanic or Latino race householdersMedian 2022 house value $435,396 White Non-Hispanic householders$615,915 Black or African American householders$419,942 American Indian or Alaska Native householders $460,704 Asian householders$456,449 Some other race householders$251,965 Two or more races householders$438,531 Hispanic or Latino householders
Median age by race in Lincoln Park
50.9 Median age for White residents49.1 53.4 41.9 Median age for Black or African American residents44.9 37.7 -847,710,329.3 Median age for American Indian / Alaska Native residents-707,246,376.1 -671,264,367.1 38.4 Median age for Asian residents38.2 50.1 -804,177,544.9 Median age for Native Hawaiian / Pacific Islander residents-666,666,666.0 -713,070,378.3 34.1 Median age for Other race residents38.1 52.7 36.8 Median age for Two or more races residents37.8 36.4 50.6 Median age for White alone residents48.9 53.4 34.7 Median age for Hispanic or Latino residents34.9 34.2
Owner/renter occupied households by race in Lincoln Park
House owners and renters - White residents 2,490 76.7% Owner occupied757 23.3% Renter occupiedHouse owners and renters - Black or African American residents 59 63.3% Owner occupied34 36.7% Renter occupiedHouse owners and renters - Asian residents 217 96.5% Owner occupied8 3.5% Renter occupiedHouse owners and renters - Other race residents 78 79.3% Owner occupied20 20.7% Renter occupiedHouse owners and renters - Two or more races residents 588 92.8% Owner occupied45 7.2% Renter occupiedHouse owners and renters - White alone residents 2,537 76.5% Owner occupied779 23.5% Renter occupiedHouse owners and renters - Hispanic or Latino residents 429 83.9% Owner occupied82 16.1% Renter occupied
Language usage in Lincoln Park
English speakers - Total 73.4% of residents of Lincoln Park speak English at home.
9.9% of residents speak Spanish at home 669 65.3% Speak English very well355 34.7% Speak English less than very well16.6% of residents speak other language at home 1,112 64.5% Speak English very well612 35.5% Speak English less than very well
English speakers - Born in the United States 83.3% of residents of Lincoln Park speak English at home.
13.9% of residents speak Spanish at home 259 100.0% Speak English very well4.6% of residents speak other language at home 51 60.0% Speak English very well34 40.0% Speak English less than very well
English speakers - Native, born elsewhere 21.0% of residents of Lincoln Park speak English at home.
55.2% of residents speak Spanish at home 64 81.0% Speak English very well15 19.0% Speak English less than very well18.2% of residents speak other language at home 15 57.7% Speak English very well11 42.3% Speak English less than very well
English speakers - Foreign-born 11.4% of residents of Lincoln Park speak English at home.
23.4% of residents speak Spanish at home 168 38.6% Speak English very well267 61.4% Speak English less than very well64.9% of residents speak other language at home 649 53.8% Speak English very well558 46.2% Speak English less than very well
White (Caucasian) - Speak only English Native:
93.7% (6,337)Foreign-born:
20.8% (157)
White (Caucasian) - Speak another language Native:
6.0% (408)Foreign-born:
76.3% (577)
Black or African American - Speak only English Native:
91.5% (267)Foreign-born:
57.4% (19)
Black or African American - Speak another language Native:
8.4% (25)Foreign-born:
43.0% (14)
Asian - Speak another language Native:
60.6% (138)Foreign-born:
100.0% (343)
Other race - Speak another language Native:
100.0% (136)Foreign-born:
99.6% (64)
Two or more races - Speak only English Native:
63.0% (706)Foreign-born:
5.8% (32)
Two or more races - Speak another language Native:
37.5% (421)Foreign-born:
93.0% (519)
White alone - Speak only English Native:
93.8% (6,323)Foreign-born:
15.6% (158)
White alone - Speak another language Native:
6.2% (420)Foreign-born:
86.6% (878)
Hispanic or Latino - Speak only English Native:
46.5% (472)Foreign-born:
7.2% (33)
Hispanic or Latino - Speak another language Native:
53.2% (540)Foreign-born:
92.2% (430)
Foreign-born residents in Lincoln Park 1,923 residents are foreign born (8.6% Europe , 4.4% Latin America , 3.6% Asia ).
This city:
17.6%New Jersey:
23.2%
Marital status for residents in Lincoln Park Marital status - White (Caucasian) population 15 years and over
Males 38.3% Never married47.0% Now married0.6% Separated1.3% Widowed12.7% DivorcedFemales 27.4% Never married44.1% Now married0.4% Separated10.2% Widowed17.8% DivorcedWomen who gave birth in the past 12 months Now married:
100.0% (44)Unmarried:
0.0% (0)
Women who did not give birth in the past 12 months Now married:
35.5% (542)Unmarried:
64.5% (985)
Marital status - Black or African American population 15 years and over
Males 43.9% Never married36.8% Now married0.0% Separated0.0% Widowed19.4% DivorcedFemales 24.4% Never married66.9% Now married0.0% Separated0.0% Widowed8.7% DivorcedWomen who did not give birth in the past 12 months Now married:
81.6% (68)Unmarried:
18.4% (15)
Marital status - Asian population 15 years and over
Males 23.6% Never married65.8% Now married10.6% Separated0.0% Widowed0.0% DivorcedFemales 22.0% Never married56.7% Now married4.1% Separated17.2% Widowed0.0% DivorcedWomen who did not give birth in the past 12 months Now married:
63.7% (77)Unmarried:
36.3% (44)
Marital status - Other race population 15 years and over
Males 0.0% Never married89.7% Now married0.0% Separated10.3% Widowed0.0% DivorcedFemales 12.7% Never married60.3% Now married0.0% Separated27.0% Widowed0.0% DivorcedWomen who did not give birth in the past 12 months Now married:
0.0% (0)Unmarried:
100.0% (11)
Marital status - Two or more races population 15 years and over
Males 34.2% Never married58.3% Now married0.8% Separated0.0% Widowed6.7% DivorcedFemales 38.6% Never married44.8% Now married0.0% Separated9.9% Widowed6.7% DivorcedWomen who gave birth in the past 12 months Now married:
100.0% (32)Unmarried:
0.0% (0)
Women who did not give birth in the past 12 months Now married:
44.4% (196)Unmarried:
55.6% (246)
Marital status - White alone, not Hispanic / Latino population 15 years and over
Males 38.4% Never married47.1% Now married0.4% Separated1.3% Widowed12.8% DivorcedFemales 26.7% Never married45.4% Now married0.5% Separated10.8% Widowed16.7% DivorcedWomen who gave birth in the past 12 months Now married:
100.0% (47)Unmarried:
0.0% (0)
Women who did not give birth in the past 12 months Now married:
37.8% (568)Unmarried:
62.2% (936)
Marital status - Hispanic or Latino population 15 years and over
Males 31.8% Never married62.9% Now married2.0% Separated1.1% Widowed2.3% DivorcedFemales 30.0% Never married47.8% Now married0.0% Separated10.2% Widowed12.0% DivorcedWomen who gave birth in the past 12 months Now married:
100.0% (24)Unmarried:
0.0% (0)
Women who did not give birth in the past 12 months Now married:
40.4% (163)Unmarried:
59.6% (242)
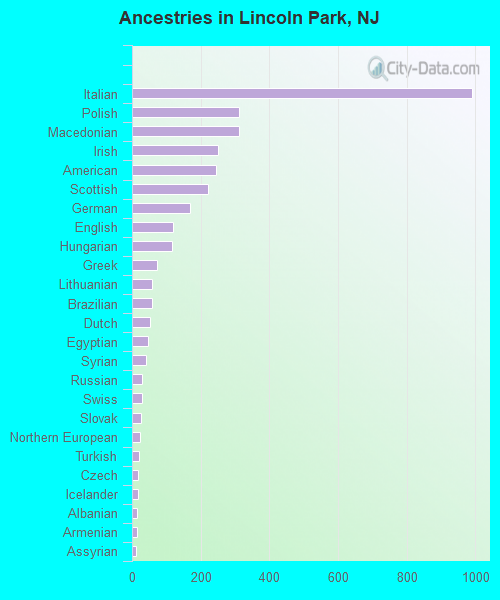
Ancestries in Lincoln Park
990 20.2% Italian313 6.4% Polish312 6.4% Macedonian250 5.1% Irish245 5.0% American222 4.5% Scottish170 3.5% German119 2.4% English116 2.4% Hungarian73 1.5% Greek59 1.2% Lithuanian58 1.2% Brazilian53 1.1% Dutch46 0.9% Egyptian42 0.9% Syrian28 0.6% Russian28 0.6% Swiss27 0.6% Slovak23 0.5% Northern European19 0.4% Turkish18 0.4% Czech18 0.4% Icelander15 0.3% Albanian14 0.3% Armenian12 0.2% Assyrian12 0.2% British12 0.2% Scotch-Irish10 0.2% Eastern European7 0.1% Welsh4 0.08% Ukrainian2 0.04% Maltese2 0.04% Jamaican
Children Nativity (place of birth) in Lincoln Park
Children under 6 years - Living with two parents Both parents native 261 100.0% NativeBoth parents foreign-born 108 100.0% NativeOne native, one foreign-born parent 108 100.0% NativeChildren under 6 years - Living with one parent Native parent 124 100.0% NativeChildren 6 to 17 years - Living with two parents Both parents native 613 98.5% Native9 1.5% Foreign-bornBoth parents foreign-born 90 100.0% NativeOne native, one foreign-born parent 83 87.6% Native12 12.4% Foreign-bornChildren 6 to 17 years - Living with one parent Native parent 100 100.0% NativeForeign-born parent 64 56.1% Native50 43.9% Foreign-born
Grandparents responsible for own grandchildren in Lincoln Park
Grandparents (30 to 59 years) White / Caucasian 25 74.4% Responsible for grandchildren9 25.6% Not responsible for grandchildrenBlack or African American 13 100.0% Not responsible for grandchildrenTwo or more races 5 100.0% Not responsible for grandchildrenWhite alone, not Hispanic / Latino 25 72.1% Responsible for grandchildren10 27.9% Not responsible for grandchildrenHispanic or Latino 15 100.0% Not responsible for grandchildrenGrandparents (60 years and over) White / Caucasian 26 33.7% Responsible for grandchildren52 66.3% Not responsible for grandchildrenBlack or African American 14 100.0% Not responsible for grandchildrenTwo or more races 11 13.6% Responsible for grandchildren69 86.4% Not responsible for grandchildrenWhite alone, not Hispanic / Latino 30 34.4% Responsible for grandchildren58 65.6% Not responsible for grandchildrenHispanic or Latino 5 7.2% Responsible for grandchildren64 92.8% Not responsible for grandchildren