Races in Lewiston, Idaho (ID) Detailed Stats
Ancestries, Foreign-born residents, place of birth
Settings
X


Recent posts about races in Lewiston, Idaho on our local forum with over 2,400,000 registered users:
 | House on an acreage near Lewiston (32 replies) |
| Boise or Lewiston? (29 replies) |
| The North Idaho Front Porch (4305 replies) |
| Lewiston Idaho is better than you think (22 replies) |
| Nov 2022 Moscow UofI student stabbings (229 replies) |
| Lewiston - talk to me about the smell (24 replies) |
Latest news about races in Lewiston, ID collected exclusively by city-data.com from local newspapers, TV, and radio stations
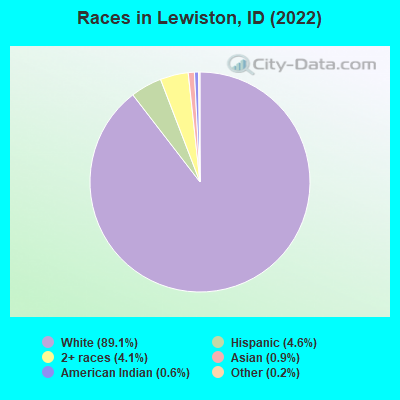
According to 2022 data, the most numerous races in Lewiston, ID are White alone (31,929 residents), Hispanic (1,656 residents), and Two or more races (1,465 residents). 96.5% of Lewiston residents speak English at home. 2.6% of Lewiston, ID residents are foreign-born (1.0% born in Asia, 0.6% born in North America, 0.6% born in Latin America, 0.4% born in Europe), which is 93.5% less than the foreign-born rate of 5.0% across the entire state of Idaho.
Race distribution in Lewiston
2000
2022

- 29,06994.1%White alone
- 5901.9%Hispanic
- 4681.5%American Indian alone
- 4201.4%Two or more races
- 2350.8%Asian alone
- 890.3%Black alone
- 230.07%Native Hawaiian and Other
Pacific Islander alone - 100.03%Other race alone

-
- 31,92989.1%White alone
- 1,6564.6%Hispanic
- 1,4654.1%Two or more races
- 3210.9%Asian alone
- 2070.6%American Indian alone
- 670.2%Other race alone
- 260.07%Black alone
2000
2022
-
- 1,139,29188.0%White alone
- 101,6907.9%Hispanic
- 18,2611.4%Two or more races
- 15,7891.2%American Indian alone
- 11,6410.9%Asian alone
- 4,8890.4%Black alone
- 1,1920.09%Other race alone
- 1,2000.09%Native Hawaiian and Other
Pacific Islander alone

-
- 1,531,21979.0%White alone
- 261,92113.5%Hispanic
- 81,1124.2%Two or more races
- 25,1741.3%Asian alone
- 15,8250.8%American Indian alone
- 11,8680.6%Black alone
- 8,7520.5%Other race alone
- 3,1620.2%Native Hawaiian and Other
Pacific Islander alone

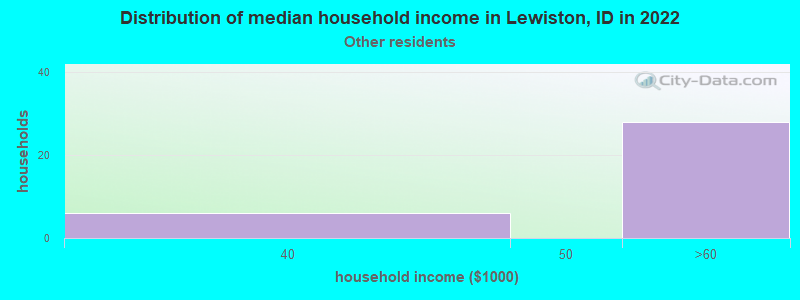
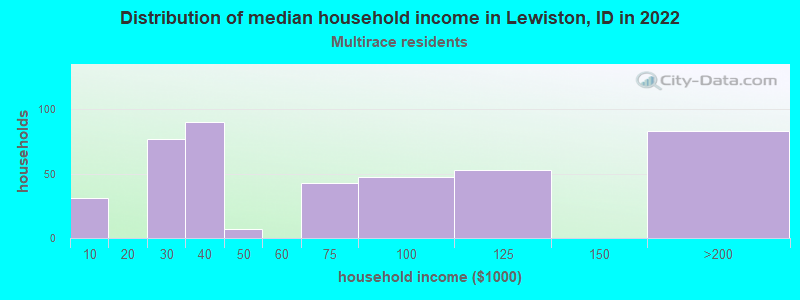
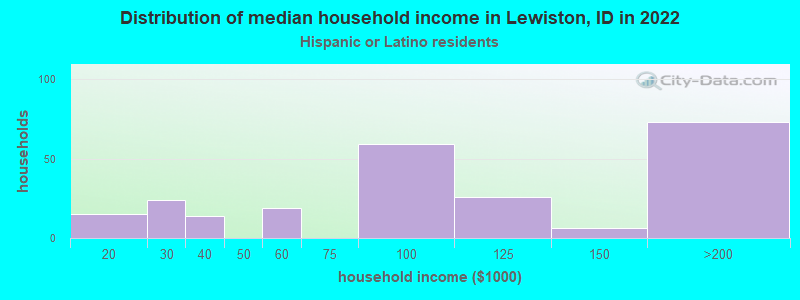
Income and house value in Lewiston
- Median household income in 2022
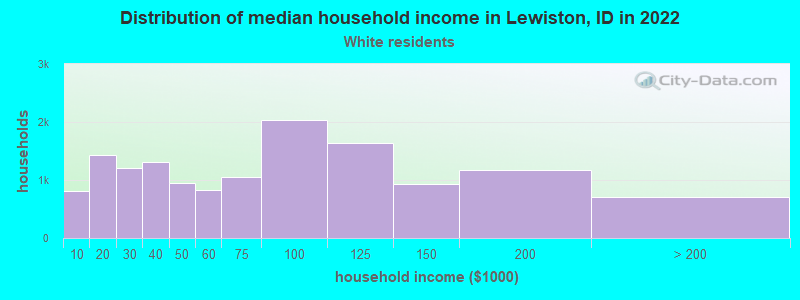
- $66,242White non-Hispanic householders
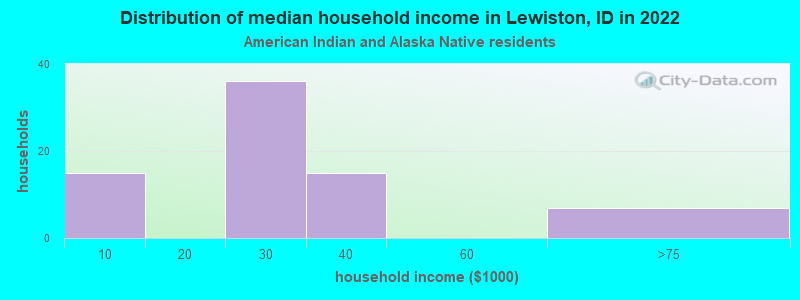
- $32,176American Indian and Alaska Native householders
- $72,096Two or more races householders
- $94,580Hispanic or Latino race householders
- Median 2022 house value
- $350,027White Non-Hispanic householders
- $213,631Black or African American householders
- $276,077American Indian or Alaska Native householders
- $302,370Asian householders
- $312,230Some other race householders
- $319,132Two or more races householders
- $298,426Hispanic or Latino householders
Household income for White non-Hispanic householders
Household income for American Indian and Alaska Native householders
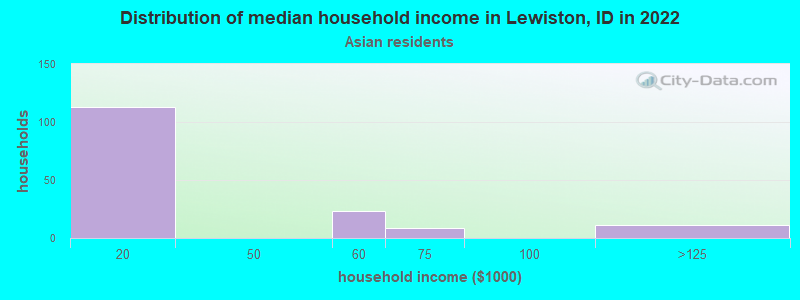
Household income for Asian householders
Household income for Some other race householders
Household income for Two or more races householders
Household income for Hispanic or Latino race householders
Median age by race in Lewiston
- 41.9Median age for White residents
- 39.7Males
- 43.1Females
- 21.8Median age for Black or African American residents
- 19.0Males
- -869,696,968.8Females
- 38.9Median age for American Indian / Alaska Native residents
- 29.8Males
- 35.8Females
- 53.6Median age for Asian residents
- 49.8Males
- 50.5Females
- -393,939,393.5Median age for Native Hawaiian / Pacific Islander residents
- -355,119,825.4Males
- -679,245,282.3Females
- 41.9Median age for Other race residents
- 40.3Males
- 44.1Females
- 19.0Median age for Two or more races residents
- 23.7Males
- 15.7Females
- 42.0Median age for White alone residents
- 39.8Males
- 43.2Females
- 28.3Median age for Hispanic or Latino residents
- 36.0Males
- 21.2Females
Owner/renter occupied households by race in Lewiston
- House owners and renters - White residents
- 9,89570.0%Owner occupied
- 4,23430.0%Renter occupied
- House owners and renters - Black or African American residents
- 9100.0%Renter occupied
- House owners and renters - American Indian / Alaska Native residents
- 8187.6%Owner occupied
- 1112.4%Renter occupied
- House owners and renters - Asian residents
- 9365.9%Owner occupied
- 4834.1%Renter occupied
- House owners and renters - Other race residents
- 1337.4%Owner occupied
- 2262.6%Renter occupied
- House owners and renters - Two or more races residents
- 34883.0%Owner occupied
- 7217.0%Renter occupied
- House owners and renters - White alone residents
- 10,00870.3%Owner occupied
- 4,23229.7%Renter occupied
- House owners and renters - Hispanic or Latino residents
- 10347.2%Owner occupied
- 11552.8%Renter occupied
Language usage in Lewiston
- English speakers - Total
- 96.5% of residents of Lewiston speak English at home.
- 1.1% of residents speak Spanish at home
- 23764.1%Speak English very well
- 13335.9%Speak English less than very well
- 2.4% of residents speak other language at home
- 32239.1%Speak English very well
- 50260.9%Speak English less than very well
- English speakers - Born in the United States
- 98.0% of residents of Lewiston speak English at home.
- 0.8% of residents speak Spanish at home
- 8964.5%Speak English very well
- 4935.5%Speak English less than very well
- 0.8% of residents speak other language at home
- 10275.6%Speak English very well
- 3324.4%Speak English less than very well
- English speakers - Native, born elsewhere
- 91.6% of residents of Lewiston speak English at home.
- 7.5% of residents speak Spanish at home
- 741.2%Speak English very well
- 1058.8%Speak English less than very well
- English speakers - Foreign-born
- 35.5% of residents of Lewiston speak English at home.
- 17.6% of residents speak Spanish at home
- 9353.4%Speak English very well
- 8146.6%Speak English less than very well
- 52.4% of residents speak other language at home
- 12223.6%Speak English very well
- 39676.4%Speak English less than very well
White (Caucasian) - Speak only English
| Native: | 99.7% (30,057) |
| Foreign-born: | 59.3% (266) |
White (Caucasian) - Speak another language
| Native: | 0.8% (234) |
| Foreign-born: | 38.9% (175) |
Asian - Speak another language
| Native: | 82.1% (29) |
| Foreign-born: | 89.1% (275) |
Other race - Speak another language
| Native: | 15.3% (34) |
| Foreign-born: | 99.1% (60) |
Two or more races - Speak another language
| Native: | 6.3% (126) |
| Foreign-born: | 97.2% (66) |
White alone - Speak only English
| Native: | 99.4% (29,743) |
| Foreign-born: | 52.3% (254) |
White alone - Speak another language
| Native: | 0.6% (182) |
| Foreign-born: | 39.4% (192) |
Hispanic or Latino - Speak only English
| Native: | 85.7% (1,117) |
| Foreign-born: | 20.8% (46) |
Hispanic or Latino - Speak another language
| Native: | 15.1% (197) |
| Foreign-born: | 80.7% (177) |
Foreign-born residents in Lewiston
926 residents are foreign born (1.0% Asia, 0.6% North America, 0.6% Latin America, 0.4% Europe).
| This city: | 2.6% |
| Idaho: | 5.7% |


Marital status for residents in Lewiston
Marital status - White (Caucasian) population 15 years and over
- Males
- 30.9%Never married
- 50.5%Now married
- 1.2%Separated
- 2.7%Widowed
- 14.6%Divorced
- Females
- 24.3%Never married
- 46.5%Now married
- 0.8%Separated
- 13.6%Widowed
- 14.9%Divorced
Women who gave birth in the past 12 months
| Now married: | 64.2% (261) |
| Unmarried: | 35.8% (146) |
Women who did not give birth in the past 12 months
| Now married: | 45.3% (3,048) |
| Unmarried: | 54.7% (3,687) |
Marital status - Black or African American population 15 years and over
- Males
- 77.8%Never married
- 0.0%Now married
- 0.0%Separated
- 0.0%Widowed
- 22.2%Divorced
- Females
- 100.0%Never married
- 0.0%Now married
- 0.0%Separated
- 0.0%Widowed
- 0.0%Divorced
Marital status - American Indian / Alaska Native population 15 years and over
- Males
- 59.1%Never married
- 35.7%Now married
- 0.0%Separated
- 0.0%Widowed
- 5.2%Divorced
- Females
- 11.9%Never married
- 0.0%Now married
- 0.0%Separated
- 9.9%Widowed
- 78.2%Divorced
Women who did not give birth in the past 12 months
| Now married: | 0.0% (0) |
| Unmarried: | 100.0% (73) |
Marital status - Asian population 15 years and over
- Males
- 64.5%Never married
- 35.5%Now married
- 0.0%Separated
- 0.0%Widowed
- 0.0%Divorced
- Females
- 15.5%Never married
- 54.3%Now married
- 0.0%Separated
- 30.1%Widowed
- 0.0%Divorced
Women who gave birth in the past 12 months
| Now married: | 100.0% (10) |
| Unmarried: | 0.0% (0) |
Women who did not give birth in the past 12 months
| Now married: | 53.1% (45) |
| Unmarried: | 46.9% (40) |
Marital status - Other race population 15 years and over
- Males
- 33.0%Never married
- 50.5%Now married
- 0.0%Separated
- 16.5%Widowed
- 0.0%Divorced
- Females
- 24.8%Never married
- 60.0%Now married
- 0.0%Separated
- 0.0%Widowed
- 15.2%Divorced
Women who did not give birth in the past 12 months
| Now married: | 62.5% (65) |
| Unmarried: | 37.5% (39) |
Marital status - Two or more races population 15 years and over
- Males
- 59.0%Never married
- 33.2%Now married
- 0.0%Separated
- 0.0%Widowed
- 7.8%Divorced
- Females
- 34.3%Never married
- 39.9%Now married
- 0.0%Separated
- 13.2%Widowed
- 12.6%Divorced
Women who did not give birth in the past 12 months
| Now married: | 30.0% (121) |
| Unmarried: | 70.0% (283) |
Marital status - White alone, not Hispanic / Latino population 15 years and over
- Males
- 29.8%Never married
- 51.6%Now married
- 1.3%Separated
- 2.8%Widowed
- 14.5%Divorced
- Females
- 24.1%Never married
- 46.9%Now married
- 0.8%Separated
- 13.7%Widowed
- 14.5%Divorced
Women who gave birth in the past 12 months
| Now married: | 64.2% (267) |
| Unmarried: | 35.8% (149) |
Women who did not give birth in the past 12 months
| Now married: | 46.1% (3,064) |
| Unmarried: | 53.9% (3,577) |
Marital status - Hispanic or Latino population 15 years and over
- Males
- 59.8%Never married
- 28.5%Now married
- 0.0%Separated
- 0.0%Widowed
- 11.7%Divorced
- Females
- 31.9%Never married
- 34.5%Now married
- 0.0%Separated
- 3.4%Widowed
- 30.3%Divorced
Women who did not give birth in the past 12 months
| Now married: | 28.4% (118) |
| Unmarried: | 71.6% (299) |
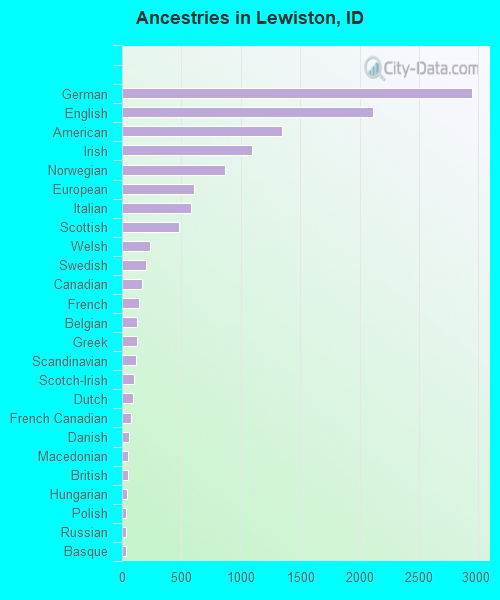
Ancestries in Lewiston

- 2,94320.1%German
- 2,11714.5%English
- 1,3469.2%American
- 1,0977.5%Irish
- 8685.9%Norwegian
- 6094.2%European
- 5783.9%Italian
- 4833.3%Scottish
- 2351.6%Welsh
- 2061.4%Swedish
- 1691.2%Canadian
- 1421.0%French
- 1260.9%Belgian
- 1250.9%Greek
- 1190.8%Scandinavian
- 1020.7%Scotch-Irish
- 930.6%Dutch
- 720.5%French Canadian
- 620.4%Danish
- 530.4%Macedonian
- 470.3%British
- 430.3%Hungarian
- 370.3%Polish
- 360.2%Russian
- 330.2%Basque
- 290.2%Finnish
- 220.2%Swiss
- 150.1%Pennsylvania German
- 150.1%Afghan
- 100.07%Lebanese
- 100.07%Slovene
- 80.05%Austrian
- 80.05%Northern European
- 50.03%Eastern European
- 40.03%Lithuanian
Geographical mobility in Lewiston

- Same house 1 year ago
- 27,09285.0%White (Caucasian)
- 2471.7%Black or African American
- 282100.0%American Indian / Alaska Native
- 27681.5%Asian
- 24485.7%Other race
- 1,74274.6%Two or more races
- 27,15185.6%White alone, not Hispanic / Latino
- 1,07364.7%Hispanic or Latino

-
- Moved within same county
- 2,3427.4%White / Caucasian
- 31.2%American Indian / Alaska Native
- 144.9%Other race
- 39917.1%Two or more races
- 2,3357.4%White alone, not Hispanic / Latino
- 21613.0%Hispanic or Latino

-
- Moved within same state
- 9793.1%White / Caucasian
- 928.1%Black or African American
- 31.0%American Indian / Alaska Native
- 61.7%Asian
- 542.3%Two or more races
- 8402.6%White alone, not Hispanic / Latino
- 19912.0%Hispanic or Latino

-
- Moved from different state
- 1,2984.1%White / Caucasian
- 31.1%American Indian / Alaska Native
- 3710.9%Asian
- 248.3%Other race
- 883.8%Two or more races
- 1,2554.0%White alone, not Hispanic / Latino
- 1046.2%Hispanic or Latino

-
- Moved from abroad
- 1460.5%White
- 3811.2%Asian
- 1590.5%White alone, not Hispanic / Latino

Children Nativity (place of birth) in Lewiston
Place of birth for residents in Lewiston
![Place of birth for the foreign-born population - Regions]()
- 437Americas
- 338Asia
- 225Northern America
- 212Latin America
- 165Central America
- 155South Eastern Asia
- 139South Central Asia
- 135Europe
- 67Western Europe
- 56Eastern Europe
- 43Eastern Asia
- 31South America
- 15Caribbean
- 14Africa
- 14Southern Africa
- 12Northern Europe
- 5China

![Place of birth for the foreign-born population - Countries]()
- 225Canada
- 112Guatemala
- 84Nepal
- 67Germany
- 64Philippines
- 56North Macedonia (Macedonia)
- 53Mexico
- 50Thailand
- 42Kazakhstan
- 38Korea
- 31Venezuela
- 23Malaysia
- 15Cuba
- 14South Africa
- 13Vietnam
- 12Afghanistan
- 8United Kingdom
- 5China
- 4England
- 3Indonesia

Grandparents responsible for own grandchildren in Lewiston
Zip codes: 83501.