Races in Leland, North Carolina (NC) Detailed Stats
Ancestries, Foreign-born residents, place of birth
Settings
X


Recent posts about races in Leland, North Carolina on our local forum with over 2,400,000 registered users:
 | relocating from NJ to Coastal NC - Leland or closer to beaches?? (54 replies) |
| Coastal New England vs. Southeast Coastal House's (8 replies) |
| Let's Talk Utilities in Leland Shall We! (13 replies) |
| Leland new construction- builder questions (5 replies) |
| Compass Pointe - Pros and Cons (212 replies) |
| Where to buy European groceries? Can't find any around here. (32 replies) |
Latest news about races in Leland, NC collected exclusively by city-data.com from local newspapers, TV, and radio stations
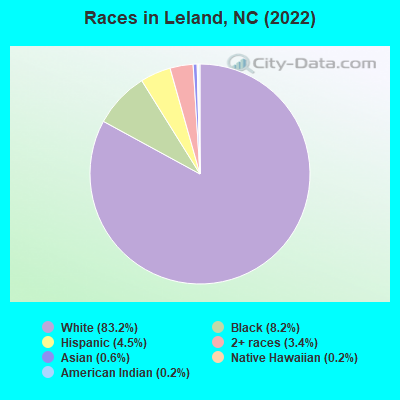
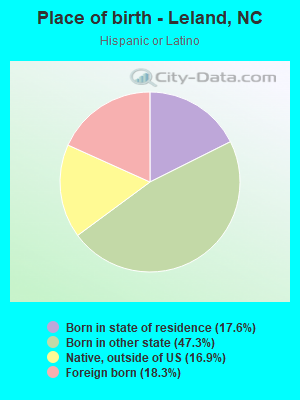
According to 2022 data, the most numerous races in Leland, NC are White alone (22,314 residents), Black alone (2,204 residents), and Hispanic (1,217 residents). 93.8% of Leland residents speak English at home. 4.0% of Leland, NC residents are foreign-born (2.1% born in Europe, 1.3% born in Latin America, 0.6% born in Asia), which is 99.7% less than the foreign-born rate of 8.0% across the entire state of North Carolina.
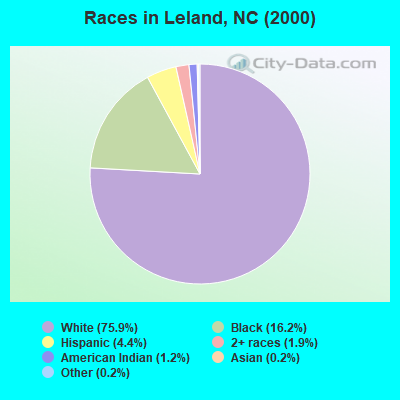
Race distribution in Leland
2000
2022

- 1,47175.9%White alone
- 31416.2%Black alone
- 864.4%Hispanic
- 361.9%Two or more races
- 241.2%American Indian alone
- 40.2%Asian alone
- 30.2%Other race alone
-
- 22,31483.2%White alone
- 2,2048.2%Black alone
- 1,2174.5%Hispanic
- 9123.4%Two or more races
- 1490.6%Asian alone
- 420.2%American Indian alone
- 630.2%Native Hawaiian and Other
Pacific Islander alone - 80.03%Other race alone
2000
2022
-
- 5,647,15570.2%White alone
- 1,723,30121.4%Black alone
- 378,9634.7%Hispanic
- 112,4161.4%Asian alone
- 95,3331.2%American Indian alone
- 79,9651.0%Two or more races
- 9,0150.1%Other race alone
- 3,1650.04%Native Hawaiian and Other
Pacific Islander alone

-
- 6,497,51960.7%White alone
- 2,155,65020.1%Black alone
- 1,114,79910.4%Hispanic
- 438,0614.1%Two or more races
- 341,0523.2%Asian alone
- 91,7580.9%American Indian alone
- 50,1800.5%Other race alone
- 9,9540.09%Native Hawaiian and Other
Pacific Islander alone

Income and house value in Leland
- Median household income in 2022
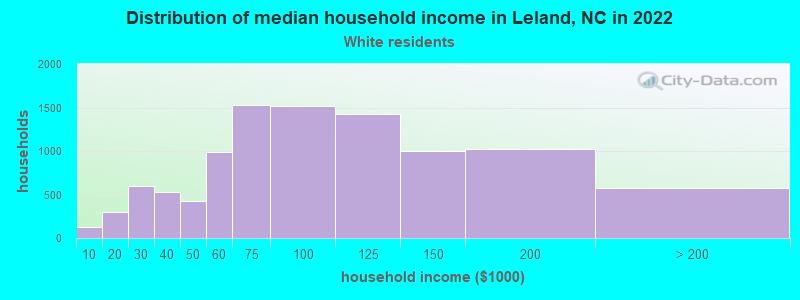
- $85,364White non-Hispanic householders
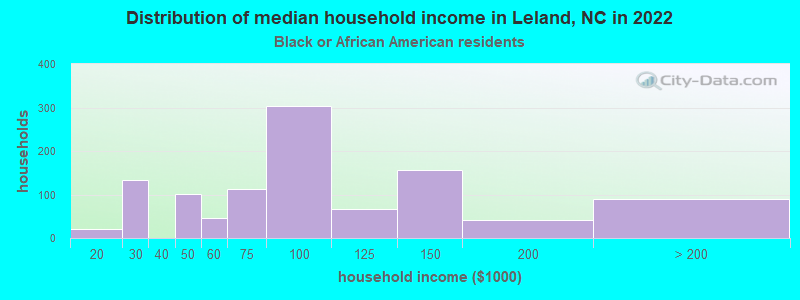
- $138,859Black householders
- $78,324Some other race householders
- $52,264Two or more races householders
- $80,425Hispanic or Latino race householders
- Median 2022 house value
- $506,375White Non-Hispanic householders
- $336,752Black or African American householders
- over $1,000,000Two or more races householders
Household income for White non-Hispanic householders
Household income for Black householders
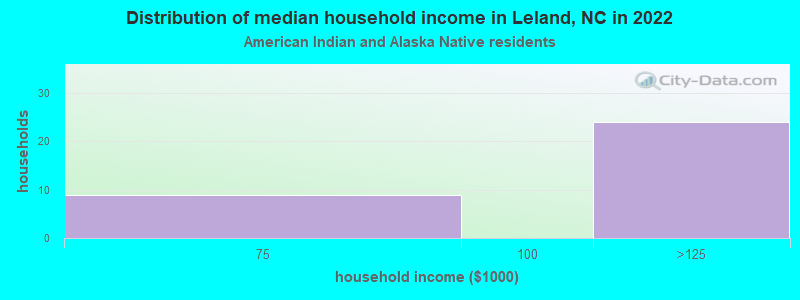
Household income for American Indian and Alaska Native householders
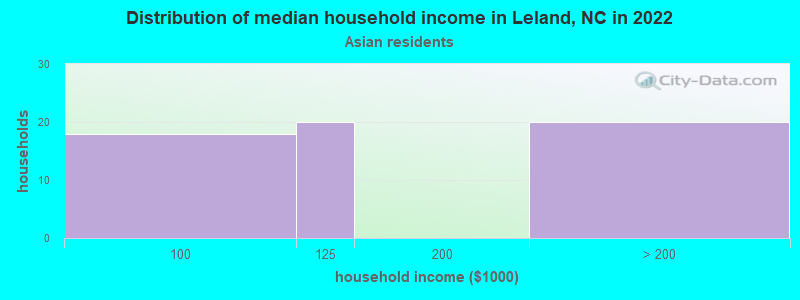
Household income for Asian householders
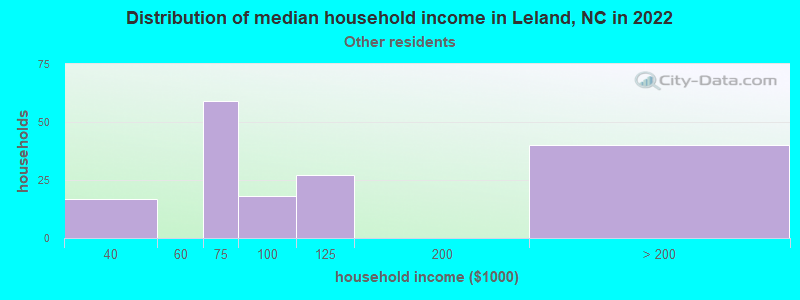
Household income for Some other race householders
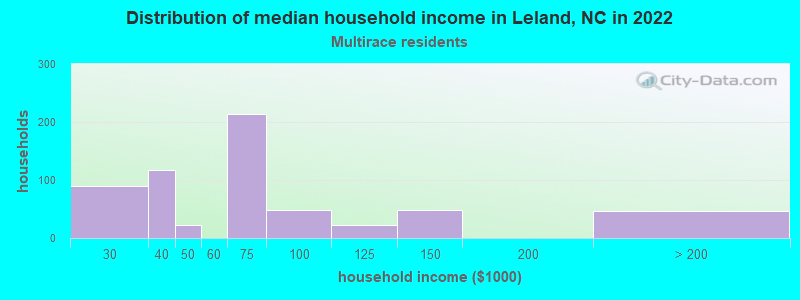
Household income for Two or more races householders
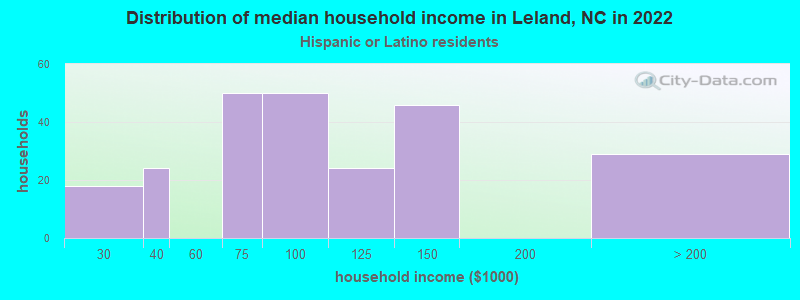
Household income for Hispanic or Latino race householders
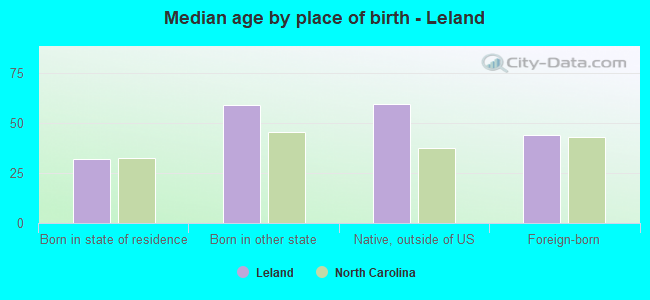
Median age by race in Leland
- 48.9Median age for White residents
- 47.8Males
- 51.6Females
- 45.1Median age for Black or African American residents
- 42.6Males
- 60.6Females
- 32.6Median age for American Indian / Alaska Native residents
- -668,604,650.5Males
- -682,971,013.8Females
- 50.2Median age for Asian residents
- 60.4Males
- 46.5Females
- -609,884,331.7Median age for Native Hawaiian / Pacific Islander residents
- -666,666,666.0Males
- -666,666,666.0Females
- 31.5Median age for Other race residents
- 38.4Males
- 31.1Females
- 35.5Median age for Two or more races residents
- 39.5Males
- 26.1Females
- 49.4Median age for White alone residents
- 48.4Males
- 52.1Females
- 27.9Median age for Hispanic or Latino residents
- 44.1Males
- 20.8Females
Owner/renter occupied households by race in Leland
- House owners and renters - White residents
- 8,67887.1%Owner occupied
- 1,28912.9%Renter occupied
- House owners and renters - Black or African American residents
- 1,02378.6%Owner occupied
- 27921.4%Renter occupied
- House owners and renters - American Indian / Alaska Native residents
- 35100.0%Owner occupied
- House owners and renters - Asian residents
- 61100.0%Owner occupied
- House owners and renters - Other race residents
- 156100.0%Owner occupied
- House owners and renters - Two or more races residents
- 18727.0%Owner occupied
- 50773.0%Renter occupied
- House owners and renters - White alone residents
- 8,68487.4%Owner occupied
- 1,24712.6%Renter occupied
- House owners and renters - Hispanic or Latino residents
- 23387.4%Owner occupied
- 3412.6%Renter occupied
Language usage in Leland
- English speakers - Total
- 93.8% of residents of Leland speak English at home.
- 3.4% of residents speak Spanish at home
- 55868.1%Speak English very well
- 26131.9%Speak English less than very well
- 2.5% of residents speak other language at home
- 51084.3%Speak English very well
- 9515.7%Speak English less than very well
- English speakers - Born in the United States
- 97.5% of residents of Leland speak English at home.
- 1.8% of residents speak Spanish at home
- 267100.0%Speak English very well
- 0.5% of residents speak other language at home
- 80100.0%Speak English very well
- English speakers - Native, born elsewhere
- 68.9% of residents of Leland speak English at home.
- 22.8% of residents speak Spanish at home
- 5976.6%Speak English very well
- 1823.4%Speak English less than very well
- 7.4% of residents speak other language at home
- 25100.0%Speak English very well
- English speakers - Foreign-born
- 32.1% of residents of Leland speak English at home.
- 32.9% of residents speak Spanish at home
- 12435.1%Speak English very well
- 22964.9%Speak English less than very well
- 35.4% of residents speak other language at home
- 30179.2%Speak English very well
- 7920.8%Speak English less than very well
White (Caucasian) - Speak only English
| Native: | 99.1% (20,828) |
| Foreign-born: | 55.3% (150) |
White (Caucasian) - Speak another language
| Native: | 0.7% (142) |
| Foreign-born: | 73.6% (200) |
Asian - Speak another language
| Native: | 70.9% (34) |
| Foreign-born: | 100.0% (119) |
Other race - Speak another language
| Native: | 72.8% (97) |
| Foreign-born: | 97.5% (136) |
Two or more races - Speak only English
| Native: | 96.1% (1,289) |
| Foreign-born: | 7.4% (10) |
Two or more races - Speak another language
| Native: | 1.0% (14) |
| Foreign-born: | 92.8% (120) |
White alone - Speak only English
| Native: | 99.4% (20,733) |
| Foreign-born: | 55.0% (150) |
White alone - Speak another language
| Native: | 0.6% (116) |
| Foreign-born: | 44.0% (120) |
Hispanic or Latino - Speak another language
| Native: | 23.0% (211) |
| Foreign-born: | 100.0% (205) |
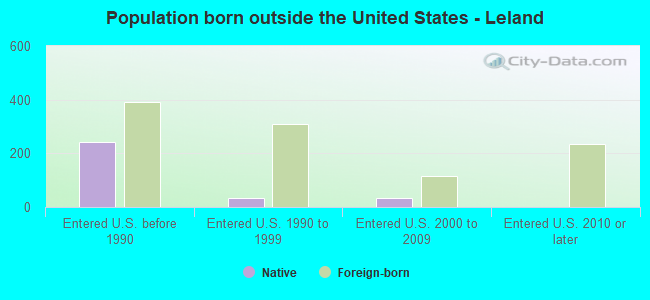
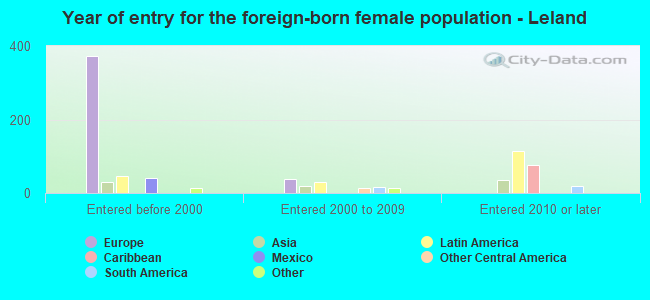
Foreign-born residents in Leland
1,074 residents are foreign born (2.1% Europe, 1.3% Latin America, 0.6% Asia).
| This city: | 4.0% |
| North Carolina: | 8.3% |
Marital status for residents in Leland
Marital status - White (Caucasian) population 15 years and over
- Males
- 24.1%Never married
- 65.3%Now married
- 0.2%Separated
- 2.3%Widowed
- 8.1%Divorced
- Females
- 17.5%Never married
- 60.2%Now married
- 0.9%Separated
- 7.8%Widowed
- 13.7%Divorced
Women who gave birth in the past 12 months
| Now married: | 100.0% (98) |
| Unmarried: | 0.0% (0) |
Women who did not give birth in the past 12 months
| Now married: | 52.2% (2,071) |
| Unmarried: | 47.8% (1,895) |
Marital status - Black or African American population 15 years and over
- Males
- 55.6%Never married
- 23.3%Now married
- 2.5%Separated
- 10.8%Widowed
- 7.8%Divorced
- Females
- 36.8%Never married
- 32.3%Now married
- 0.0%Separated
- 14.2%Widowed
- 16.7%Divorced
Women who did not give birth in the past 12 months
| Now married: | 7.9% (27) |
| Unmarried: | 92.1% (313) |
Marital status - American Indian / Alaska Native population 15 years and over
- Males
- 0.0%Never married
- 100.0%Now married
- 0.0%Separated
- 0.0%Widowed
- 0.0%Divorced
- Females
- 0.0%Never married
- 100.0%Now married
- 0.0%Separated
- 0.0%Widowed
- 0.0%Divorced
Women who did not give birth in the past 12 months
| Now married: | 100.0% (3) |
| Unmarried: | 0.0% (0) |
Marital status - Asian population 15 years and over
- Males
- 12.9%Never married
- 87.1%Now married
- 0.0%Separated
- 0.0%Widowed
- 0.0%Divorced
- Females
- 0.0%Never married
- 100.0%Now married
- 0.0%Separated
- 0.0%Widowed
- 0.0%Divorced
Women who did not give birth in the past 12 months
| Now married: | 100.0% (46) |
| Unmarried: | 0.0% (0) |
Marital status - Other race population 15 years and over
- Males
- 32.9%Never married
- 58.4%Now married
- 0.0%Separated
- 0.0%Widowed
- 8.7%Divorced
- Females
- 57.3%Never married
- 42.7%Now married
- 0.0%Separated
- 0.0%Widowed
- 0.0%Divorced
Women who did not give birth in the past 12 months
| Now married: | 33.6% (52) |
| Unmarried: | 66.4% (103) |
Marital status - Two or more races population 15 years and over
- Males
- 16.8%Never married
- 45.7%Now married
- 0.0%Separated
- 5.8%Widowed
- 31.6%Divorced
- Females
- 48.0%Never married
- 34.9%Now married
- 0.0%Separated
- 0.0%Widowed
- 17.1%Divorced
Women who gave birth in the past 12 months
| Now married: | 100.0% (19) |
| Unmarried: | 0.0% (0) |
Women who did not give birth in the past 12 months
| Now married: | 24.0% (116) |
| Unmarried: | 76.0% (368) |
Marital status - White alone, not Hispanic / Latino population 15 years and over
- Males
- 23.8%Never married
- 65.4%Now married
- 0.2%Separated
- 2.3%Widowed
- 8.3%Divorced
- Females
- 17.3%Never married
- 60.3%Now married
- 0.9%Separated
- 7.8%Widowed
- 13.7%Divorced
Women who gave birth in the past 12 months
| Now married: | 100.0% (96) |
| Unmarried: | 0.0% (0) |
Women who did not give birth in the past 12 months
| Now married: | 52.5% (2,079) |
| Unmarried: | 47.5% (1,878) |
Marital status - Hispanic or Latino population 15 years and over
- Males
- 29.1%Never married
- 67.6%Now married
- 0.0%Separated
- 0.0%Widowed
- 3.3%Divorced
- Females
- 45.5%Never married
- 34.4%Now married
- 0.0%Separated
- 0.0%Widowed
- 20.1%Divorced
Women who gave birth in the past 12 months
| Now married: | 100.0% (3) |
| Unmarried: | 0.0% (0) |
Women who did not give birth in the past 12 months
| Now married: | 17.5% (54) |
| Unmarried: | 82.5% (254) |
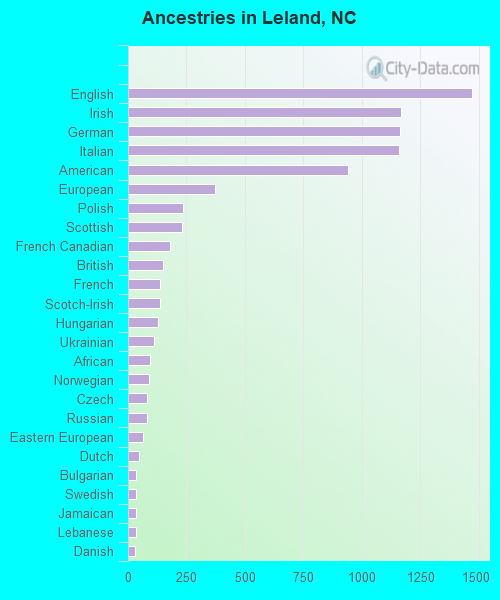
Ancestries in Leland

- 1,47012.6%English
- 1,16710.0%Irish
- 1,1619.9%German
- 1,1609.9%Italian
- 9418.0%American
- 3733.2%European
- 2342.0%Polish
- 2322.0%Scottish
- 1781.5%French Canadian
- 1491.3%British
- 1371.2%French
- 1371.2%Scotch-Irish
- 1291.1%Hungarian
- 1100.9%Ukrainian
- 940.8%African
- 890.8%Norwegian
- 830.7%Czech
- 820.7%Russian
- 660.6%Eastern European
- 460.4%Dutch
- 350.3%Bulgarian
- 350.3%Swedish
- 340.3%Jamaican
- 330.3%Lebanese
- 290.2%Danish
- 250.2%Scandinavian
- 230.2%Pennsylvania German
- 190.2%Canadian
- 170.1%Slovak
- 150.1%Romanian
- 140.1%Welsh
- 120.1%Swiss
- 110.09%Lithuanian
- 90.08%Yugoslavian
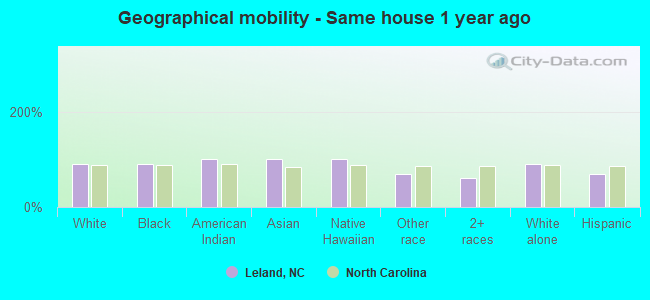
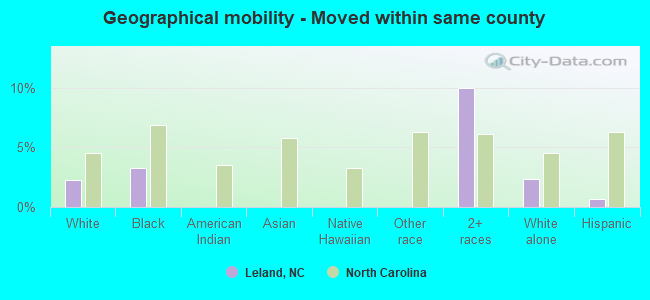
Geographical mobility in Leland

- Same house 1 year ago
- 20,33090.7%White (Caucasian)
- 1,94691.4%Black or African American
- 46100.0%American Indian / Alaska Native
- 171100.0%Asian
- 64100.0%Native Hawaiian / Pacific Islander
- 29568.6%Other race
- 99661.1%Two or more races
- 20,19591.0%White alone, not Hispanic / Latino
- 78869.7%Hispanic or Latino
-
- Moved within same county
- 5052.3%White / Caucasian
- 693.2%Black or African American
- 16310.0%Two or more races
- 5162.3%White alone, not Hispanic / Latino
- 80.7%Hispanic or Latino
-
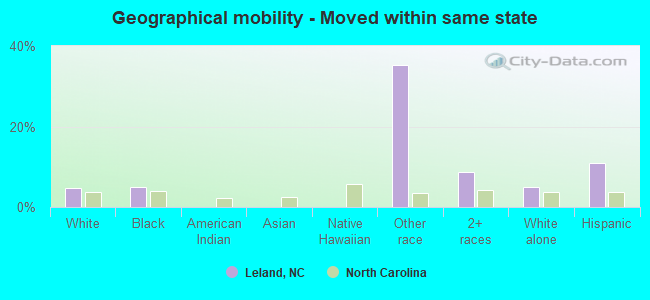
- Moved within same state
- 1,0824.8%White / Caucasian
- 1044.9%Black or African American
- 15135.2%Other race
- 1428.7%Two or more races
- 1,1065.0%White alone, not Hispanic / Latino
- 12210.8%Hispanic or Latino
-
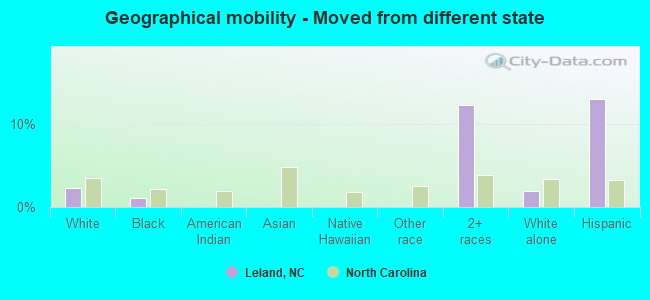
- Moved from different state
- 5042.2%White / Caucasian
- 221.0%Black or African American
- 20212.4%Two or more races
- 4271.9%White alone, not Hispanic / Latino
- 14813.1%Hispanic or Latino
-
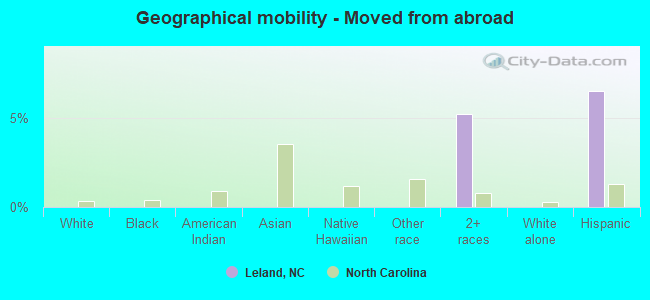
- Moved from abroad
- 855.2%Two or more races
- 736.5%Hispanic or Latino
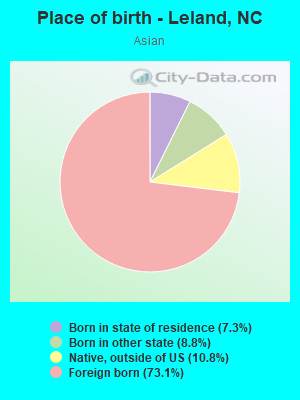
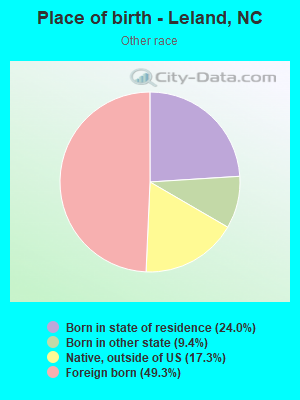
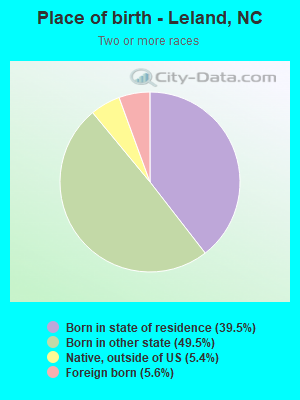
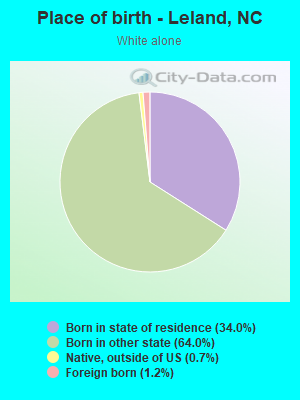
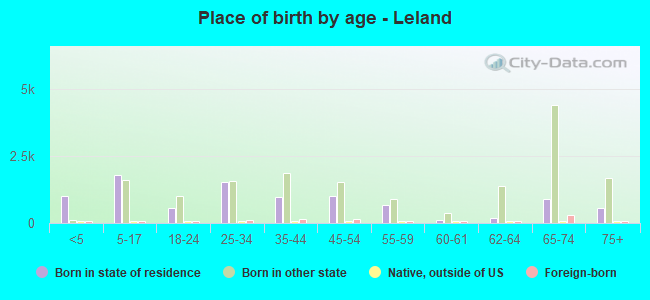
Children Nativity (place of birth) in Leland
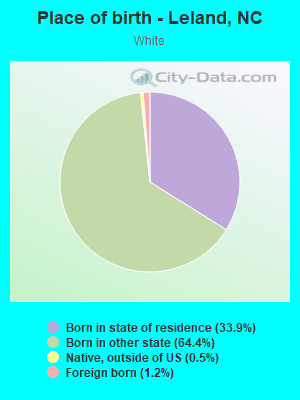
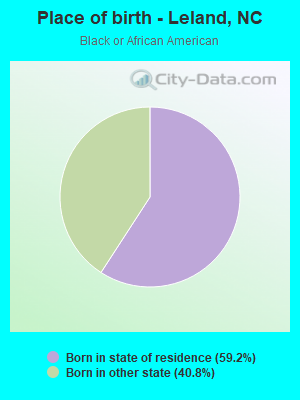
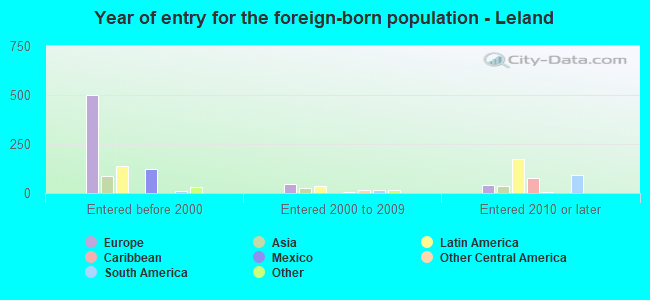
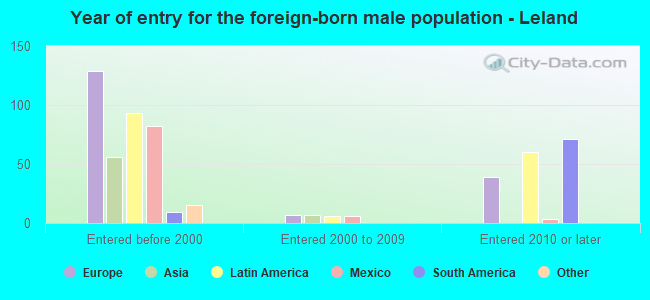
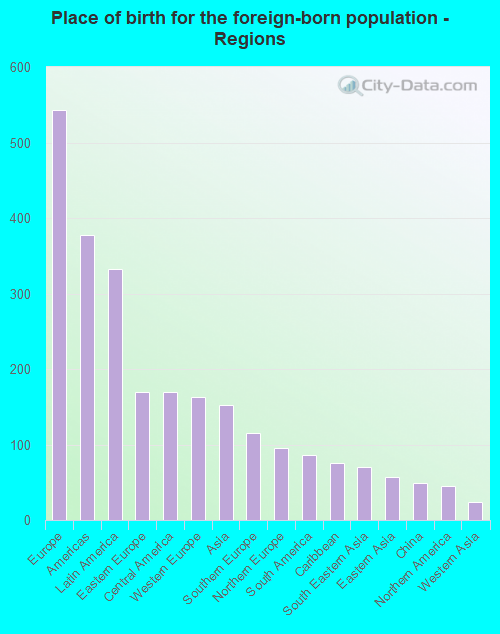
Place of birth for residents in Leland
![Place of birth for the foreign-born population - Regions]()
- 543Europe
- 378Americas
- 332Latin America
- 170Eastern Europe
- 170Central America
- 163Western Europe
- 152Asia
- 115Southern Europe
- 95Northern Europe
- 86South America
- 76Caribbean
- 70South Eastern Asia
- 57Eastern Asia
- 49China
- 45Northern America
- 24Western Asia
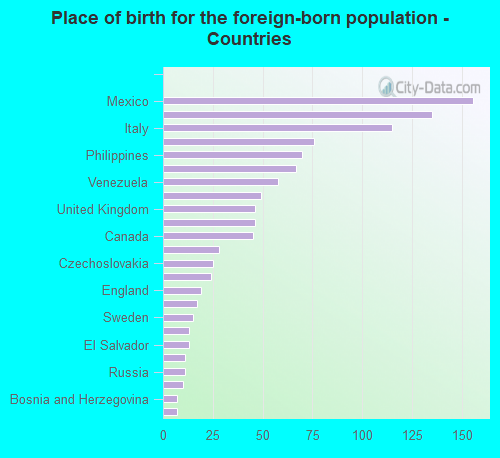
![Place of birth for the foreign-born population - Countries]()
- 156Mexico
- 135Germany
- 115Italy
- 76Dominican Republic
- 70Philippines
- 67Poland
- 58Venezuela
- 49China
- 46United Kingdom
- 46Ukraine
- 45Canada
- 28France
- 25Czechoslovakia
- 24Lebanon
- 19England
- 17Peru
- 15Sweden
- 13Scotland
- 13El Salvador
- 11Hungary
- 11Russia
- 10Argentina
- 7Bosnia and Herzegovina
- 7Korea
Grandparents responsible for own grandchildren in Leland
Zip codes: 28451.