Races in Leawood, Kansas (KS) Detailed Stats
Data:
Races - White alone (%)
Races - White alone (% change since 2000)
Races - Black alone (%)
Races - Black alone (% change since 2000)
Races - American Indian alone (%)
Races - American Indian alone (% change since 2000)
Races - Asian alone (%)
Races - Asian alone (% change since 2000)
Races - Hispanic (%)
Races - Hispanic (% change since 2000)
Races - Native Hawaiian and Other Pacific Islander alone (%)
Races - Native Hawaiian and Other Pacific Islander alone (% change since 2000)
Races - Two or more races(%)
Races - Two or more races(% change since 2000)
Races - Other race alone (%)
Races - Other race alone (% change since 2000)
Racial diversity
Place of birth - Born in state of residence (%)
Place of birth - Born in state of residence (%) - White
Place of birth - Born in state of residence (%) - Black or African American
Place of birth - Born in state of residence (%) - Asian
Place of birth - Born in state of residence (%) - Hispanic or Latino
Place of birth - Born in state of residence (%) - American Indian and Alaska Native
Place of birth - Born in state of residence (%) - Multirace
Place of birth - Born in state of residence (%) - Other Race
Place of birth - Born in other state (%)
Place of birth - Born in other state (%) - White
Place of birth - Born in other state (%) - Black or African American
Place of birth - Born in other state (%) - Asian
Place of birth - Born in other state (%) - Hispanic or Latino
Place of birth - Born in other state (%) - American Indian and Alaska Native
Place of birth - Born in other state (%) - Multirace
Place of birth - Born in other state (%) - Other Race
Place of birth - Native, outside of US (%)
Place of birth - Native, outside of US (%) - White
Place of birth - Native, outside of US (%) - Black or African American
Place of birth - Native, outside of US (%) - Asian
Place of birth - Native, outside of US (%) - Hispanic or Latino
Place of birth - Native, outside of US (%) - American Indian and Alaska Native
Place of birth - Native, outside of US (%) - Multirace
Place of birth - Native, outside of US (%) - Other Race
Place of birth - Foreign born (%)
Place of birth - Foreign born (%) - White
Place of birth - Foreign born (%) - Black or African American
Place of birth - Foreign born (%) - Asian
Place of birth - Foreign born (%) - Hispanic or Latino
Place of birth - Foreign born (%) - American Indian and Alaska Native
Place of birth - Foreign born (%) - Multirace
Place of birth - Foreign born (%) - Other Race
Residents speaking English at home (%)
Residents speaking English at home - Born in the United States (%)
Residents speaking English at home - Native, born elsewhere (%)
Residents speaking English at home - Foreign born (%)
Residents speaking Spanish at home (%)
Residents speaking Spanish at home - Born in the United States (%)
Residents speaking Spanish at home - Native, born elsewhere (%)
Residents speaking Spanish at home - Foreign born (%)
Residents speaking other language at home (%)
Residents speaking other language at home - Born in the United States (%)
Residents speaking other language at home - Native, born elsewhere (%)
Residents speaking other language at home - Foreign born (%)
Marital status - Never married (%)
Marital status - Now married (%)
Marital status - Separated (%)
Marital status - Widowed (%)
Marital status - Divorced (%)
Ancestries Reported - Arab (%)
Ancestries Reported - Czech (%)
Ancestries Reported - Danish (%)
Ancestries Reported - Dutch (%)
Ancestries Reported - English (%)
Ancestries Reported - French (%)
Ancestries Reported - French Canadian (%)
Ancestries Reported - German (%)
Ancestries Reported - Greek (%)
Ancestries Reported - Hungarian (%)
Ancestries Reported - Irish (%)
Ancestries Reported - Italian (%)
Ancestries Reported - Lithuanian (%)
Ancestries Reported - Norwegian (%)
Ancestries Reported - Polish (%)
Ancestries Reported - Portuguese (%)
Ancestries Reported - Russian (%)
Ancestries Reported - Scotch-Irish (%)
Ancestries Reported - Scottish (%)
Ancestries Reported - Slovak (%)
Ancestries Reported - Subsaharan African (%)
Ancestries Reported - Swedish (%)
Ancestries Reported - Swiss (%)
Ancestries Reported - Ukrainian (%)
Ancestries Reported - United States (%)
Ancestries Reported - Welsh (%)
Ancestries Reported - West Indian (%)
Ancestries Reported - Other (%)
Geographical mobility - Same house 1 year ago (%)
Geographical mobility - Same house 1 year ago (%) - White
Geographical mobility - Same house 1 year ago (%) - Black or African American
Geographical mobility - Same house 1 year ago (%) - Asian
Geographical mobility - Same house 1 year ago (%) - Hispanic or Latino
Geographical mobility - Same house 1 year ago (%) - American Indian and Alaska Native
Geographical mobility - Same house 1 year ago (%) - Multirace
Geographical mobility - Same house 1 year ago (%) - Other Race
Geographical mobility - Moved within same county (%)
Geographical mobility - Moved within same county (%) - White
Geographical mobility - Moved within same county (%) - Black or African American
Geographical mobility - Moved within same county (%) - Asian
Geographical mobility - Moved within same county (%) - Hispanic or Latino
Geographical mobility - Moved within same county (%) - American Indian and Alaska Native
Geographical mobility - Moved within same county (%) - Multirace
Geographical mobility - Moved within same county (%) - Other Race
Geographical mobility - Moved from different county within same state (%)
Geographical mobility - Moved from different county within same state (%) - White
Geographical mobility - Moved from different county within same state (%) - Black or African American
Geographical mobility - Moved from different county within same state (%) - Asian
Geographical mobility - Moved from different county within same state (%) - Hispanic or Latino
Geographical mobility - Moved from different county within same state (%) - American Indian and Alaska Native
Geographical mobility - Moved from different county within same state (%) - Multirace
Geographical mobility - Moved from different county within same state (%) - Other Race
Geographical mobility - Moved from different state (%)
Geographical mobility - Moved from different state (%) - White
Geographical mobility - Moved from different state (%) - Black or African American
Geographical mobility - Moved from different state (%) - Asian
Geographical mobility - Moved from different state (%) - Hispanic or Latino
Geographical mobility - Moved from different state (%) - American Indian and Alaska Native
Geographical mobility - Moved from different state (%) - Multirace
Geographical mobility - Moved from different state (%) - Other Race
Geographical mobility - Moved from abroad (%)
Geographical mobility - Moved from abroad (%) - White
Geographical mobility - Moved from abroad (%) - Black or African American
Geographical mobility - Moved from abroad (%) - Asian
Geographical mobility - Moved from abroad (%) - Hispanic or Latino
Geographical mobility - Moved from abroad (%) - American Indian and Alaska Native
Geographical mobility - Moved from abroad (%) - Multirace
Geographical mobility - Moved from abroad (%) - Other Race
Place of birth for the foreign-born population - Ireland (%)
Place of birth for the foreign-born population - Denmark (%)
Place of birth for the foreign-born population - Norway (%)
Place of birth for the foreign-born population - Sweden (%)
Place of birth for the foreign-born population - United Kingdom (%)
Place of birth for the foreign-born population - England (%)
Place of birth for the foreign-born population - Scotland (%)
Place of birth for the foreign-born population - Other Northern Europe (%)
Place of birth for the foreign-born population - Austria (%)
Place of birth for the foreign-born population - Belgium (%)
Place of birth for the foreign-born population - France (%)
Place of birth for the foreign-born population - Germany (%)
Place of birth for the foreign-born population - Netherlands (%)
Place of birth for the foreign-born population - Switzerland (%)
Place of birth for the foreign-born population - Other Western Europe (%)
Place of birth for the foreign-born population - Greece (%)
Place of birth for the foreign-born population - Italy (%)
Place of birth for the foreign-born population - Portugal (%)
Place of birth for the foreign-born population - Spain (%)
Place of birth for the foreign-born population - Other Southern Europe (%)
Place of birth for the foreign-born population - Albania (%)
Place of birth for the foreign-born population - Belarus (%)
Place of birth for the foreign-born population - Bosnia and Herzegovina (%)
Place of birth for the foreign-born population - Bulgaria (%)
Place of birth for the foreign-born population - Croatia (%)
Place of birth for the foreign-born population - Czechoslovakia (%)
Place of birth for the foreign-born population - Hungary (%)
Place of birth for the foreign-born population - Latvia (%)
Place of birth for the foreign-born population - Lithuania (%)
Place of birth for the foreign-born population - North Macedonia (Macedonia) (%)
Place of birth for the foreign-born population - Moldova (%)
Place of birth for the foreign-born population - Poland (%)
Place of birth for the foreign-born population - Romania (%)
Place of birth for the foreign-born population - Russia (%)
Place of birth for the foreign-born population - Serbia (%)
Place of birth for the foreign-born population - Ukraine (%)
Place of birth for the foreign-born population - Other Eastern Europe (%)
Place of birth for the foreign-born population - China (%)
Place of birth for the foreign-born population - Hong Kong (%)
Place of birth for the foreign-born population - Taiwan (%)
Place of birth for the foreign-born population - Japan (%)
Place of birth for the foreign-born population - Korea (%)
Place of birth for the foreign-born population - Other Eastern Asia (%)
Place of birth for the foreign-born population - Afghanistan (%)
Place of birth for the foreign-born population - Bangladesh (%)
Place of birth for the foreign-born population - India (%)
Place of birth for the foreign-born population - Iran (%)
Place of birth for the foreign-born population - Kazakhstan (%)
Place of birth for the foreign-born population - Nepal (%)
Place of birth for the foreign-born population - Pakistan (%)
Place of birth for the foreign-born population - Sri Lanka (%)
Place of birth for the foreign-born population - Uzbekistan (%)
Place of birth for the foreign-born population - Other South Central Asia (%)
Place of birth for the foreign-born population - Burma (%)
Place of birth for the foreign-born population - Cambodia (%)
Place of birth for the foreign-born population - Indonesia (%)
Place of birth for the foreign-born population - Laos (%)
Place of birth for the foreign-born population - Malaysia (%)
Place of birth for the foreign-born population - Philippines (%)
Place of birth for the foreign-born population - Singapore (%)
Place of birth for the foreign-born population - Thailand (%)
Place of birth for the foreign-born population - Vietnam (%)
Place of birth for the foreign-born population - Other South Eastern Asia (%)
Place of birth for the foreign-born population - Armenia (%)
Place of birth for the foreign-born population - Iraq (%)
Place of birth for the foreign-born population - Israel (%)
Place of birth for the foreign-born population - Jordan (%)
Place of birth for the foreign-born population - Kuwait (%)
Place of birth for the foreign-born population - Lebanon (%)
Place of birth for the foreign-born population - Saudi Arabia (%)
Place of birth for the foreign-born population - Syria (%)
Place of birth for the foreign-born population - Turkey (%)
Place of birth for the foreign-born population - Yemen (%)
Place of birth for the foreign-born population - Other Western Asia (%)
Place of birth for the foreign-born population - Eritrea (%)
Place of birth for the foreign-born population - Ethiopia (%)
Place of birth for the foreign-born population - Kenya (%)
Place of birth for the foreign-born population - Somalia (%)
Place of birth for the foreign-born population - Uganda (%)
Place of birth for the foreign-born population - Zimbabwe (%)
Place of birth for the foreign-born population - Other Eastern Africa (%)
Place of birth for the foreign-born population - Cameroon (%)
Place of birth for the foreign-born population - Congo (%)
Place of birth for the foreign-born population - Democratic Republic of Congo (Zaire) (%)
Place of birth for the foreign-born population - Other Middle Africa (%)
Place of birth for the foreign-born population - Egypt (%)
Place of birth for the foreign-born population - Morocco (%)
Place of birth for the foreign-born population - Sudan (%)
Place of birth for the foreign-born population - Other Northern Africa (%)
Place of birth for the foreign-born population - South Africa (%)
Place of birth for the foreign-born population - Other Southern Africa (%)
Place of birth for the foreign-born population - Cabo Verde (%)
Place of birth for the foreign-born population - Ghana (%)
Place of birth for the foreign-born population - Liberia (%)
Place of birth for the foreign-born population - Nigeria (%)
Place of birth for the foreign-born population - Senegal (%)
Place of birth for the foreign-born population - Sierra Leone (%)
Place of birth for the foreign-born population - Other Western Africa (%)
Place of birth for the foreign-born population - Australia (%)
Place of birth for the foreign-born population - New Zealand (%)
Place of birth for the foreign-born population - Fiji (%)
Place of birth for the foreign-born population - Micronesia (%)
Place of birth for the foreign-born population - Bahamas (%)
Place of birth for the foreign-born population - Barbados (%)
Place of birth for the foreign-born population - Cuba (%)
Place of birth for the foreign-born population - Dominica (%)
Place of birth for the foreign-born population - Dominican Republic (%)
Place of birth for the foreign-born population - Grenada (%)
Place of birth for the foreign-born population - Haiti (%)
Place of birth for the foreign-born population - Jamaica (%)
Place of birth for the foreign-born population - St. Vincent and the Grenadines (%)
Place of birth for the foreign-born population - Trinidad and Tobago (%)
Place of birth for the foreign-born population - West Indies (%)
Place of birth for the foreign-born population - Other Caribbean (%)
Place of birth for the foreign-born population - Belize (%)
Place of birth for the foreign-born population - Costa Rica (%)
Place of birth for the foreign-born population - El Salvador (%)
Place of birth for the foreign-born population - Guatemala (%)
Place of birth for the foreign-born population - Honduras (%)
Place of birth for the foreign-born population - Mexico (%)
Place of birth for the foreign-born population - Nicaragua (%)
Place of birth for the foreign-born population - Panama (%)
Place of birth for the foreign-born population - Other Central America (%)
Place of birth for the foreign-born population - Argentina (%)
Place of birth for the foreign-born population - Bolivia (%)
Place of birth for the foreign-born population - Brazil (%)
Place of birth for the foreign-born population - Chile (%)
Place of birth for the foreign-born population - Colombia (%)
Place of birth for the foreign-born population - Ecuador (%)
Place of birth for the foreign-born population - Guyana (%)
Place of birth for the foreign-born population - Peru (%)
Place of birth for the foreign-born population - Uruguay (%)
Place of birth for the foreign-born population - Venezuela (%)
Place of birth for the foreign-born population - Other South America (%)
Place of birth for the foreign-born population - Canada (%)
Place of birth for the foreign-born population - Other Northern America (%)
Place of birth for the foreign-born population - Other (%)
Latest news about races in Leawood, KS collected exclusively by city-data.com from local newspapers, TV, and radio stations
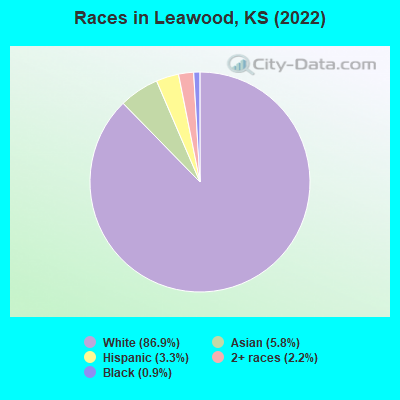
According to 2022 data, the most numerous races in Leawood, KS are White alone (29,748 residents), Hispanic (1,146 residents), and Black alone (314 residents). 94.2% of Leawood residents speak English at home. 5.9% of Leawood, KS residents are foreign-born (4.1% born in Asia, 1.3% born in Europe), which is 18.2% less than the foreign-born rate of 7.0% across the entire state of Kansas.
Race distribution in Leawood
2000 2022
2,233,997 83.1% White alone 188,252 7.0% Hispanic 151,407 5.6% Black alone 46,301 1.7% Asian alone 42,508 1.6% Two or more races 22,322 0.8% American Indian alone 2,477 0.09% Other race alone 1,154 0.04% Native Hawaiian and Other
2,147,943 73.1% White alone 381,746 13.0% Hispanic 147,666 5.0% Black alone 145,362 4.9% Two or more races 85,085 2.9% Asian alone 13,263 0.5% Other race alone 12,065 0.4% American Indian alone 4,020 0.1% Native Hawaiian and Other
Income and house value in Leawood Median household income in 2022 $166,681 White non-Hispanic householdersover $200,000 Black householders$160,363 Asian householders$117,161 Two or more races householders$141,932 Hispanic or Latino race householdersMedian 2022 house value $638,458 White Non-Hispanic householders$618,935 Black or African American householders$151,073 American Indian or Alaska Native householders $810,914 Asian householders$559,900 Some other race householders$530,150 Two or more races householders$485,990 Hispanic or Latino householders
Median age by race in Leawood
52.0 Median age for White residents51.3 52.3 26.3 Median age for Black or African American residents40.8 25.8 -663,316,582.3 Median age for American Indian / Alaska Native residents-657,836,643.9 -627,147,765.7 42.0 Median age for Asian residents44.9 38.7 -1,068,376,067.3 Median age for Native Hawaiian / Pacific Islander residents-669,240,668.6 -641,269,840.6 36.7 Median age for Other race residents64.8 34.5 23.4 Median age for Two or more races residents20.1 36.8 52.0 Median age for White alone residents51.7 52.5 27.4 Median age for Hispanic or Latino residents26.2 29.2
Owner/renter occupied households by race in Leawood
House owners and renters - White residents 11,207 90.9% Owner occupied1,116 9.1% Renter occupiedHouse owners and renters - Black or African American residents 71 56.4% Owner occupied55 43.6% Renter occupiedHouse owners and renters - Asian residents 712 99.0% Owner occupied7 1.0% Renter occupiedHouse owners and renters - Other race residents 24 54.6% Owner occupied20 45.4% Renter occupiedHouse owners and renters - Two or more races residents 200 80.5% Owner occupied48 19.5% Renter occupiedHouse owners and renters - White alone residents 11,156 91.0% Owner occupied1,104 9.0% Renter occupiedHouse owners and renters - Hispanic or Latino residents 223 77.8% Owner occupied64 22.2% Renter occupied
Language usage in Leawood
English speakers - Total 94.2% of residents of Leawood speak English at home.
0.9% of residents speak Spanish at home 253 84.6% Speak English very well46 15.4% Speak English less than very well5.4% of residents speak other language at home 1,311 74.7% Speak English very well443 25.3% Speak English less than very well
English speakers - Born in the United States 98.8% of residents of Leawood speak English at home.
0.3% of residents speak Spanish at home 60 100.0% Speak English very well1.1% of residents speak other language at home 216 95.2% Speak English very well11 4.8% Speak English less than very well
English speakers - Native, born elsewhere 93.6% of residents of Leawood speak English at home.
5.6% of residents speak Spanish at home 13 100.0% Speak English very well1.7% of residents speak other language at home 4 100.0% Speak English less than very well
English speakers - Foreign-born 17.1% of residents of Leawood speak English at home.
9.8% of residents speak Spanish at home 162 84.8% Speak English very well29 15.2% Speak English less than very well71.8% of residents speak other language at home 984 70.4% Speak English very well414 29.6% Speak English less than very well
White (Caucasian) - Speak only English Native:
99.7% (28,059)Foreign-born:
50.3% (195)
White (Caucasian) - Speak another language Native:
0.8% (223)Foreign-born:
54.2% (210)
Asian - Speak only English Native:
94.3% (712)Foreign-born:
7.0% (85)
Asian - Speak another language Native:
17.0% (129)Foreign-born:
93.5% (1,136)
Other race - Speak another language Native:
1.4% (1)Foreign-born:
86.9% (22)
Two or more races - Speak only English Native:
93.3% (915)Foreign-born:
17.1% (42)
Two or more races - Speak another language Native:
5.8% (57)Foreign-born:
81.9% (203)
White alone - Speak only English Native:
99.1% (27,662)Foreign-born:
39.8% (196)
White alone - Speak another language Native:
1.0% (266)Foreign-born:
60.1% (295)
Hispanic or Latino - Speak only English Native:
100.0% (876)Foreign-born:
25.7% (43)
Hispanic or Latino - Speak another language Native:
5.1% (45)Foreign-born:
79.1% (133)
Foreign-born residents in Leawood 2,028 residents are foreign born (4.1% Asia , 1.3% Europe ).
This city:
5.9%Kansas:
7.1%
Marital status for residents in Leawood Marital status - White (Caucasian) population 15 years and over
Males 20.5% Never married73.1% Now married0.0% Separated1.7% Widowed4.7% DivorcedFemales 15.1% Never married70.0% Now married0.2% Separated5.3% Widowed9.4% DivorcedWomen who gave birth in the past 12 months Now married:
100.0% (269)Unmarried:
0.0% (0)
Women who did not give birth in the past 12 months Now married:
60.5% (2,606)Unmarried:
39.5% (1,701)
Marital status - Black or African American population 15 years and over
Males 46.0% Never married54.0% Now married0.0% Separated0.0% Widowed0.0% DivorcedFemales 34.8% Never married41.3% Now married0.0% Separated0.0% Widowed23.9% DivorcedWomen who gave birth in the past 12 months Now married:
100.0% (15)Unmarried:
0.0% (0)
Women who did not give birth in the past 12 months Now married:
0.0% (0)Unmarried:
100.0% (47)
Marital status - American Indian / Alaska Native population 15 years and over
Males 0.0% Never married100.0% Now married0.0% Separated0.0% Widowed0.0% DivorcedFemales 100.0% Never married0.0% Now married0.0% Separated0.0% Widowed0.0% DivorcedWomen who did not give birth in the past 12 months Now married:
0.0% (0)Unmarried:
100.0% (3)
Marital status - Asian population 15 years and over
Males 16.8% Never married62.8% Now married0.0% Separated0.0% Widowed20.5% DivorcedFemales 18.4% Never married75.7% Now married0.0% Separated1.4% Widowed4.4% DivorcedWomen who gave birth in the past 12 months Now married:
100.0% (5)Unmarried:
0.0% (0)
Women who did not give birth in the past 12 months Now married:
69.9% (332)Unmarried:
30.1% (143)
Marital status - Other race population 15 years and over
Males 0.0% Never married100.0% Now married0.0% Separated0.0% Widowed0.0% DivorcedFemales 0.0% Never married95.7% Now married0.0% Separated0.0% Widowed4.3% DivorcedWomen who did not give birth in the past 12 months Now married:
95.5% (31)Unmarried:
4.5% (1)
Marital status - Two or more races population 15 years and over
Males 52.8% Never married47.2% Now married0.0% Separated0.0% Widowed0.0% DivorcedFemales 31.3% Never married66.0% Now married0.0% Separated0.0% Widowed2.6% DivorcedWomen who gave birth in the past 12 months Now married:
100.0% (75)Unmarried:
0.0% (0)
Women who did not give birth in the past 12 months Now married:
47.6% (140)Unmarried:
52.4% (153)
Marital status - White alone, not Hispanic / Latino population 15 years and over
Males 20.1% Never married73.4% Now married0.0% Separated1.7% Widowed4.8% DivorcedFemales 14.4% Never married70.6% Now married0.2% Separated5.4% Widowed9.4% DivorcedWomen who gave birth in the past 12 months Now married:
100.0% (276)Unmarried:
0.0% (0)
Women who did not give birth in the past 12 months Now married:
61.5% (2,597)Unmarried:
38.5% (1,623)
Marital status - Hispanic or Latino population 15 years and over
Males 39.1% Never married59.0% Now married0.0% Separated0.0% Widowed1.9% DivorcedFemales 38.2% Never married58.7% Now married0.0% Separated0.0% Widowed3.1% DivorcedWomen who gave birth in the past 12 months Now married:
100.0% (64)Unmarried:
0.0% (0)
Women who did not give birth in the past 12 months Now married:
38.5% (129)Unmarried:
61.5% (207)
Ancestries in Leawood
2,418 16.5% German1,822 12.4% English1,810 12.3% American1,671 11.4% Irish911 6.2% European716 4.9% Italian251 1.7% Polish222 1.5% Scottish209 1.4% Lebanese205 1.4% Russian199 1.4% Hungarian170 1.2% British108 0.7% Swedish96 0.7% Scotch-Irish94 0.6% Ukrainian92 0.6% Norwegian76 0.5% Romanian67 0.5% French67 0.5% Slovene56 0.4% Danish56 0.4% Slovak47 0.3% Northern European42 0.3% Czech40 0.3% French Canadian36 0.2% Luxembourger34 0.2% Belgian34 0.2% Guyanese33 0.2% Eastern European32 0.2% Dutch31 0.2% Estonian31 0.2% Iranian30 0.2% Scandinavian23 0.2% Iraqi21 0.1% Turkish20 0.1% Lithuanian19 0.1% Israeli19 0.1% Austrian18 0.1% Welsh17 0.1% Latvian16 0.1% Serbian11 0.07% Croatian6 0.04% Bulgarian5 0.03% Brazilian4 0.03% Greek3 0.02% Nigerian
Geographical mobility in Leawood Same house 1 year ago 26,312 89.3% White (Caucasian)280 88.0% Black or African American4 49.8% American Indian / Alaska Native1,787 87.1% Asian80 88.3% Other race1,239 93.2% Two or more races26,292 89.3% White alone, not Hispanic / Latino1,019 89.9% Hispanic or LatinoMoved within same county 1,322 4.5% White / Caucasian3 36.4% American Indian / Alaska Native115 5.6% Asian30 2.2% Two or more races1,347 4.6% White alone, not Hispanic / LatinoMoved within same state 314 1.1% White / Caucasian312 1.1% White alone, not Hispanic / LatinoMoved from different state 1,620 5.5% White / Caucasian59 18.6% Black or African American103 5.0% Asian56 4.2% Two or more races1,580 5.4% White alone, not Hispanic / Latino79 7.0% Hispanic or LatinoMoved from abroad 14 0.0% White29 1.4% Asian8 8.6% Other race15 0.1% White alone, not Hispanic / Latino11 1.0% Hispanic or Latino
Children Nativity (place of birth) in Leawood
Children under 6 years - Living with two parents Both parents native 1,743 100.0% NativeBoth parents foreign-born 149 100.0% NativeOne native, one foreign-born parent 61 100.0% NativeChildren under 6 years - Living with one parent Native parent 17 100.0% NativeChildren 6 to 17 years - Living with two parents Both parents native 4,242 100.0% NativeBoth parents foreign-born 271 98.8% Native3 1.2% Foreign-bornOne native, one foreign-born parent 105 74.5% Native36 25.5% Foreign-bornChildren 6 to 17 years - Living with one parent Native parent 438 100.0% NativeForeign-born parent 146 55.0% Native120 45.0% Foreign-born
Grandparents responsible for own grandchildren in Leawood
Grandparents (30 to 59 years) White / Caucasian 78 100.0% Not responsible for grandchildrenBlack or African American 17 51.4% Responsible for grandchildren16 48.6% Not responsible for grandchildrenAsian 15 100.0% Not responsible for grandchildrenWhite alone, not Hispanic / Latino 87 100.0% Not responsible for grandchildrenGrandparents (60 years and over) White / Caucasian 129 62.1% Responsible for grandchildren79 37.9% Not responsible for grandchildrenWhite alone, not Hispanic / Latino 129 60.3% Responsible for grandchildren85 39.7% Not responsible for grandchildren