Races in Laurel, Maryland (MD) Detailed Stats
Data:
Races - White alone (%)
Races - White alone (% change since 2000)
Races - Black alone (%)
Races - Black alone (% change since 2000)
Races - American Indian alone (%)
Races - American Indian alone (% change since 2000)
Races - Asian alone (%)
Races - Asian alone (% change since 2000)
Races - Hispanic (%)
Races - Hispanic (% change since 2000)
Races - Native Hawaiian and Other Pacific Islander alone (%)
Races - Native Hawaiian and Other Pacific Islander alone (% change since 2000)
Races - Two or more races(%)
Races - Two or more races(% change since 2000)
Races - Other race alone (%)
Races - Other race alone (% change since 2000)
Racial diversity
Place of birth - Born in state of residence (%)
Place of birth - Born in state of residence (%) - White
Place of birth - Born in state of residence (%) - Black or African American
Place of birth - Born in state of residence (%) - Asian
Place of birth - Born in state of residence (%) - Hispanic or Latino
Place of birth - Born in state of residence (%) - American Indian and Alaska Native
Place of birth - Born in state of residence (%) - Multirace
Place of birth - Born in state of residence (%) - Other Race
Place of birth - Born in other state (%)
Place of birth - Born in other state (%) - White
Place of birth - Born in other state (%) - Black or African American
Place of birth - Born in other state (%) - Asian
Place of birth - Born in other state (%) - Hispanic or Latino
Place of birth - Born in other state (%) - American Indian and Alaska Native
Place of birth - Born in other state (%) - Multirace
Place of birth - Born in other state (%) - Other Race
Place of birth - Native, outside of US (%)
Place of birth - Native, outside of US (%) - White
Place of birth - Native, outside of US (%) - Black or African American
Place of birth - Native, outside of US (%) - Asian
Place of birth - Native, outside of US (%) - Hispanic or Latino
Place of birth - Native, outside of US (%) - American Indian and Alaska Native
Place of birth - Native, outside of US (%) - Multirace
Place of birth - Native, outside of US (%) - Other Race
Place of birth - Foreign born (%)
Place of birth - Foreign born (%) - White
Place of birth - Foreign born (%) - Black or African American
Place of birth - Foreign born (%) - Asian
Place of birth - Foreign born (%) - Hispanic or Latino
Place of birth - Foreign born (%) - American Indian and Alaska Native
Place of birth - Foreign born (%) - Multirace
Place of birth - Foreign born (%) - Other Race
Residents speaking English at home (%)
Residents speaking English at home - Born in the United States (%)
Residents speaking English at home - Native, born elsewhere (%)
Residents speaking English at home - Foreign born (%)
Residents speaking Spanish at home (%)
Residents speaking Spanish at home - Born in the United States (%)
Residents speaking Spanish at home - Native, born elsewhere (%)
Residents speaking Spanish at home - Foreign born (%)
Residents speaking other language at home (%)
Residents speaking other language at home - Born in the United States (%)
Residents speaking other language at home - Native, born elsewhere (%)
Residents speaking other language at home - Foreign born (%)
Marital status - Never married (%)
Marital status - Now married (%)
Marital status - Separated (%)
Marital status - Widowed (%)
Marital status - Divorced (%)
Ancestries Reported - Arab (%)
Ancestries Reported - Czech (%)
Ancestries Reported - Danish (%)
Ancestries Reported - Dutch (%)
Ancestries Reported - English (%)
Ancestries Reported - French (%)
Ancestries Reported - French Canadian (%)
Ancestries Reported - German (%)
Ancestries Reported - Greek (%)
Ancestries Reported - Hungarian (%)
Ancestries Reported - Irish (%)
Ancestries Reported - Italian (%)
Ancestries Reported - Lithuanian (%)
Ancestries Reported - Norwegian (%)
Ancestries Reported - Polish (%)
Ancestries Reported - Portuguese (%)
Ancestries Reported - Russian (%)
Ancestries Reported - Scotch-Irish (%)
Ancestries Reported - Scottish (%)
Ancestries Reported - Slovak (%)
Ancestries Reported - Subsaharan African (%)
Ancestries Reported - Swedish (%)
Ancestries Reported - Swiss (%)
Ancestries Reported - Ukrainian (%)
Ancestries Reported - United States (%)
Ancestries Reported - Welsh (%)
Ancestries Reported - West Indian (%)
Ancestries Reported - Other (%)
Geographical mobility - Same house 1 year ago (%)
Geographical mobility - Same house 1 year ago (%) - White
Geographical mobility - Same house 1 year ago (%) - Black or African American
Geographical mobility - Same house 1 year ago (%) - Asian
Geographical mobility - Same house 1 year ago (%) - Hispanic or Latino
Geographical mobility - Same house 1 year ago (%) - American Indian and Alaska Native
Geographical mobility - Same house 1 year ago (%) - Multirace
Geographical mobility - Same house 1 year ago (%) - Other Race
Geographical mobility - Moved within same county (%)
Geographical mobility - Moved within same county (%) - White
Geographical mobility - Moved within same county (%) - Black or African American
Geographical mobility - Moved within same county (%) - Asian
Geographical mobility - Moved within same county (%) - Hispanic or Latino
Geographical mobility - Moved within same county (%) - American Indian and Alaska Native
Geographical mobility - Moved within same county (%) - Multirace
Geographical mobility - Moved within same county (%) - Other Race
Geographical mobility - Moved from different county within same state (%)
Geographical mobility - Moved from different county within same state (%) - White
Geographical mobility - Moved from different county within same state (%) - Black or African American
Geographical mobility - Moved from different county within same state (%) - Asian
Geographical mobility - Moved from different county within same state (%) - Hispanic or Latino
Geographical mobility - Moved from different county within same state (%) - American Indian and Alaska Native
Geographical mobility - Moved from different county within same state (%) - Multirace
Geographical mobility - Moved from different county within same state (%) - Other Race
Geographical mobility - Moved from different state (%)
Geographical mobility - Moved from different state (%) - White
Geographical mobility - Moved from different state (%) - Black or African American
Geographical mobility - Moved from different state (%) - Asian
Geographical mobility - Moved from different state (%) - Hispanic or Latino
Geographical mobility - Moved from different state (%) - American Indian and Alaska Native
Geographical mobility - Moved from different state (%) - Multirace
Geographical mobility - Moved from different state (%) - Other Race
Geographical mobility - Moved from abroad (%)
Geographical mobility - Moved from abroad (%) - White
Geographical mobility - Moved from abroad (%) - Black or African American
Geographical mobility - Moved from abroad (%) - Asian
Geographical mobility - Moved from abroad (%) - Hispanic or Latino
Geographical mobility - Moved from abroad (%) - American Indian and Alaska Native
Geographical mobility - Moved from abroad (%) - Multirace
Geographical mobility - Moved from abroad (%) - Other Race
Place of birth for the foreign-born population - Ireland (%)
Place of birth for the foreign-born population - Denmark (%)
Place of birth for the foreign-born population - Norway (%)
Place of birth for the foreign-born population - Sweden (%)
Place of birth for the foreign-born population - United Kingdom (%)
Place of birth for the foreign-born population - England (%)
Place of birth for the foreign-born population - Scotland (%)
Place of birth for the foreign-born population - Other Northern Europe (%)
Place of birth for the foreign-born population - Austria (%)
Place of birth for the foreign-born population - Belgium (%)
Place of birth for the foreign-born population - France (%)
Place of birth for the foreign-born population - Germany (%)
Place of birth for the foreign-born population - Netherlands (%)
Place of birth for the foreign-born population - Switzerland (%)
Place of birth for the foreign-born population - Other Western Europe (%)
Place of birth for the foreign-born population - Greece (%)
Place of birth for the foreign-born population - Italy (%)
Place of birth for the foreign-born population - Portugal (%)
Place of birth for the foreign-born population - Spain (%)
Place of birth for the foreign-born population - Other Southern Europe (%)
Place of birth for the foreign-born population - Albania (%)
Place of birth for the foreign-born population - Belarus (%)
Place of birth for the foreign-born population - Bosnia and Herzegovina (%)
Place of birth for the foreign-born population - Bulgaria (%)
Place of birth for the foreign-born population - Croatia (%)
Place of birth for the foreign-born population - Czechoslovakia (%)
Place of birth for the foreign-born population - Hungary (%)
Place of birth for the foreign-born population - Latvia (%)
Place of birth for the foreign-born population - Lithuania (%)
Place of birth for the foreign-born population - North Macedonia (Macedonia) (%)
Place of birth for the foreign-born population - Moldova (%)
Place of birth for the foreign-born population - Poland (%)
Place of birth for the foreign-born population - Romania (%)
Place of birth for the foreign-born population - Russia (%)
Place of birth for the foreign-born population - Serbia (%)
Place of birth for the foreign-born population - Ukraine (%)
Place of birth for the foreign-born population - Other Eastern Europe (%)
Place of birth for the foreign-born population - China (%)
Place of birth for the foreign-born population - Hong Kong (%)
Place of birth for the foreign-born population - Taiwan (%)
Place of birth for the foreign-born population - Japan (%)
Place of birth for the foreign-born population - Korea (%)
Place of birth for the foreign-born population - Other Eastern Asia (%)
Place of birth for the foreign-born population - Afghanistan (%)
Place of birth for the foreign-born population - Bangladesh (%)
Place of birth for the foreign-born population - India (%)
Place of birth for the foreign-born population - Iran (%)
Place of birth for the foreign-born population - Kazakhstan (%)
Place of birth for the foreign-born population - Nepal (%)
Place of birth for the foreign-born population - Pakistan (%)
Place of birth for the foreign-born population - Sri Lanka (%)
Place of birth for the foreign-born population - Uzbekistan (%)
Place of birth for the foreign-born population - Other South Central Asia (%)
Place of birth for the foreign-born population - Burma (%)
Place of birth for the foreign-born population - Cambodia (%)
Place of birth for the foreign-born population - Indonesia (%)
Place of birth for the foreign-born population - Laos (%)
Place of birth for the foreign-born population - Malaysia (%)
Place of birth for the foreign-born population - Philippines (%)
Place of birth for the foreign-born population - Singapore (%)
Place of birth for the foreign-born population - Thailand (%)
Place of birth for the foreign-born population - Vietnam (%)
Place of birth for the foreign-born population - Other South Eastern Asia (%)
Place of birth for the foreign-born population - Armenia (%)
Place of birth for the foreign-born population - Iraq (%)
Place of birth for the foreign-born population - Israel (%)
Place of birth for the foreign-born population - Jordan (%)
Place of birth for the foreign-born population - Kuwait (%)
Place of birth for the foreign-born population - Lebanon (%)
Place of birth for the foreign-born population - Saudi Arabia (%)
Place of birth for the foreign-born population - Syria (%)
Place of birth for the foreign-born population - Turkey (%)
Place of birth for the foreign-born population - Yemen (%)
Place of birth for the foreign-born population - Other Western Asia (%)
Place of birth for the foreign-born population - Eritrea (%)
Place of birth for the foreign-born population - Ethiopia (%)
Place of birth for the foreign-born population - Kenya (%)
Place of birth for the foreign-born population - Somalia (%)
Place of birth for the foreign-born population - Uganda (%)
Place of birth for the foreign-born population - Zimbabwe (%)
Place of birth for the foreign-born population - Other Eastern Africa (%)
Place of birth for the foreign-born population - Cameroon (%)
Place of birth for the foreign-born population - Congo (%)
Place of birth for the foreign-born population - Democratic Republic of Congo (Zaire) (%)
Place of birth for the foreign-born population - Other Middle Africa (%)
Place of birth for the foreign-born population - Egypt (%)
Place of birth for the foreign-born population - Morocco (%)
Place of birth for the foreign-born population - Sudan (%)
Place of birth for the foreign-born population - Other Northern Africa (%)
Place of birth for the foreign-born population - South Africa (%)
Place of birth for the foreign-born population - Other Southern Africa (%)
Place of birth for the foreign-born population - Cabo Verde (%)
Place of birth for the foreign-born population - Ghana (%)
Place of birth for the foreign-born population - Liberia (%)
Place of birth for the foreign-born population - Nigeria (%)
Place of birth for the foreign-born population - Senegal (%)
Place of birth for the foreign-born population - Sierra Leone (%)
Place of birth for the foreign-born population - Other Western Africa (%)
Place of birth for the foreign-born population - Australia (%)
Place of birth for the foreign-born population - New Zealand (%)
Place of birth for the foreign-born population - Fiji (%)
Place of birth for the foreign-born population - Micronesia (%)
Place of birth for the foreign-born population - Bahamas (%)
Place of birth for the foreign-born population - Barbados (%)
Place of birth for the foreign-born population - Cuba (%)
Place of birth for the foreign-born population - Dominica (%)
Place of birth for the foreign-born population - Dominican Republic (%)
Place of birth for the foreign-born population - Grenada (%)
Place of birth for the foreign-born population - Haiti (%)
Place of birth for the foreign-born population - Jamaica (%)
Place of birth for the foreign-born population - St. Vincent and the Grenadines (%)
Place of birth for the foreign-born population - Trinidad and Tobago (%)
Place of birth for the foreign-born population - West Indies (%)
Place of birth for the foreign-born population - Other Caribbean (%)
Place of birth for the foreign-born population - Belize (%)
Place of birth for the foreign-born population - Costa Rica (%)
Place of birth for the foreign-born population - El Salvador (%)
Place of birth for the foreign-born population - Guatemala (%)
Place of birth for the foreign-born population - Honduras (%)
Place of birth for the foreign-born population - Mexico (%)
Place of birth for the foreign-born population - Nicaragua (%)
Place of birth for the foreign-born population - Panama (%)
Place of birth for the foreign-born population - Other Central America (%)
Place of birth for the foreign-born population - Argentina (%)
Place of birth for the foreign-born population - Bolivia (%)
Place of birth for the foreign-born population - Brazil (%)
Place of birth for the foreign-born population - Chile (%)
Place of birth for the foreign-born population - Colombia (%)
Place of birth for the foreign-born population - Ecuador (%)
Place of birth for the foreign-born population - Guyana (%)
Place of birth for the foreign-born population - Peru (%)
Place of birth for the foreign-born population - Uruguay (%)
Place of birth for the foreign-born population - Venezuela (%)
Place of birth for the foreign-born population - Other South America (%)
Place of birth for the foreign-born population - Canada (%)
Place of birth for the foreign-born population - Other Northern America (%)
Place of birth for the foreign-born population - Other (%)
Latest news about races in Laurel, MD collected exclusively by city-data.com from local newspapers, TV, and radio stations
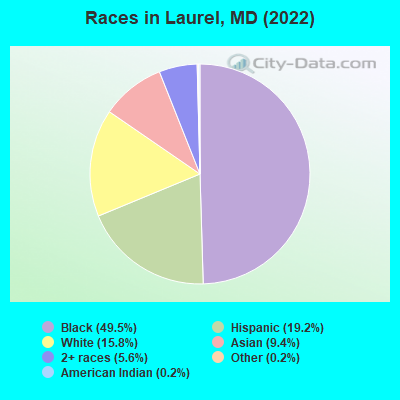
According to 2022 data, the most numerous races in Laurel, MD are White alone (4,619 residents), Black alone (14,487 residents), and Hispanic (5,613 residents). 64.6% of Laurel residents speak English at home. 31.2% of Laurel, MD residents are foreign-born (14.1% born in Latin America, 8.4% born in Africa, 6.0% born in Asia), which is 48.7% greater than the foreign-born rate of 16.0% across the entire state of Maryland.
Race distribution in Laurel
2000 2022
3,286,547 62.1% White alone 1,464,735 27.7% Black alone 227,916 4.3% Hispanic 209,738 4.0% Asian alone 82,946 1.6% Two or more races 13,312 0.3% American Indian alone 9,379 0.2% Other race alone 1,913 0.04% Native Hawaiian and Other
2,906,492 47.1% White alone 1,800,914 29.2% Black alone 705,842 11.4% Hispanic 401,818 6.5% Asian alone 291,317 4.7% Two or more races 46,930 0.8% Other race alone 8,930 0.1% American Indian alone 2,417 0.04% Native Hawaiian and Other
Income and house value in Laurel Median household income in 2022 $90,476 White non-Hispanic householders$92,639 Black householders$89,770 Asian householders$53,971 Some other race householders$87,135 Two or more races householders$70,833 Hispanic or Latino race householdersMedian 2022 house value $400,127 White Non-Hispanic householders$381,996 Black or African American householders $445,766 Asian householders$351,674 Native Hawaiian and other Pacific Islander householders$426,698 Some other race householders$427,635 Two or more races householders$404,190 Hispanic or Latino householders
Median age by race in Laurel
41.5 Median age for White residents40.6 42.1 37.5 Median age for Black or African American residents39.3 36.1 49.0 Median age for American Indian / Alaska Native residents24.1 -689,905,591.2 47.3 Median age for Asian residents45.5 43.7 -571,600,480.8 Median age for Native Hawaiian / Pacific Islander residents-720,061,021.4 -760,942,760.2 32.4 Median age for Other race residents34.9 26.5 21.9 Median age for Two or more races residents15.9 27.5 43.1 Median age for White alone residents42.2 44.3 28.5 Median age for Hispanic or Latino residents32.9 26.3
Owner/renter occupied households by race in Laurel
House owners and renters - White residents 1,361 49.6% Owner occupied1,383 50.4% Renter occupiedHouse owners and renters - Black or African American residents 2,457 39.4% Owner occupied3,785 60.6% Renter occupiedHouse owners and renters - American Indian / Alaska Native residents 133 100.0% Owner occupiedHouse owners and renters - Asian residents 598 67.1% Owner occupied293 32.9% Renter occupiedHouse owners and renters - Other race residents 329 33.7% Owner occupied647 66.3% Renter occupiedHouse owners and renters - Two or more races residents 281 38.1% Owner occupied457 61.9% Renter occupiedHouse owners and renters - White alone residents 1,299 50.8% Owner occupied1,257 49.2% Renter occupiedHouse owners and renters - Hispanic or Latino residents 606 37.0% Owner occupied1,031 63.0% Renter occupied
Language usage in Laurel
English speakers - Total 64.6% of residents of Laurel speak English at home.
16.7% of residents speak Spanish at home 2,177 47.8% Speak English very well2,377 52.2% Speak English less than very well19.7% of residents speak other language at home 4,049 75.5% Speak English very well1,315 24.5% Speak English less than very well
English speakers - Born in the United States 91.5% of residents of Laurel speak English at home.
4.4% of residents speak Spanish at home 409 97.1% Speak English very well12 2.9% Speak English less than very well4.4% of residents speak other language at home 389 93.5% Speak English very well27 6.5% Speak English less than very well
English speakers - Native, born elsewhere 76.9% of residents of Laurel speak English at home.
1.8% of residents speak Spanish at home 9 100.0% Speak English very well28.6% of residents speak other language at home 13 9.3% Speak English very well127 90.7% Speak English less than very well
English speakers - Foreign-born 21.6% of residents of Laurel speak English at home.
31.2% of residents speak Spanish at home 911 31.6% Speak English very well1,972 68.4% Speak English less than very well48.0% of residents speak other language at home 3,267 73.6% Speak English very well1,171 26.4% Speak English less than very well
White (Caucasian) - Speak only English Native:
88.6% (4,112)Foreign-born:
7.7% (31)
White (Caucasian) - Speak another language Native:
11.2% (519)Foreign-born:
85.9% (344)
Black or African American - Speak only English Native:
94.5% (9,443)Foreign-born:
38.0% (1,611)
Black or African American - Speak another language Native:
5.7% (573)Foreign-born:
62.0% (2,630)
American Indian / Alaska Native - Speak another language Native:
74.2% (153)Foreign-born:
99.9% (101)
Asian - Speak only English Native:
52.4% (453)Foreign-born:
10.9% (188)
Asian - Speak another language Native:
40.4% (349)Foreign-born:
88.5% (1,533)
Other race - Speak only English Native:
19.1% (155)Foreign-born:
3.7% (76)
Other race - Speak another language Native:
81.3% (658)Foreign-born:
96.1% (1,944)
Two or more races - Speak only English Native:
81.0% (1,545)Foreign-born:
15.3% (99)
Two or more races - Speak another language Native:
18.7% (356)Foreign-born:
86.1% (556)
White alone - Speak only English Native:
91.3% (3,919)Foreign-born:
7.8% (13)
White alone - Speak another language Native:
9.4% (403)Foreign-born:
90.9% (154)
Hispanic or Latino - Speak only English Native:
34.4% (679)Foreign-born:
4.8% (142)
Hispanic or Latino - Speak another language Native:
66.6% (1,315)Foreign-born:
95.0% (2,823)
Foreign-born residents in Laurel 9,132 residents are foreign born (14.1% Latin America , 8.4% Africa , 6.0% Asia ).
This city:
31.2%Maryland:
15.7%
Marital status for residents in Laurel Marital status - White (Caucasian) population 15 years and over
Males 39.3% Never married46.7% Now married5.8% Separated1.8% Widowed6.4% DivorcedFemales 36.6% Never married39.7% Now married5.0% Separated7.2% Widowed11.4% DivorcedWomen who gave birth in the past 12 months Now married:
100.0% (21)Unmarried:
0.0% (0)
Women who did not give birth in the past 12 months Now married:
41.4% (528)Unmarried:
58.6% (747)
Marital status - Black or African American population 15 years and over
Males 43.5% Never married41.5% Now married1.6% Separated1.7% Widowed11.7% DivorcedFemales 48.0% Never married29.4% Now married3.8% Separated5.7% Widowed13.1% DivorcedWomen who gave birth in the past 12 months Now married:
82.5% (248)Unmarried:
17.5% (53)
Women who did not give birth in the past 12 months Now married:
30.3% (1,263)Unmarried:
69.7% (2,909)
Marital status - American Indian / Alaska Native population 15 years and over
Males 67.9% Never married32.1% Now married0.0% Separated0.0% Widowed0.0% DivorcedFemales 0.0% Never married100.0% Now married0.0% Separated0.0% Widowed0.0% DivorcedWomen who did not give birth in the past 12 months Now married:
100.0% (30)Unmarried:
0.0% (0)
Marital status - Asian population 15 years and over
Males 24.3% Never married73.9% Now married0.0% Separated0.0% Widowed1.8% DivorcedFemales 19.2% Never married50.2% Now married0.7% Separated3.1% Widowed26.8% DivorcedWomen who did not give birth in the past 12 months Now married:
34.7% (212)Unmarried:
65.3% (399)
Marital status - Other race population 15 years and over
Males 23.3% Never married64.0% Now married6.7% Separated0.0% Widowed6.0% DivorcedFemales 28.0% Never married61.7% Now married3.3% Separated3.1% Widowed3.9% DivorcedWomen who gave birth in the past 12 months Now married:
100.0% (38)Unmarried:
0.0% (0)
Women who did not give birth in the past 12 months Now married:
59.7% (435)Unmarried:
40.3% (294)
Marital status - Two or more races population 15 years and over
Males 74.9% Never married21.4% Now married0.0% Separated0.0% Widowed3.7% DivorcedFemales 56.8% Never married23.6% Now married4.9% Separated6.5% Widowed8.2% DivorcedWomen who gave birth in the past 12 months Now married:
62.2% (97)Unmarried:
37.8% (59)
Women who did not give birth in the past 12 months Now married:
16.5% (89)Unmarried:
83.5% (450)
Marital status - White alone, not Hispanic / Latino population 15 years and over
Males 41.4% Never married45.3% Now married6.4% Separated2.1% Widowed4.9% DivorcedFemales 38.5% Never married36.9% Now married6.0% Separated8.2% Widowed10.5% DivorcedWomen who gave birth in the past 12 months Now married:
100.0% (12)Unmarried:
0.0% (0)
Women who did not give birth in the past 12 months Now married:
39.5% (420)Unmarried:
60.5% (644)
Marital status - Hispanic or Latino population 15 years and over
Males 34.1% Never married54.4% Now married4.6% Separated0.0% Widowed6.9% DivorcedFemales 34.3% Never married49.4% Now married4.0% Separated2.2% Widowed10.2% DivorcedWomen who gave birth in the past 12 months Now married:
100.0% (46)Unmarried:
0.0% (0)
Women who did not give birth in the past 12 months Now married:
47.9% (662)Unmarried:
52.1% (721)
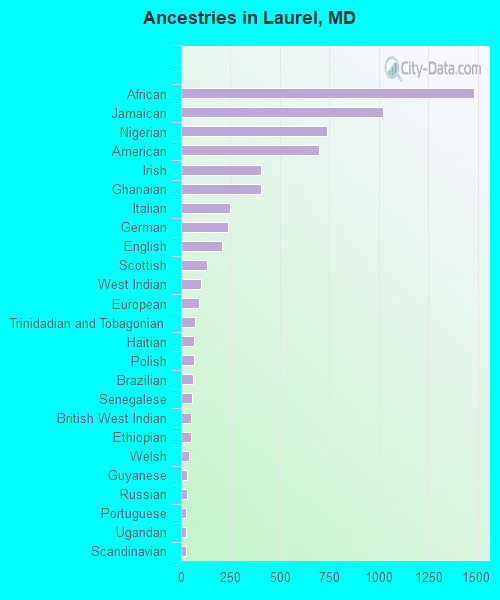
Ancestries in Laurel
1,482 7.7% African1,023 5.3% Jamaican737 3.8% Nigerian699 3.6% American405 2.1% Irish402 2.1% Ghanaian248 1.3% Italian238 1.2% German208 1.1% English132 0.7% Scottish99 0.5% West Indian89 0.5% European69 0.4% Trinidadian and Tobagonian68 0.4% Haitian65 0.3% Polish61 0.3% Brazilian54 0.3% Senegalese53 0.3% British West Indian51 0.3% Ethiopian41 0.2% Welsh31 0.2% Guyanese28 0.1% Russian27 0.1% Portuguese24 0.1% Ugandan23 0.1% Scandinavian23 0.1% Greek22 0.1% Syrian18 0.09% Scotch-Irish16 0.08% Canadian15 0.08% Turkish12 0.06% Norwegian7 0.04% British7 0.04% Barbadian5 0.03% Jordanian4 0.02% Dutch4 0.02% Swiss3 0.02% Cajun3 0.02% French1 0.01% Kenyan
Geographical mobility in Laurel Same house 1 year ago 4,440 85.0% White (Caucasian)11,671 80.1% Black or African American283 98.9% American Indian / Alaska Native2,535 91.2% Asian2,742 84.8% Other race2,326 82.1% Two or more races4,069 88.0% White alone, not Hispanic / Latino4,521 81.7% Hispanic or LatinoMoved within same county 352 6.7% White / Caucasian1,461 10.0% Black or African American166 6.0% Asian90 2.8% Other race231 8.2% Two or more races239 5.2% White alone, not Hispanic / Latino280 5.1% Hispanic or LatinoMoved within same state 202 3.9% White / Caucasian870 6.0% Black or African American13 0.5% Asian170 5.3% Other race327 11.5% Two or more races186 4.0% White alone, not Hispanic / Latino387 7.0% Hispanic or LatinoMoved from different state 180 3.4% White / Caucasian103 0.7% Black or African American59 2.1% Asian135 4.2% Other race6 0.2% Two or more races118 2.6% White alone, not Hispanic / Latino224 4.1% Hispanic or LatinoMoved from abroad 34 0.7% White310 2.1% Black or African American1 0.0% Asian66 2.0% Other race35 0.7% White alone, not Hispanic / Latino81 1.5% Hispanic or Latino
Children Nativity (place of birth) in Laurel
Children under 6 years - Living with two parents Both parents native 400 100.0% NativeBoth parents foreign-born 774 98.2% Native14 1.8% Foreign-bornOne native, one foreign-born parent 270 100.0% NativeChildren under 6 years - Living with one parent Native parent 424 100.0% NativeForeign-born parent 302 100.0% NativeChildren 6 to 17 years - Living with two parents Both parents native 436 100.0% Native0 0.0% Foreign-bornBoth parents foreign-born 1,434 97.9% Native31 2.1% Foreign-bornOne native, one foreign-born parent 326 100.0% NativeChildren 6 to 17 years - Living with one parent Native parent 1,086 100.0% NativeForeign-born parent 755 55.4% Native607 44.6% Foreign-born
Place of birth for residents in Laurel 4,480 Americas4,460 Latin America2,755 Central America2,645 Africa2,337 Western Africa1,902 Asia1,366 Caribbean783 Eastern Asia663 South Central Asia427 South Eastern Asia339 South America158 Middle Africa133 Eastern Africa92 Europe31 Northern Europe30 Eastern Europe27 Western Asia19 Southern Europe19 Northern America15 China11 Oceania11 Australia and New Zealand Subregion8 Northern Africa5 Western Europe1,628 El Salvador1,133 Nigeria1,041 Jamaica896 Ghana749 Korea507 Mexico479 India373 Guatemala297 Philippines185 Honduras183 Pakistan111 Sierra Leone109 Vietnam97 Cameroon93 Colombia86 Brazil82 Ivory Coast76 Trinidad and Tobago74 Dominican Republic65 Haiti61 Democratic Republic of Congo (Zaire)61 Guyana40 Ethiopia35 Peru34 Senegal34 Nicaragua29 Grenada28 Liberia26 Panama21 Bolivia21 Chile21 Russia19 Canada18 Japan15 Turkey15 China12 Sweden12 Denmark12 Spain12 Venezuela11 New Zealand10 Barbados10 Cambodia9 Israel9 Thailand9 Poland8 Sudan6 United Kingdom6 Italy6 Argentina5 Germany2 Jordan1 Kenya
Grandparents responsible for own grandchildren in Laurel
Grandparents (30 to 59 years) White / Caucasian 21 100.0% Not responsible for grandchildrenBlack or African American 79 100.0% Not responsible for grandchildrenOther race 6 100.0% Not responsible for grandchildrenWhite alone, not Hispanic / Latino 10 100.0% Not responsible for grandchildrenHispanic or Latino 18 100.0% Not responsible for grandchildrenGrandparents (60 years and over) White / Caucasian 46 100.0% Not responsible for grandchildrenBlack or African American 40 19.2% Responsible for grandchildren169 80.8% Not responsible for grandchildrenOther race 16 72.4% Responsible for grandchildren6 27.6% Not responsible for grandchildrenWhite alone, not Hispanic / Latino 49 100.0% Not responsible for grandchildrenHispanic or Latino 21 74.1% Responsible for grandchildren7 25.9% Not responsible for grandchildren