Races in Lathemtown, Georgia (GA) Detailed Stats
Ancestries, Foreign-born residents, place of birth
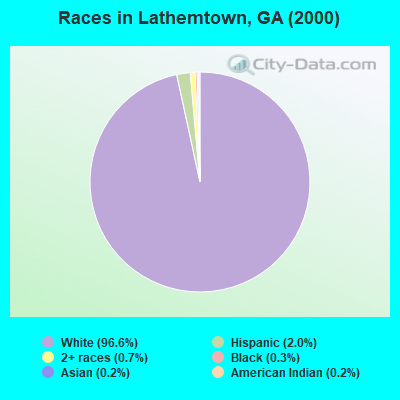
Race distribution in Lathemtown

- 8,94596.6%White alone
- 1872.0%Hispanic
- 610.7%Two or more races
- 270.3%Black alone
- 190.2%Asian alone
- 180.2%American Indian alone
- 30.03%Native Hawaiian and Other
Pacific Islander alone - 10.01%Other race alone
2000
2022
-
- 5,128,66162.6%White alone
- 2,331,46528.5%Black alone
- 435,2275.3%Hispanic
- 171,5132.1%Asian alone
- 87,3641.1%Two or more races
- 17,6700.2%American Indian alone
- 11,2750.1%Other race alone
- 3,2780.04%Native Hawaiian and Other
Pacific Islander alone

-
- 5,415,65749.6%White alone
- 3,349,24030.7%Black alone
- 1,132,60410.4%Hispanic
- 479,1564.4%Asian alone
- 462,9234.2%Two or more races
- 54,4160.5%Other race alone
- 11,9230.1%American Indian alone
- 6,9570.06%Native Hawaiian and Other
Pacific Islander alone

Income and house value in Lathemtown
- Median household income in 2022
- $91,711White non-Hispanic householders
- over $200,000Black householders
- over $200,000American Indian and Alaska Native householders
- $39,969Asian householders
- $182,973Some other race householders
- $97,848Two or more races householders
- $155,922Hispanic or Latino race householders
- Median 2022 house value
- $529,815White Non-Hispanic householders
- $446,046Black or African American householders
- $850,054American Indian or Alaska Native householders
- $291,182Asian householders
- $425,027Some other race householders
- $502,304Two or more races householders
- $798,432Hispanic or Latino householders
Household income for White non-Hispanic householders

Household income for Black householders

Household income for American Indian and Alaska Native householders

Household income for Asian householders

Household income for Two or more races householders

Household income for Hispanic or Latino race householders

Zip code: 30115