Races in Lansdowne, Pennsylvania (PA) Detailed Stats
Data:
Races - White alone (%)
Races - White alone (% change since 2000)
Races - Black alone (%)
Races - Black alone (% change since 2000)
Races - American Indian alone (%)
Races - American Indian alone (% change since 2000)
Races - Asian alone (%)
Races - Asian alone (% change since 2000)
Races - Hispanic (%)
Races - Hispanic (% change since 2000)
Races - Native Hawaiian and Other Pacific Islander alone (%)
Races - Native Hawaiian and Other Pacific Islander alone (% change since 2000)
Races - Two or more races(%)
Races - Two or more races(% change since 2000)
Races - Other race alone (%)
Races - Other race alone (% change since 2000)
Racial diversity
Place of birth - Born in state of residence (%)
Place of birth - Born in state of residence (%) - White
Place of birth - Born in state of residence (%) - Black or African American
Place of birth - Born in state of residence (%) - Asian
Place of birth - Born in state of residence (%) - Hispanic or Latino
Place of birth - Born in state of residence (%) - American Indian and Alaska Native
Place of birth - Born in state of residence (%) - Multirace
Place of birth - Born in state of residence (%) - Other Race
Place of birth - Born in other state (%)
Place of birth - Born in other state (%) - White
Place of birth - Born in other state (%) - Black or African American
Place of birth - Born in other state (%) - Asian
Place of birth - Born in other state (%) - Hispanic or Latino
Place of birth - Born in other state (%) - American Indian and Alaska Native
Place of birth - Born in other state (%) - Multirace
Place of birth - Born in other state (%) - Other Race
Place of birth - Native, outside of US (%)
Place of birth - Native, outside of US (%) - White
Place of birth - Native, outside of US (%) - Black or African American
Place of birth - Native, outside of US (%) - Asian
Place of birth - Native, outside of US (%) - Hispanic or Latino
Place of birth - Native, outside of US (%) - American Indian and Alaska Native
Place of birth - Native, outside of US (%) - Multirace
Place of birth - Native, outside of US (%) - Other Race
Place of birth - Foreign born (%)
Place of birth - Foreign born (%) - White
Place of birth - Foreign born (%) - Black or African American
Place of birth - Foreign born (%) - Asian
Place of birth - Foreign born (%) - Hispanic or Latino
Place of birth - Foreign born (%) - American Indian and Alaska Native
Place of birth - Foreign born (%) - Multirace
Place of birth - Foreign born (%) - Other Race
Residents speaking English at home (%)
Residents speaking English at home - Born in the United States (%)
Residents speaking English at home - Native, born elsewhere (%)
Residents speaking English at home - Foreign born (%)
Residents speaking Spanish at home (%)
Residents speaking Spanish at home - Born in the United States (%)
Residents speaking Spanish at home - Native, born elsewhere (%)
Residents speaking Spanish at home - Foreign born (%)
Residents speaking other language at home (%)
Residents speaking other language at home - Born in the United States (%)
Residents speaking other language at home - Native, born elsewhere (%)
Residents speaking other language at home - Foreign born (%)
Marital status - Never married (%)
Marital status - Now married (%)
Marital status - Separated (%)
Marital status - Widowed (%)
Marital status - Divorced (%)
Ancestries Reported - Arab (%)
Ancestries Reported - Czech (%)
Ancestries Reported - Danish (%)
Ancestries Reported - Dutch (%)
Ancestries Reported - English (%)
Ancestries Reported - French (%)
Ancestries Reported - French Canadian (%)
Ancestries Reported - German (%)
Ancestries Reported - Greek (%)
Ancestries Reported - Hungarian (%)
Ancestries Reported - Irish (%)
Ancestries Reported - Italian (%)
Ancestries Reported - Lithuanian (%)
Ancestries Reported - Norwegian (%)
Ancestries Reported - Polish (%)
Ancestries Reported - Portuguese (%)
Ancestries Reported - Russian (%)
Ancestries Reported - Scotch-Irish (%)
Ancestries Reported - Scottish (%)
Ancestries Reported - Slovak (%)
Ancestries Reported - Subsaharan African (%)
Ancestries Reported - Swedish (%)
Ancestries Reported - Swiss (%)
Ancestries Reported - Ukrainian (%)
Ancestries Reported - United States (%)
Ancestries Reported - Welsh (%)
Ancestries Reported - West Indian (%)
Ancestries Reported - Other (%)
Geographical mobility - Same house 1 year ago (%)
Geographical mobility - Same house 1 year ago (%) - White
Geographical mobility - Same house 1 year ago (%) - Black or African American
Geographical mobility - Same house 1 year ago (%) - Asian
Geographical mobility - Same house 1 year ago (%) - Hispanic or Latino
Geographical mobility - Same house 1 year ago (%) - American Indian and Alaska Native
Geographical mobility - Same house 1 year ago (%) - Multirace
Geographical mobility - Same house 1 year ago (%) - Other Race
Geographical mobility - Moved within same county (%)
Geographical mobility - Moved within same county (%) - White
Geographical mobility - Moved within same county (%) - Black or African American
Geographical mobility - Moved within same county (%) - Asian
Geographical mobility - Moved within same county (%) - Hispanic or Latino
Geographical mobility - Moved within same county (%) - American Indian and Alaska Native
Geographical mobility - Moved within same county (%) - Multirace
Geographical mobility - Moved within same county (%) - Other Race
Geographical mobility - Moved from different county within same state (%)
Geographical mobility - Moved from different county within same state (%) - White
Geographical mobility - Moved from different county within same state (%) - Black or African American
Geographical mobility - Moved from different county within same state (%) - Asian
Geographical mobility - Moved from different county within same state (%) - Hispanic or Latino
Geographical mobility - Moved from different county within same state (%) - American Indian and Alaska Native
Geographical mobility - Moved from different county within same state (%) - Multirace
Geographical mobility - Moved from different county within same state (%) - Other Race
Geographical mobility - Moved from different state (%)
Geographical mobility - Moved from different state (%) - White
Geographical mobility - Moved from different state (%) - Black or African American
Geographical mobility - Moved from different state (%) - Asian
Geographical mobility - Moved from different state (%) - Hispanic or Latino
Geographical mobility - Moved from different state (%) - American Indian and Alaska Native
Geographical mobility - Moved from different state (%) - Multirace
Geographical mobility - Moved from different state (%) - Other Race
Geographical mobility - Moved from abroad (%)
Geographical mobility - Moved from abroad (%) - White
Geographical mobility - Moved from abroad (%) - Black or African American
Geographical mobility - Moved from abroad (%) - Asian
Geographical mobility - Moved from abroad (%) - Hispanic or Latino
Geographical mobility - Moved from abroad (%) - American Indian and Alaska Native
Geographical mobility - Moved from abroad (%) - Multirace
Geographical mobility - Moved from abroad (%) - Other Race
Place of birth for the foreign-born population - Ireland (%)
Place of birth for the foreign-born population - Denmark (%)
Place of birth for the foreign-born population - Norway (%)
Place of birth for the foreign-born population - Sweden (%)
Place of birth for the foreign-born population - United Kingdom (%)
Place of birth for the foreign-born population - England (%)
Place of birth for the foreign-born population - Scotland (%)
Place of birth for the foreign-born population - Other Northern Europe (%)
Place of birth for the foreign-born population - Austria (%)
Place of birth for the foreign-born population - Belgium (%)
Place of birth for the foreign-born population - France (%)
Place of birth for the foreign-born population - Germany (%)
Place of birth for the foreign-born population - Netherlands (%)
Place of birth for the foreign-born population - Switzerland (%)
Place of birth for the foreign-born population - Other Western Europe (%)
Place of birth for the foreign-born population - Greece (%)
Place of birth for the foreign-born population - Italy (%)
Place of birth for the foreign-born population - Portugal (%)
Place of birth for the foreign-born population - Spain (%)
Place of birth for the foreign-born population - Other Southern Europe (%)
Place of birth for the foreign-born population - Albania (%)
Place of birth for the foreign-born population - Belarus (%)
Place of birth for the foreign-born population - Bosnia and Herzegovina (%)
Place of birth for the foreign-born population - Bulgaria (%)
Place of birth for the foreign-born population - Croatia (%)
Place of birth for the foreign-born population - Czechoslovakia (%)
Place of birth for the foreign-born population - Hungary (%)
Place of birth for the foreign-born population - Latvia (%)
Place of birth for the foreign-born population - Lithuania (%)
Place of birth for the foreign-born population - North Macedonia (Macedonia) (%)
Place of birth for the foreign-born population - Moldova (%)
Place of birth for the foreign-born population - Poland (%)
Place of birth for the foreign-born population - Romania (%)
Place of birth for the foreign-born population - Russia (%)
Place of birth for the foreign-born population - Serbia (%)
Place of birth for the foreign-born population - Ukraine (%)
Place of birth for the foreign-born population - Other Eastern Europe (%)
Place of birth for the foreign-born population - China (%)
Place of birth for the foreign-born population - Hong Kong (%)
Place of birth for the foreign-born population - Taiwan (%)
Place of birth for the foreign-born population - Japan (%)
Place of birth for the foreign-born population - Korea (%)
Place of birth for the foreign-born population - Other Eastern Asia (%)
Place of birth for the foreign-born population - Afghanistan (%)
Place of birth for the foreign-born population - Bangladesh (%)
Place of birth for the foreign-born population - India (%)
Place of birth for the foreign-born population - Iran (%)
Place of birth for the foreign-born population - Kazakhstan (%)
Place of birth for the foreign-born population - Nepal (%)
Place of birth for the foreign-born population - Pakistan (%)
Place of birth for the foreign-born population - Sri Lanka (%)
Place of birth for the foreign-born population - Uzbekistan (%)
Place of birth for the foreign-born population - Other South Central Asia (%)
Place of birth for the foreign-born population - Burma (%)
Place of birth for the foreign-born population - Cambodia (%)
Place of birth for the foreign-born population - Indonesia (%)
Place of birth for the foreign-born population - Laos (%)
Place of birth for the foreign-born population - Malaysia (%)
Place of birth for the foreign-born population - Philippines (%)
Place of birth for the foreign-born population - Singapore (%)
Place of birth for the foreign-born population - Thailand (%)
Place of birth for the foreign-born population - Vietnam (%)
Place of birth for the foreign-born population - Other South Eastern Asia (%)
Place of birth for the foreign-born population - Armenia (%)
Place of birth for the foreign-born population - Iraq (%)
Place of birth for the foreign-born population - Israel (%)
Place of birth for the foreign-born population - Jordan (%)
Place of birth for the foreign-born population - Kuwait (%)
Place of birth for the foreign-born population - Lebanon (%)
Place of birth for the foreign-born population - Saudi Arabia (%)
Place of birth for the foreign-born population - Syria (%)
Place of birth for the foreign-born population - Turkey (%)
Place of birth for the foreign-born population - Yemen (%)
Place of birth for the foreign-born population - Other Western Asia (%)
Place of birth for the foreign-born population - Eritrea (%)
Place of birth for the foreign-born population - Ethiopia (%)
Place of birth for the foreign-born population - Kenya (%)
Place of birth for the foreign-born population - Somalia (%)
Place of birth for the foreign-born population - Uganda (%)
Place of birth for the foreign-born population - Zimbabwe (%)
Place of birth for the foreign-born population - Other Eastern Africa (%)
Place of birth for the foreign-born population - Cameroon (%)
Place of birth for the foreign-born population - Congo (%)
Place of birth for the foreign-born population - Democratic Republic of Congo (Zaire) (%)
Place of birth for the foreign-born population - Other Middle Africa (%)
Place of birth for the foreign-born population - Egypt (%)
Place of birth for the foreign-born population - Morocco (%)
Place of birth for the foreign-born population - Sudan (%)
Place of birth for the foreign-born population - Other Northern Africa (%)
Place of birth for the foreign-born population - South Africa (%)
Place of birth for the foreign-born population - Other Southern Africa (%)
Place of birth for the foreign-born population - Cabo Verde (%)
Place of birth for the foreign-born population - Ghana (%)
Place of birth for the foreign-born population - Liberia (%)
Place of birth for the foreign-born population - Nigeria (%)
Place of birth for the foreign-born population - Senegal (%)
Place of birth for the foreign-born population - Sierra Leone (%)
Place of birth for the foreign-born population - Other Western Africa (%)
Place of birth for the foreign-born population - Australia (%)
Place of birth for the foreign-born population - New Zealand (%)
Place of birth for the foreign-born population - Fiji (%)
Place of birth for the foreign-born population - Micronesia (%)
Place of birth for the foreign-born population - Bahamas (%)
Place of birth for the foreign-born population - Barbados (%)
Place of birth for the foreign-born population - Cuba (%)
Place of birth for the foreign-born population - Dominica (%)
Place of birth for the foreign-born population - Dominican Republic (%)
Place of birth for the foreign-born population - Grenada (%)
Place of birth for the foreign-born population - Haiti (%)
Place of birth for the foreign-born population - Jamaica (%)
Place of birth for the foreign-born population - St. Vincent and the Grenadines (%)
Place of birth for the foreign-born population - Trinidad and Tobago (%)
Place of birth for the foreign-born population - West Indies (%)
Place of birth for the foreign-born population - Other Caribbean (%)
Place of birth for the foreign-born population - Belize (%)
Place of birth for the foreign-born population - Costa Rica (%)
Place of birth for the foreign-born population - El Salvador (%)
Place of birth for the foreign-born population - Guatemala (%)
Place of birth for the foreign-born population - Honduras (%)
Place of birth for the foreign-born population - Mexico (%)
Place of birth for the foreign-born population - Nicaragua (%)
Place of birth for the foreign-born population - Panama (%)
Place of birth for the foreign-born population - Other Central America (%)
Place of birth for the foreign-born population - Argentina (%)
Place of birth for the foreign-born population - Bolivia (%)
Place of birth for the foreign-born population - Brazil (%)
Place of birth for the foreign-born population - Chile (%)
Place of birth for the foreign-born population - Colombia (%)
Place of birth for the foreign-born population - Ecuador (%)
Place of birth for the foreign-born population - Guyana (%)
Place of birth for the foreign-born population - Peru (%)
Place of birth for the foreign-born population - Uruguay (%)
Place of birth for the foreign-born population - Venezuela (%)
Place of birth for the foreign-born population - Other South America (%)
Place of birth for the foreign-born population - Canada (%)
Place of birth for the foreign-born population - Other Northern America (%)
Place of birth for the foreign-born population - Other (%)
Latest news about races in Lansdowne, PA collected exclusively by city-data.com from local newspapers, TV, and radio stations
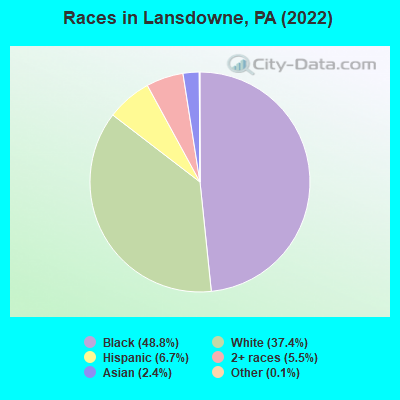
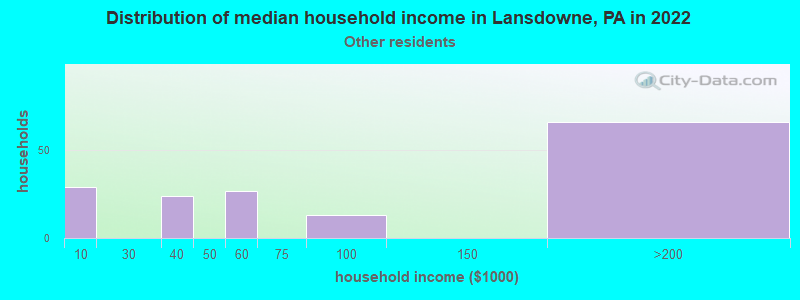
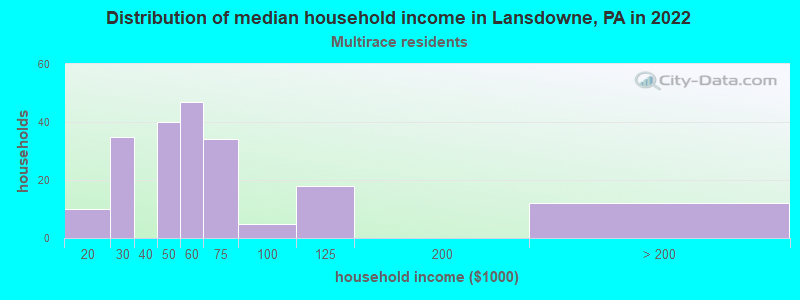
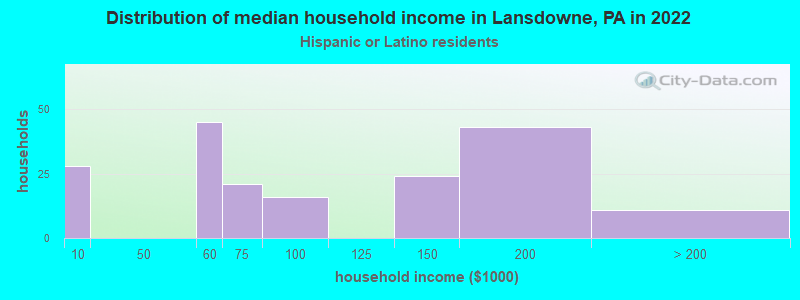
According to 2022 data, the most numerous races in Lansdowne, PA are White alone (4,136 residents), Black alone (5,389 residents), and Hispanic (738 residents). 85.4% of Lansdowne residents speak English at home. 14.6% of Lansdowne, PA residents are foreign-born (6.9% born in Africa, 3.5% born in Latin America, 3.0% born in Asia), which is 52.1% greater than the foreign-born rate of 7.0% across the entire state of Pennsylvania.
Race distribution in Lansdowne
2000 2022
10,322,455 84.1% White alone 1,202,437 9.8% Black alone 394,088 3.2% Hispanic 218,296 1.8% Asian alone 113,097 0.9% Two or more races 13,086 0.1% Other race alone 14,904 0.1% American Indian alone 2,691 0.02% Native Hawaiian and Other
9,487,228 73.1% White alone 1,311,581 10.1% Black alone 1,115,997 8.6% Hispanic 493,942 3.8% Two or more races 487,124 3.8% Asian alone 63,582 0.5% Other race alone 10,130 0.08% American Indian alone 2,424 0.02% Native Hawaiian and Other
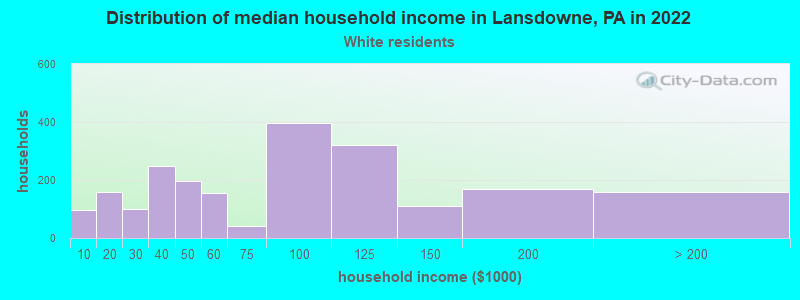
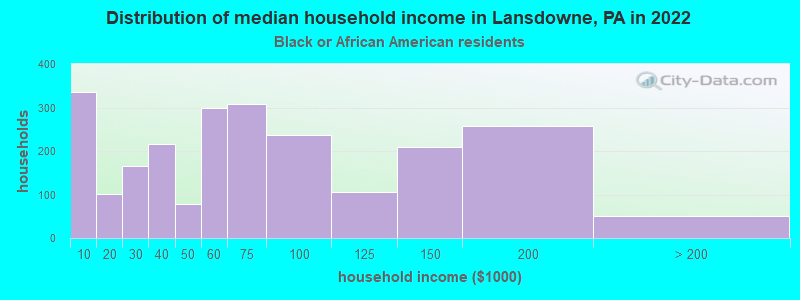
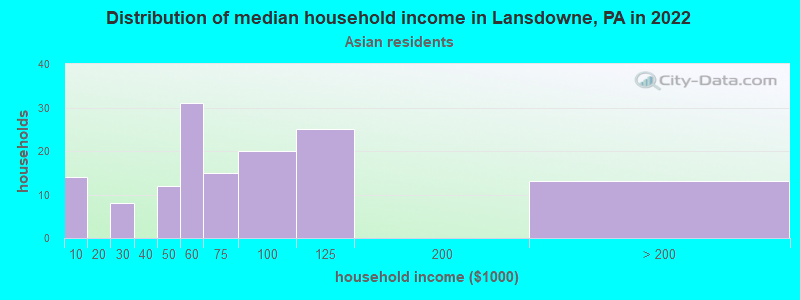
Income and house value in Lansdowne Median household income in 2022 $74,042 White non-Hispanic householders$67,052 Black householders$55,084 Asian householders$50,393 Two or more races householdersMedian 2022 house value $211,025 White Non-Hispanic householders$224,913 Black or African American householders $239,838 Asian householders$233,205 Some other race householders$201,696 Two or more races householders$252,276 Hispanic or Latino householders
Median age by race in Lansdowne
57.9 Median age for White residents55.5 59.8 39.1 Median age for Black or African American residents36.8 42.8 -1,210,144,926.3 Median age for American Indian / Alaska Native residents-1,478,964,399.8 -897,163,119.7 43.1 Median age for Asian residents43.4 36.2 -680,432,644.4 Median age for Native Hawaiian / Pacific Islander residents-666,666,666.0 -747,474,746.7 31.8 Median age for Other race residents28.0 26.4 34.5 Median age for Two or more races residents26.7 35.5 57.7 Median age for White alone residents55.6 59.7 31.0 Median age for Hispanic or Latino residents32.9 31.9
Owner/renter occupied households by race in Lansdowne
House owners and renters - White residents 1,615 75.0% Owner occupied538 25.0% Renter occupiedHouse owners and renters - Black or African American residents 1,600 68.0% Owner occupied753 32.0% Renter occupiedHouse owners and renters - Asian residents 114 73.5% Owner occupied41 26.5% Renter occupiedHouse owners and renters - Other race residents 134 100.0% Owner occupiedHouse owners and renters - Two or more races residents 105 52.4% Owner occupied96 47.6% Renter occupiedHouse owners and renters - White alone residents 1,608 74.6% Owner occupied546 25.4% Renter occupiedHouse owners and renters - Hispanic or Latino residents 141 73.5% Owner occupied51 26.5% Renter occupied
Language usage in Lansdowne
English speakers - Total 85.4% of residents of Lansdowne speak English at home.
4.6% of residents speak Spanish at home 315 64.2% Speak English very well176 35.8% Speak English less than very well9.7% of residents speak other language at home 635 61.5% Speak English very well398 38.5% Speak English less than very well
English speakers - Born in the United States 85.4% of residents of Lansdowne speak English at home.
11.9% of residents speak Spanish at home 201 90.1% Speak English very well22 9.9% Speak English less than very well2.6% of residents speak other language at home 39 81.2% Speak English very well9 18.8% Speak English less than very well
English speakers - Native, born elsewhere 66.7% of residents of Lansdowne speak English at home.
25.1% of residents speak Spanish at home 4 8.7% Speak English very well42 91.3% Speak English less than very well
English speakers - Foreign-born 48.1% of residents of Lansdowne speak English at home.
9.9% of residents speak Spanish at home 55 39.0% Speak English very well86 61.0% Speak English less than very well43.8% of residents speak other language at home 333 53.3% Speak English very well292 46.7% Speak English less than very well
White (Caucasian) - Speak only English Native:
98.8% (3,966)Foreign-born:
20.6% (19)
White (Caucasian) - Speak another language Native:
1.5% (58)Foreign-born:
74.8% (69)
Black or African American - Speak only English Native:
91.5% (3,867)Foreign-born:
63.5% (578)
Black or African American - Speak another language Native:
8.5% (358)Foreign-born:
36.9% (336)
Asian - Speak only English Native:
97.9% (16)Foreign-born:
8.2% (18)
Other race - Speak another language Native:
100.0% (443)Foreign-born:
100.0% (142)
White alone - Speak only English Native:
98.8% (3,950)Foreign-born:
19.0% (19)
White alone - Speak another language Native:
1.3% (54)Foreign-born:
77.8% (79)
Hispanic or Latino - Speak another language Native:
72.7% (361)Foreign-born:
100.0% (127)
Foreign-born residents in Lansdowne 1,616 residents are foreign born (6.9% Africa , 3.5% Latin America , 3.0% Asia ).
This city:
14.6%Pennsylvania:
7.3%
Marital status for residents in Lansdowne Marital status - White (Caucasian) population 15 years and over
Males 44.6% Never married38.3% Now married0.5% Separated2.7% Widowed13.9% DivorcedFemales 33.0% Never married37.4% Now married0.7% Separated14.0% Widowed14.9% DivorcedWomen who did not give birth in the past 12 months Now married:
33.9% (174)Unmarried:
66.1% (339)
Marital status - Black or African American population 15 years and over
Males 40.3% Never married34.4% Now married0.0% Separated1.5% Widowed23.8% DivorcedFemales 44.4% Never married35.7% Now married3.1% Separated6.0% Widowed10.8% DivorcedWomen who gave birth in the past 12 months Now married:
91.2% (94)Unmarried:
8.8% (9)
Women who did not give birth in the past 12 months Now married:
38.3% (405)Unmarried:
61.7% (652)
Marital status - Asian population 15 years and over
Males 14.1% Never married85.9% Now married0.0% Separated0.0% Widowed0.0% DivorcedFemales 27.9% Never married65.6% Now married0.0% Separated0.0% Widowed6.5% DivorcedWomen who did not give birth in the past 12 months Now married:
53.4% (49)Unmarried:
46.6% (43)
Marital status - Other race population 15 years and over
Males 59.2% Never married33.0% Now married0.0% Separated0.0% Widowed7.8% DivorcedFemales 62.8% Never married37.2% Now married0.0% Separated0.0% Widowed0.0% DivorcedWomen who did not give birth in the past 12 months Now married:
23.1% (45)Unmarried:
76.9% (150)
Marital status - Two or more races population 15 years and over
Males 39.7% Never married32.8% Now married5.9% Separated0.0% Widowed21.6% DivorcedFemales 39.4% Never married39.4% Now married0.0% Separated4.0% Widowed17.1% DivorcedWomen who did not give birth in the past 12 months Now married:
44.1% (59)Unmarried:
55.9% (74)
Marital status - White alone, not Hispanic / Latino population 15 years and over
Males 45.0% Never married37.9% Now married0.5% Separated2.8% Widowed13.8% DivorcedFemales 33.3% Never married37.1% Now married0.7% Separated14.1% Widowed14.8% DivorcedWomen who did not give birth in the past 12 months Now married:
33.9% (176)Unmarried:
66.1% (343)
Marital status - Hispanic or Latino population 15 years and over
Males 52.7% Never married32.1% Now married0.0% Separated0.0% Widowed15.2% DivorcedFemales 62.2% Never married36.0% Now married0.0% Separated0.0% Widowed1.8% DivorcedWomen who did not give birth in the past 12 months Now married:
20.5% (39)Unmarried:
79.5% (152)
Ancestries in Lansdowne
520 8.6% Irish460 7.6% Liberian407 6.7% African233 3.8% Italian218 3.6% French202 3.3% Haitian195 3.2% Ghanaian113 1.9% Jamaican85 1.4% English69 1.1% German66 1.1% American60 1.0% European37 0.6% Scotch-Irish33 0.5% British33 0.5% Portuguese23 0.4% Jordanian23 0.4% Scottish20 0.3% Russian19 0.3% Luxembourger19 0.3% Norwegian18 0.3% Albanian18 0.3% Barbadian12 0.2% Greek11 0.2% Brazilian11 0.2% Polish10 0.2% Dutch10 0.2% Eastern European10 0.2% Slovak10 0.2% Nigerian
Children Nativity (place of birth) in Lansdowne
Children under 6 years - Living with two parents Both parents native 123 100.0% NativeBoth parents foreign-born 73 100.0% NativeOne native, one foreign-born parent 16 100.0% NativeChildren under 6 years - Living with one parent Native parent 178 100.0% NativeForeign-born parent 90 100.0% NativeChildren 6 to 17 years - Living with two parents Both parents native 444 100.0% NativeBoth parents foreign-born 199 84.2% Native37 15.8% Foreign-bornOne native, one foreign-born parent 76 100.0% NativeChildren 6 to 17 years - Living with one parent Native parent 194 100.0% NativeForeign-born parent 382 56.5% Native294 43.5% Foreign-born
Grandparents responsible for own grandchildren in Lansdowne
Grandparents (30 to 59 years) Black or African American 17 38.9% Responsible for grandchildren27 61.1% Not responsible for grandchildrenOther race 20 39.5% Responsible for grandchildren31 60.5% Not responsible for grandchildrenHispanic or Latino 16 40.7% Responsible for grandchildren23 59.3% Not responsible for grandchildrenGrandparents (60 years and over) Black or African American 59 88.7% Responsible for grandchildren7 11.3% Not responsible for grandchildrenHispanic or Latino 10 100.0% Responsible for grandchildren