Races in Lansdowne-Baltimore Highlands, Maryland (MD) Detailed Stats
Ancestries, Foreign-born residents, place of birth

Discuss Lansdowne-Baltimore Highlands, Maryland races on our local forum with over 2,400,000 registered users
4.7% of Lansdowne-Baltimore Highlands, MD residents are foreign-born (2.4% born in Asia, 1.8% born in Latin America), which is 237.7% less than the foreign-born rate of 16.0% across the entire state of Maryland.
Race distribution in Lansdowne-Baltimore Highlands

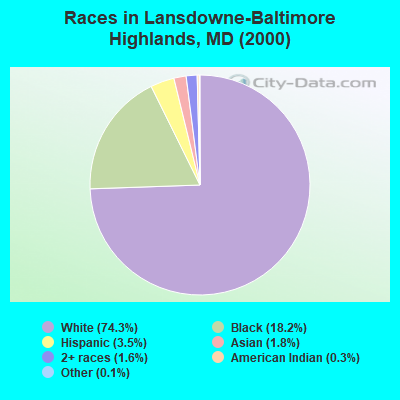
- 11,68974.3%White alone
- 2,86718.2%Black alone
- 5573.5%Hispanic
- 2901.8%Asian alone
- 2441.6%Two or more races
- 530.3%American Indian alone
- 210.1%Other race alone
- 30.02%Native Hawaiian and Other
Pacific Islander alone
2000
2022
-
- 3,286,54762.1%White alone
- 1,464,73527.7%Black alone
- 227,9164.3%Hispanic
- 209,7384.0%Asian alone
- 82,9461.6%Two or more races
- 13,3120.3%American Indian alone
- 9,3790.2%Other race alone
- 1,9130.04%Native Hawaiian and Other
Pacific Islander alone

-
- 2,906,49247.1%White alone
- 1,800,91429.2%Black alone
- 705,84211.4%Hispanic
- 401,8186.5%Asian alone
- 291,3174.7%Two or more races
- 46,9300.8%Other race alone
- 8,9300.1%American Indian alone
- 2,4170.04%Native Hawaiian and Other
Pacific Islander alone

Income and house value in Lansdowne-Baltimore Highlands
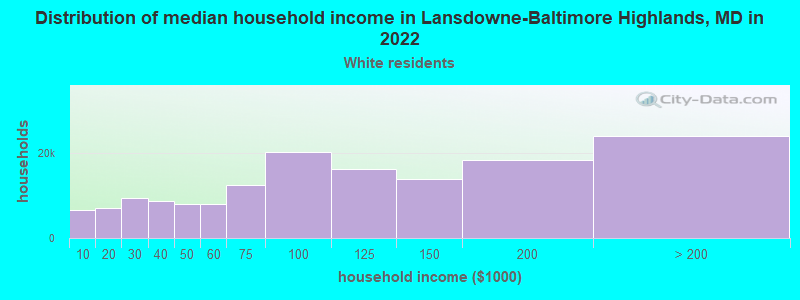
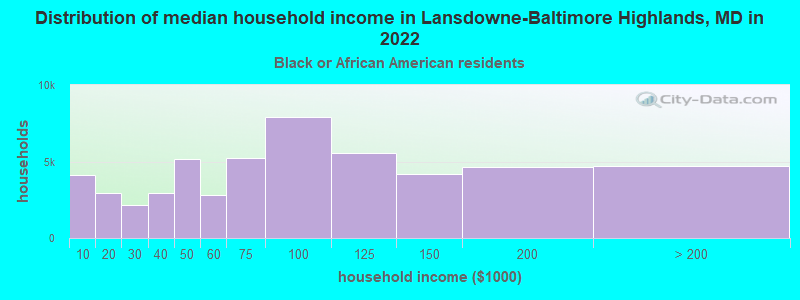
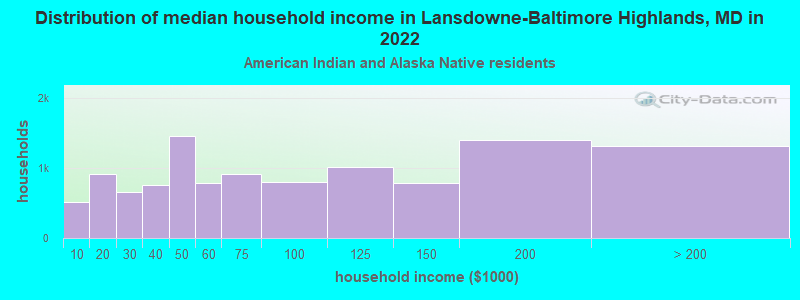
- Median household income in 2022
- $74,446White non-Hispanic householders
- $39,821Black householders
- $72,932American Indian and Alaska Native householders
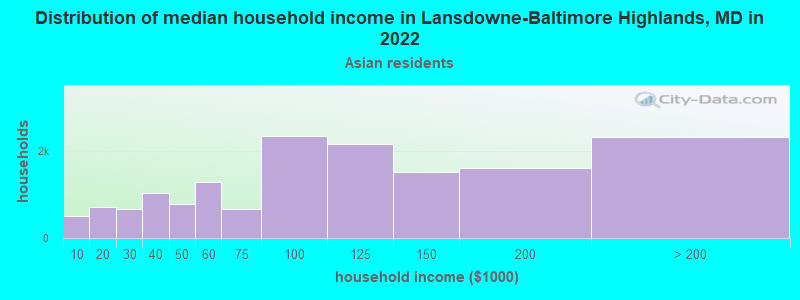
- $94,299Asian householders
- $35,735Some other race householders
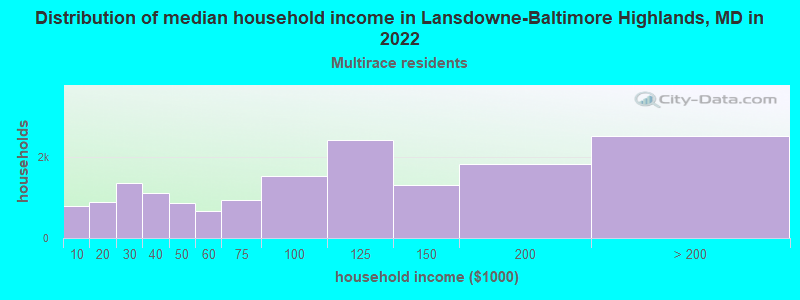
- $89,023Two or more races householders
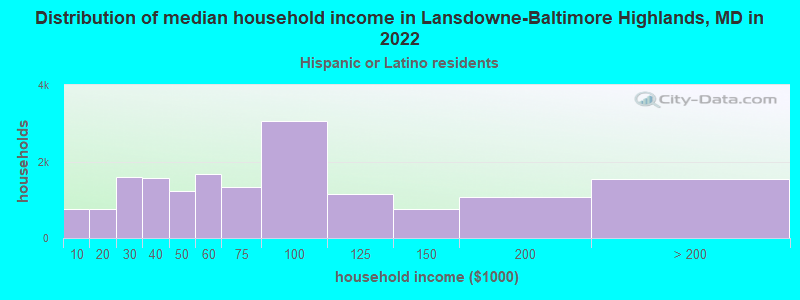
- $61,584Hispanic or Latino race householders
- Median 2022 house value
- $251,460White Non-Hispanic householders
- $252,509Black or African American householders
- $249,101American Indian or Alaska Native householders
- $296,036Asian householders
- $294,988Some other race householders
- $281,353Two or more races householders
- $230,746Hispanic or Latino householders
Household income for White non-Hispanic householders
Household income for Black householders
Household income for American Indian and Alaska Native householders
Household income for Asian householders
Household income for Two or more races householders
Household income for Hispanic or Latino race householders
Foreign-born residents in Lansdowne-Baltimore Highlands
745 residents are foreign born (2.4% Asia, 1.8% Latin America).
| This city: | 4.7% |
| Maryland: | 9.8% |
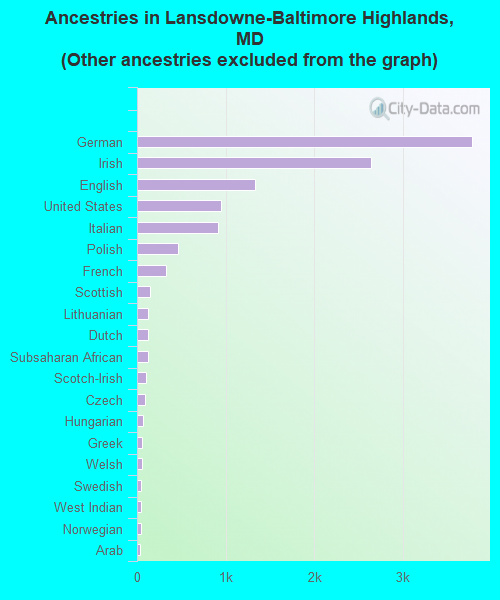
Ancestries in Lansdowne-Baltimore Highlands

- 4,10626.2%Other
- 3,78424.2%German
- 2,63816.8%Irish
- 1,3328.5%English
- 9536.1%United States
- 9185.9%Italian
- 4643.0%Polish
- 3222.1%French
- 1470.9%Scottish
- 1290.8%Lithuanian
- 1210.8%Dutch
- 1200.8%Subsaharan African
- 1010.6%Scotch-Irish
- 920.6%Czech
- 720.5%Hungarian
- 610.4%Greek
- 520.3%Welsh
- 490.3%Swedish
- 470.3%West Indian
- 430.3%Norwegian
- 370.2%Arab
- 270.2%Ukrainian
- 180.1%Russian
- 150.10%French Canadian
- 120.08%Slovak
- 70.04%Swiss
Zip codes: 21227.