Races in Lansdale, Pennsylvania (PA) Detailed Stats
Data:
Races - White alone (%)
Races - White alone (% change since 2000)
Races - Black alone (%)
Races - Black alone (% change since 2000)
Races - American Indian alone (%)
Races - American Indian alone (% change since 2000)
Races - Asian alone (%)
Races - Asian alone (% change since 2000)
Races - Hispanic (%)
Races - Hispanic (% change since 2000)
Races - Native Hawaiian and Other Pacific Islander alone (%)
Races - Native Hawaiian and Other Pacific Islander alone (% change since 2000)
Races - Two or more races(%)
Races - Two or more races(% change since 2000)
Races - Other race alone (%)
Races - Other race alone (% change since 2000)
Racial diversity
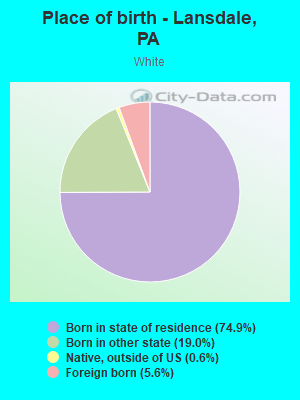
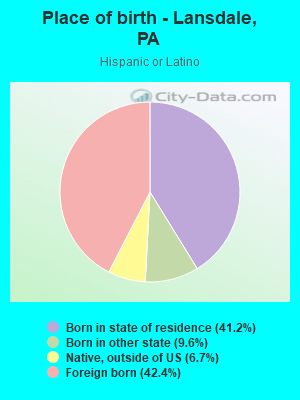
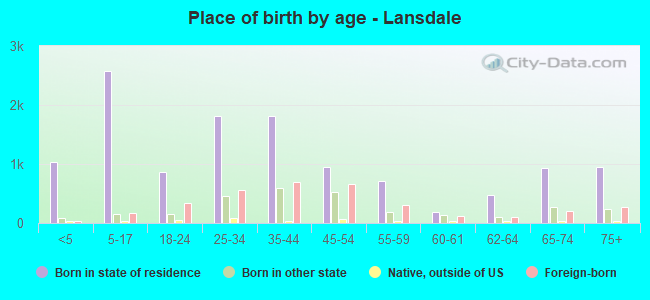
Place of birth - Born in state of residence (%)
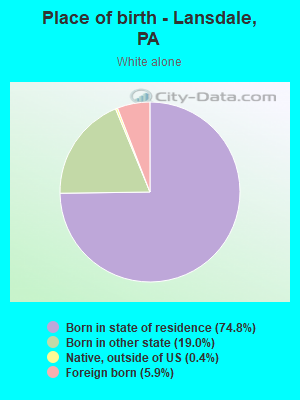
Place of birth - Born in state of residence (%) - White
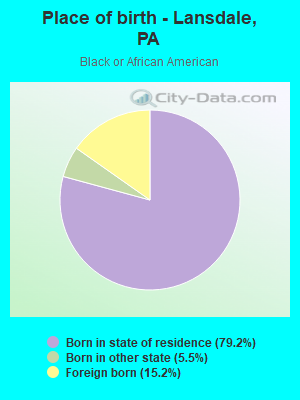
Place of birth - Born in state of residence (%) - Black or African American
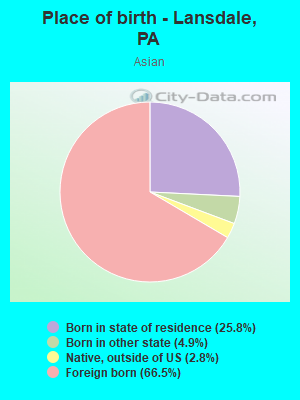
Place of birth - Born in state of residence (%) - Asian
Place of birth - Born in state of residence (%) - Hispanic or Latino
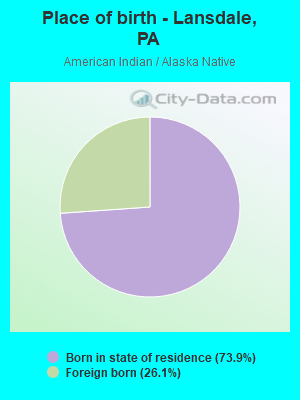
Place of birth - Born in state of residence (%) - American Indian and Alaska Native
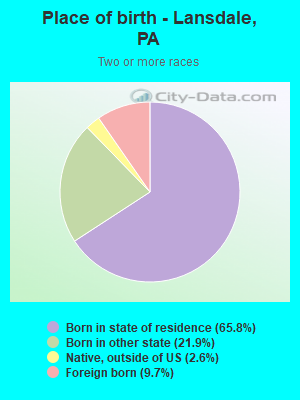
Place of birth - Born in state of residence (%) - Multirace
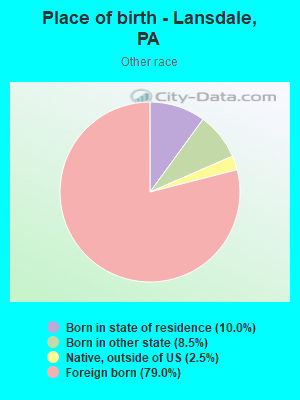
Place of birth - Born in state of residence (%) - Other Race
Place of birth - Born in other state (%)
Place of birth - Born in other state (%) - White
Place of birth - Born in other state (%) - Black or African American
Place of birth - Born in other state (%) - Asian
Place of birth - Born in other state (%) - Hispanic or Latino
Place of birth - Born in other state (%) - American Indian and Alaska Native
Place of birth - Born in other state (%) - Multirace
Place of birth - Born in other state (%) - Other Race
Place of birth - Native, outside of US (%)
Place of birth - Native, outside of US (%) - White
Place of birth - Native, outside of US (%) - Black or African American
Place of birth - Native, outside of US (%) - Asian
Place of birth - Native, outside of US (%) - Hispanic or Latino
Place of birth - Native, outside of US (%) - American Indian and Alaska Native
Place of birth - Native, outside of US (%) - Multirace
Place of birth - Native, outside of US (%) - Other Race
Place of birth - Foreign born (%)
Place of birth - Foreign born (%) - White
Place of birth - Foreign born (%) - Black or African American
Place of birth - Foreign born (%) - Asian
Place of birth - Foreign born (%) - Hispanic or Latino
Place of birth - Foreign born (%) - American Indian and Alaska Native
Place of birth - Foreign born (%) - Multirace
Place of birth - Foreign born (%) - Other Race
Residents speaking English at home (%)
Residents speaking English at home - Born in the United States (%)
Residents speaking English at home - Native, born elsewhere (%)
Residents speaking English at home - Foreign born (%)
Residents speaking Spanish at home (%)
Residents speaking Spanish at home - Born in the United States (%)
Residents speaking Spanish at home - Native, born elsewhere (%)
Residents speaking Spanish at home - Foreign born (%)
Residents speaking other language at home (%)
Residents speaking other language at home - Born in the United States (%)
Residents speaking other language at home - Native, born elsewhere (%)
Residents speaking other language at home - Foreign born (%)
Marital status - Never married (%)
Marital status - Now married (%)
Marital status - Separated (%)
Marital status - Widowed (%)
Marital status - Divorced (%)
Ancestries Reported - Arab (%)
Ancestries Reported - Czech (%)
Ancestries Reported - Danish (%)
Ancestries Reported - Dutch (%)
Ancestries Reported - English (%)
Ancestries Reported - French (%)
Ancestries Reported - French Canadian (%)
Ancestries Reported - German (%)
Ancestries Reported - Greek (%)
Ancestries Reported - Hungarian (%)
Ancestries Reported - Irish (%)
Ancestries Reported - Italian (%)
Ancestries Reported - Lithuanian (%)
Ancestries Reported - Norwegian (%)
Ancestries Reported - Polish (%)
Ancestries Reported - Portuguese (%)
Ancestries Reported - Russian (%)
Ancestries Reported - Scotch-Irish (%)
Ancestries Reported - Scottish (%)
Ancestries Reported - Slovak (%)
Ancestries Reported - Subsaharan African (%)
Ancestries Reported - Swedish (%)
Ancestries Reported - Swiss (%)
Ancestries Reported - Ukrainian (%)
Ancestries Reported - United States (%)
Ancestries Reported - Welsh (%)
Ancestries Reported - West Indian (%)
Ancestries Reported - Other (%)
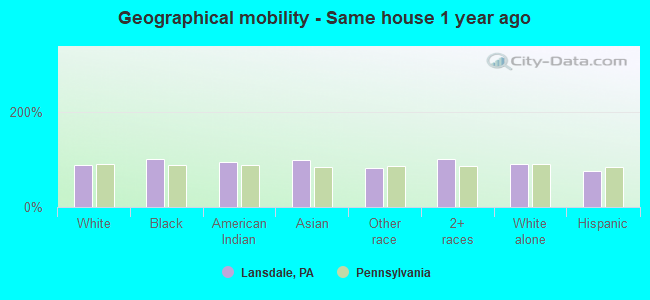
Geographical mobility - Same house 1 year ago (%)
Geographical mobility - Same house 1 year ago (%) - White
Geographical mobility - Same house 1 year ago (%) - Black or African American
Geographical mobility - Same house 1 year ago (%) - Asian
Geographical mobility - Same house 1 year ago (%) - Hispanic or Latino
Geographical mobility - Same house 1 year ago (%) - American Indian and Alaska Native
Geographical mobility - Same house 1 year ago (%) - Multirace
Geographical mobility - Same house 1 year ago (%) - Other Race
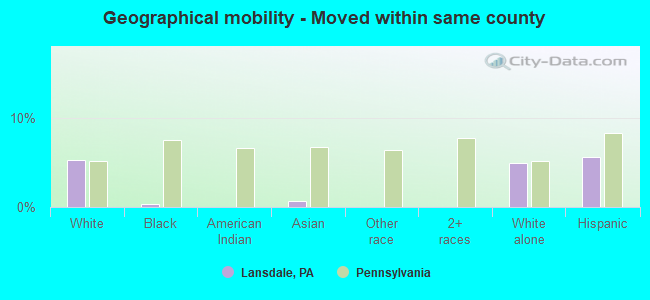
Geographical mobility - Moved within same county (%)
Geographical mobility - Moved within same county (%) - White
Geographical mobility - Moved within same county (%) - Black or African American
Geographical mobility - Moved within same county (%) - Asian
Geographical mobility - Moved within same county (%) - Hispanic or Latino
Geographical mobility - Moved within same county (%) - American Indian and Alaska Native
Geographical mobility - Moved within same county (%) - Multirace
Geographical mobility - Moved within same county (%) - Other Race
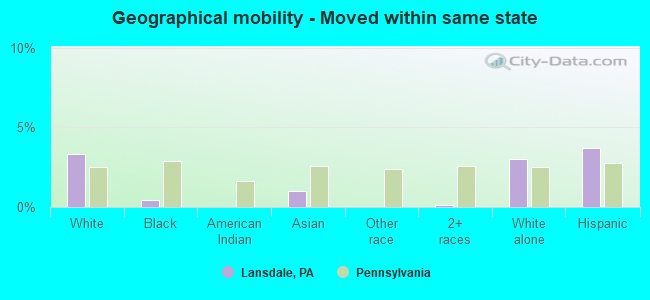
Geographical mobility - Moved from different county within same state (%)
Geographical mobility - Moved from different county within same state (%) - White
Geographical mobility - Moved from different county within same state (%) - Black or African American
Geographical mobility - Moved from different county within same state (%) - Asian
Geographical mobility - Moved from different county within same state (%) - Hispanic or Latino
Geographical mobility - Moved from different county within same state (%) - American Indian and Alaska Native
Geographical mobility - Moved from different county within same state (%) - Multirace
Geographical mobility - Moved from different county within same state (%) - Other Race
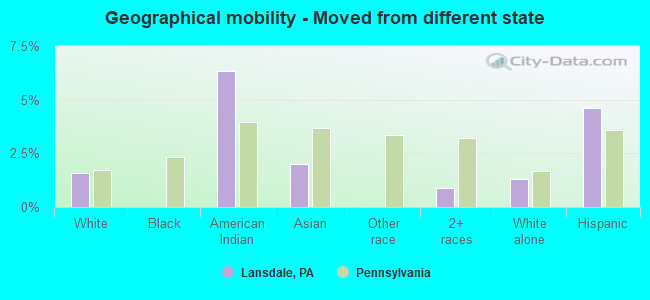
Geographical mobility - Moved from different state (%)
Geographical mobility - Moved from different state (%) - White
Geographical mobility - Moved from different state (%) - Black or African American
Geographical mobility - Moved from different state (%) - Asian
Geographical mobility - Moved from different state (%) - Hispanic or Latino
Geographical mobility - Moved from different state (%) - American Indian and Alaska Native
Geographical mobility - Moved from different state (%) - Multirace
Geographical mobility - Moved from different state (%) - Other Race
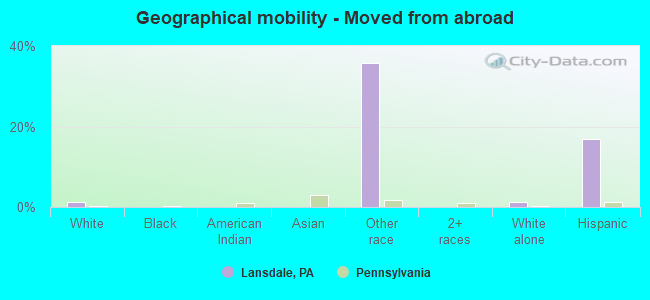
Geographical mobility - Moved from abroad (%)
Geographical mobility - Moved from abroad (%) - White
Geographical mobility - Moved from abroad (%) - Black or African American
Geographical mobility - Moved from abroad (%) - Asian
Geographical mobility - Moved from abroad (%) - Hispanic or Latino
Geographical mobility - Moved from abroad (%) - American Indian and Alaska Native
Geographical mobility - Moved from abroad (%) - Multirace
Geographical mobility - Moved from abroad (%) - Other Race
Place of birth for the foreign-born population - Ireland (%)
Place of birth for the foreign-born population - Denmark (%)
Place of birth for the foreign-born population - Norway (%)
Place of birth for the foreign-born population - Sweden (%)
Place of birth for the foreign-born population - United Kingdom (%)
Place of birth for the foreign-born population - England (%)
Place of birth for the foreign-born population - Scotland (%)
Place of birth for the foreign-born population - Other Northern Europe (%)
Place of birth for the foreign-born population - Austria (%)
Place of birth for the foreign-born population - Belgium (%)
Place of birth for the foreign-born population - France (%)
Place of birth for the foreign-born population - Germany (%)
Place of birth for the foreign-born population - Netherlands (%)
Place of birth for the foreign-born population - Switzerland (%)
Place of birth for the foreign-born population - Other Western Europe (%)
Place of birth for the foreign-born population - Greece (%)
Place of birth for the foreign-born population - Italy (%)
Place of birth for the foreign-born population - Portugal (%)
Place of birth for the foreign-born population - Spain (%)
Place of birth for the foreign-born population - Other Southern Europe (%)
Place of birth for the foreign-born population - Albania (%)
Place of birth for the foreign-born population - Belarus (%)
Place of birth for the foreign-born population - Bosnia and Herzegovina (%)
Place of birth for the foreign-born population - Bulgaria (%)
Place of birth for the foreign-born population - Croatia (%)
Place of birth for the foreign-born population - Czechoslovakia (%)
Place of birth for the foreign-born population - Hungary (%)
Place of birth for the foreign-born population - Latvia (%)
Place of birth for the foreign-born population - Lithuania (%)
Place of birth for the foreign-born population - North Macedonia (Macedonia) (%)
Place of birth for the foreign-born population - Moldova (%)
Place of birth for the foreign-born population - Poland (%)
Place of birth for the foreign-born population - Romania (%)
Place of birth for the foreign-born population - Russia (%)
Place of birth for the foreign-born population - Serbia (%)
Place of birth for the foreign-born population - Ukraine (%)
Place of birth for the foreign-born population - Other Eastern Europe (%)
Place of birth for the foreign-born population - China (%)
Place of birth for the foreign-born population - Hong Kong (%)
Place of birth for the foreign-born population - Taiwan (%)
Place of birth for the foreign-born population - Japan (%)
Place of birth for the foreign-born population - Korea (%)
Place of birth for the foreign-born population - Other Eastern Asia (%)
Place of birth for the foreign-born population - Afghanistan (%)
Place of birth for the foreign-born population - Bangladesh (%)
Place of birth for the foreign-born population - India (%)
Place of birth for the foreign-born population - Iran (%)
Place of birth for the foreign-born population - Kazakhstan (%)
Place of birth for the foreign-born population - Nepal (%)
Place of birth for the foreign-born population - Pakistan (%)
Place of birth for the foreign-born population - Sri Lanka (%)
Place of birth for the foreign-born population - Uzbekistan (%)
Place of birth for the foreign-born population - Other South Central Asia (%)
Place of birth for the foreign-born population - Burma (%)
Place of birth for the foreign-born population - Cambodia (%)
Place of birth for the foreign-born population - Indonesia (%)
Place of birth for the foreign-born population - Laos (%)
Place of birth for the foreign-born population - Malaysia (%)
Place of birth for the foreign-born population - Philippines (%)
Place of birth for the foreign-born population - Singapore (%)
Place of birth for the foreign-born population - Thailand (%)
Place of birth for the foreign-born population - Vietnam (%)
Place of birth for the foreign-born population - Other South Eastern Asia (%)
Place of birth for the foreign-born population - Armenia (%)
Place of birth for the foreign-born population - Iraq (%)
Place of birth for the foreign-born population - Israel (%)
Place of birth for the foreign-born population - Jordan (%)
Place of birth for the foreign-born population - Kuwait (%)
Place of birth for the foreign-born population - Lebanon (%)
Place of birth for the foreign-born population - Saudi Arabia (%)
Place of birth for the foreign-born population - Syria (%)
Place of birth for the foreign-born population - Turkey (%)
Place of birth for the foreign-born population - Yemen (%)
Place of birth for the foreign-born population - Other Western Asia (%)
Place of birth for the foreign-born population - Eritrea (%)
Place of birth for the foreign-born population - Ethiopia (%)
Place of birth for the foreign-born population - Kenya (%)
Place of birth for the foreign-born population - Somalia (%)
Place of birth for the foreign-born population - Uganda (%)
Place of birth for the foreign-born population - Zimbabwe (%)
Place of birth for the foreign-born population - Other Eastern Africa (%)
Place of birth for the foreign-born population - Cameroon (%)
Place of birth for the foreign-born population - Congo (%)
Place of birth for the foreign-born population - Democratic Republic of Congo (Zaire) (%)
Place of birth for the foreign-born population - Other Middle Africa (%)
Place of birth for the foreign-born population - Egypt (%)
Place of birth for the foreign-born population - Morocco (%)
Place of birth for the foreign-born population - Sudan (%)
Place of birth for the foreign-born population - Other Northern Africa (%)
Place of birth for the foreign-born population - South Africa (%)
Place of birth for the foreign-born population - Other Southern Africa (%)
Place of birth for the foreign-born population - Cabo Verde (%)
Place of birth for the foreign-born population - Ghana (%)
Place of birth for the foreign-born population - Liberia (%)
Place of birth for the foreign-born population - Nigeria (%)
Place of birth for the foreign-born population - Senegal (%)
Place of birth for the foreign-born population - Sierra Leone (%)
Place of birth for the foreign-born population - Other Western Africa (%)
Place of birth for the foreign-born population - Australia (%)
Place of birth for the foreign-born population - New Zealand (%)
Place of birth for the foreign-born population - Fiji (%)
Place of birth for the foreign-born population - Micronesia (%)
Place of birth for the foreign-born population - Bahamas (%)
Place of birth for the foreign-born population - Barbados (%)
Place of birth for the foreign-born population - Cuba (%)
Place of birth for the foreign-born population - Dominica (%)
Place of birth for the foreign-born population - Dominican Republic (%)
Place of birth for the foreign-born population - Grenada (%)
Place of birth for the foreign-born population - Haiti (%)
Place of birth for the foreign-born population - Jamaica (%)
Place of birth for the foreign-born population - St. Vincent and the Grenadines (%)
Place of birth for the foreign-born population - Trinidad and Tobago (%)
Place of birth for the foreign-born population - West Indies (%)
Place of birth for the foreign-born population - Other Caribbean (%)
Place of birth for the foreign-born population - Belize (%)
Place of birth for the foreign-born population - Costa Rica (%)
Place of birth for the foreign-born population - El Salvador (%)
Place of birth for the foreign-born population - Guatemala (%)
Place of birth for the foreign-born population - Honduras (%)
Place of birth for the foreign-born population - Mexico (%)
Place of birth for the foreign-born population - Nicaragua (%)
Place of birth for the foreign-born population - Panama (%)
Place of birth for the foreign-born population - Other Central America (%)
Place of birth for the foreign-born population - Argentina (%)
Place of birth for the foreign-born population - Bolivia (%)
Place of birth for the foreign-born population - Brazil (%)
Place of birth for the foreign-born population - Chile (%)
Place of birth for the foreign-born population - Colombia (%)
Place of birth for the foreign-born population - Ecuador (%)
Place of birth for the foreign-born population - Guyana (%)
Place of birth for the foreign-born population - Peru (%)
Place of birth for the foreign-born population - Uruguay (%)
Place of birth for the foreign-born population - Venezuela (%)
Place of birth for the foreign-born population - Other South America (%)
Place of birth for the foreign-born population - Canada (%)
Place of birth for the foreign-born population - Other Northern America (%)
Place of birth for the foreign-born population - Other (%)
Latest news about races in Lansdale, PA collected exclusively by city-data.com from local newspapers, TV, and radio stations
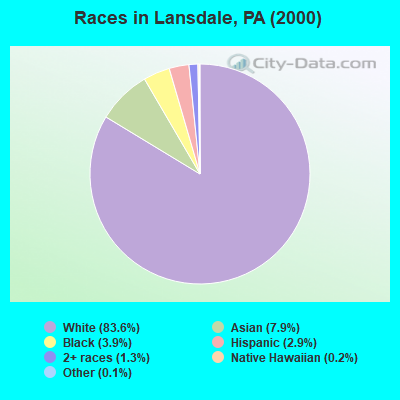
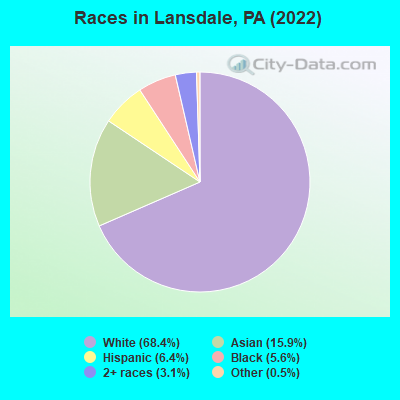
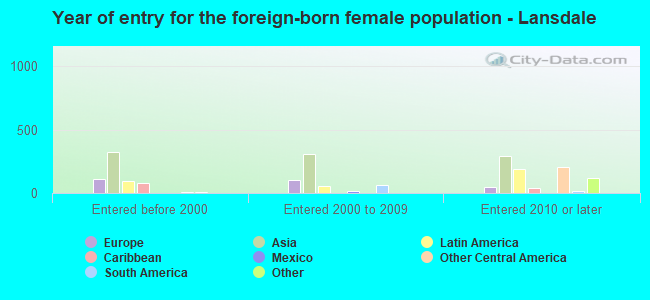
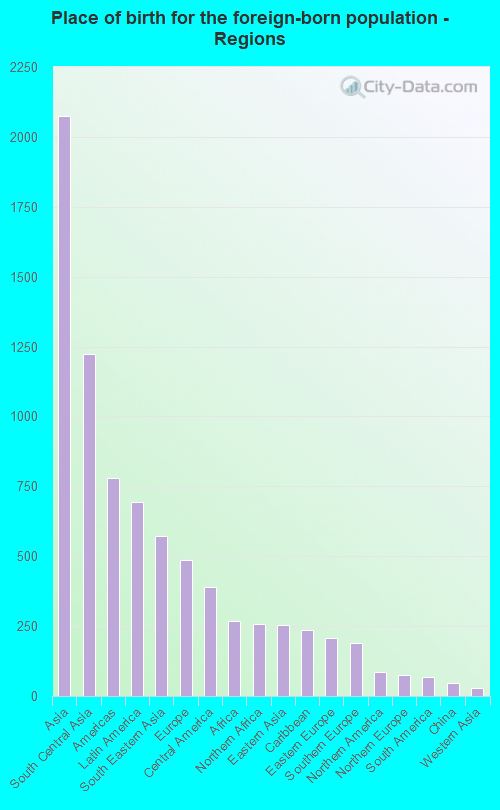
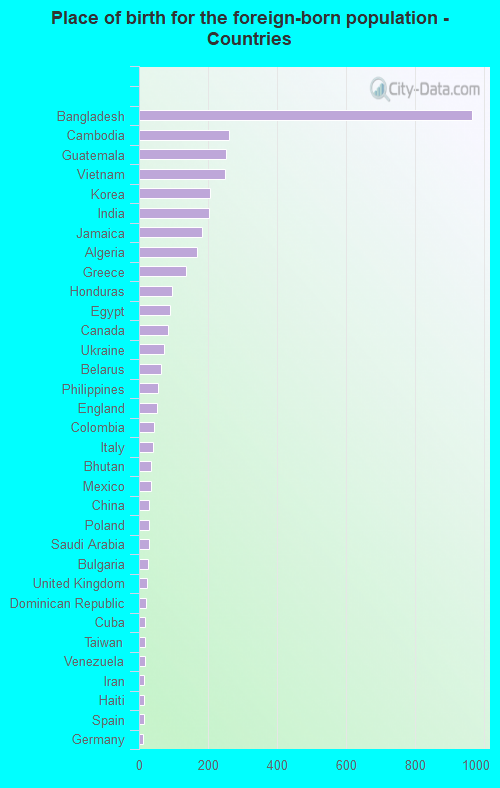
According to 2022 data, the most numerous races in Lansdale, PA are White alone (12,924 residents), Black alone (1,057 residents), and Hispanic (1,218 residents). 75.8% of Lansdale residents speak English at home. 19.1% of Lansdale, PA residents are foreign-born (10.7% born in Asia, 3.6% born in Latin America, 2.5% born in Europe), which is 63.4% greater than the foreign-born rate of 7.0% across the entire state of Pennsylvania.
Race distribution in Lansdale
2000 2022
10,322,455 84.1% White alone 1,202,437 9.8% Black alone 394,088 3.2% Hispanic 218,296 1.8% Asian alone 113,097 0.9% Two or more races 13,086 0.1% Other race alone 14,904 0.1% American Indian alone 2,691 0.02% Native Hawaiian and Other
9,487,228 73.1% White alone 1,311,581 10.1% Black alone 1,115,997 8.6% Hispanic 493,942 3.8% Two or more races 487,124 3.8% Asian alone 63,582 0.5% Other race alone 10,130 0.08% American Indian alone 2,424 0.02% Native Hawaiian and Other
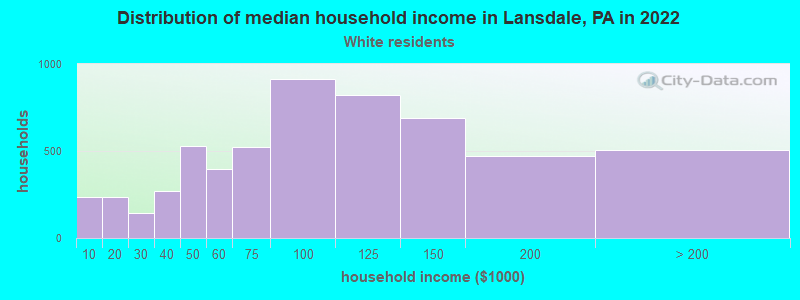
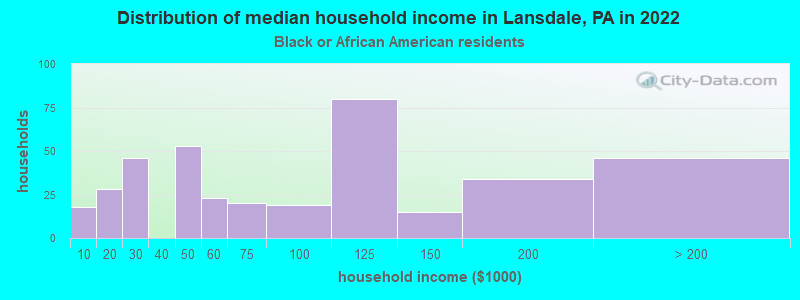
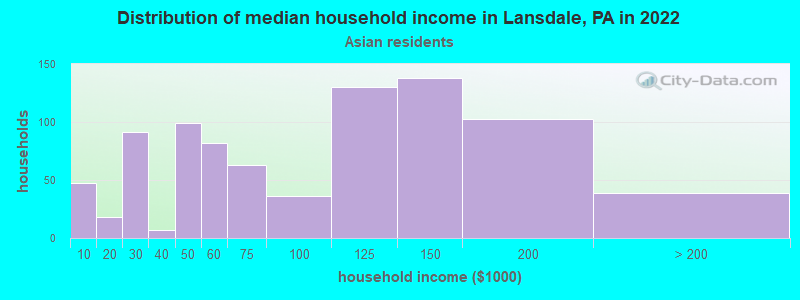
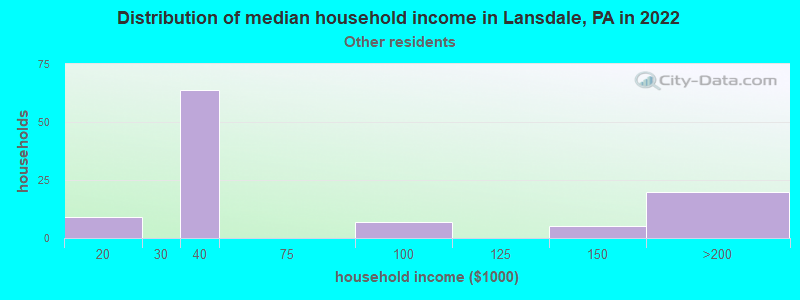
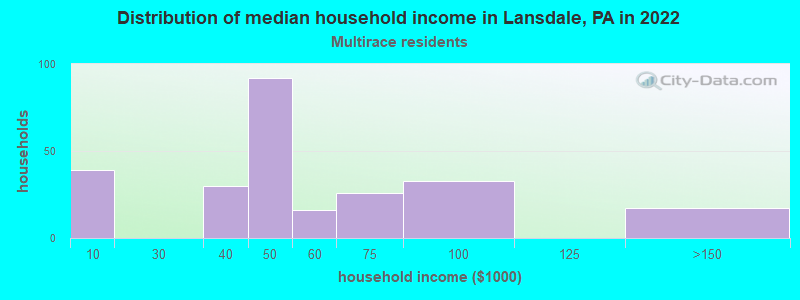
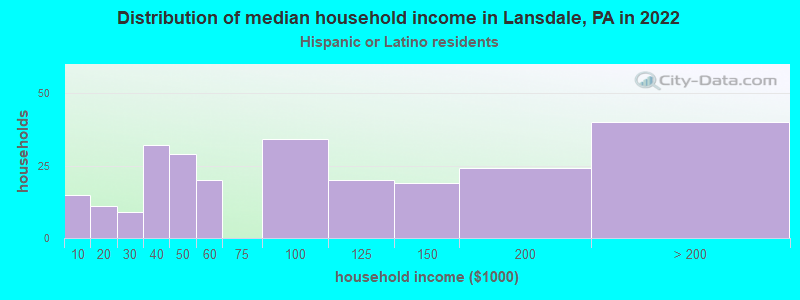
Income and house value in Lansdale Median household income in 2022 $84,632 White non-Hispanic householders$105,436 Black householders$75,879 Asian householders$58,380 Some other race householders$44,945 Two or more races householders$72,578 Hispanic or Latino race householdersMedian 2022 house value $315,132 White Non-Hispanic householders$254,412 Black or African American householders $261,329 Asian householders$304,372 Some other race householders$243,395 Two or more races householders$298,991 Hispanic or Latino householders
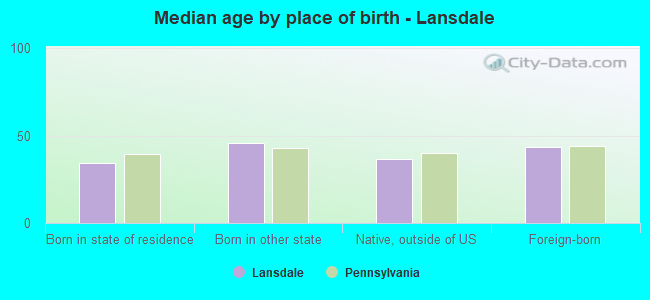
Median age by race in Lansdale
39.3 Median age for White residents38.8 40.1 40.3 Median age for Black or African American residents37.3 42.7 13.5 Median age for American Indian / Alaska Native residents23.7 -577,519,379.3 36.0 Median age for Asian residents36.2 33.3 -680,432,644.4 Median age for Native Hawaiian / Pacific Islander residents-649,523,808.9 -747,474,746.7 27.2 Median age for Other race residents15.6 47.3 20.3 Median age for Two or more races residents19.9 28.9 39.3 Median age for White alone residents39.0 39.6 26.5 Median age for Hispanic or Latino residents18.3 34.7
Owner/renter occupied households by race in Lansdale
House owners and renters - White residents 3,292 58.0% Owner occupied2,379 42.0% Renter occupiedHouse owners and renters - Black or African American residents 103 27.5% Owner occupied272 72.5% Renter occupiedHouse owners and renters - American Indian / Alaska Native residents 2 100.0% Owner occupiedHouse owners and renters - Asian residents 589 63.8% Owner occupied334 36.2% Renter occupiedHouse owners and renters - Other race residents 37 43.4% Owner occupied49 56.6% Renter occupiedHouse owners and renters - Two or more races residents 58 26.3% Owner occupied163 73.7% Renter occupiedHouse owners and renters - White alone residents 3,236 57.5% Owner occupied2,396 42.5% Renter occupiedHouse owners and renters - Hispanic or Latino residents 120 43.6% Owner occupied155 56.4% Renter occupied
Language usage in Lansdale
English speakers - Total 75.8% of residents of Lansdale speak English at home.
4.1% of residents speak Spanish at home 200 27.5% Speak English very well526 72.5% Speak English less than very well20.7% of residents speak other language at home 1,730 47.0% Speak English very well1,953 53.0% Speak English less than very well
English speakers - Born in the United States 91.9% of residents of Lansdale speak English at home.
1.9% of residents speak Spanish at home 55 100.0% Speak English very well6.2% of residents speak other language at home 114 64.4% Speak English very well63 35.6% Speak English less than very well
English speakers - Native, born elsewhere 33.2% of residents of Lansdale speak English at home.
18.0% of residents speak Spanish at home 15 40.5% Speak English very well22 59.5% Speak English less than very well61.5% of residents speak other language at home 126 100.0% Speak English very well
English speakers - Foreign-born 12.5% of residents of Lansdale speak English at home.
15.4% of residents speak Spanish at home 38 7.1% Speak English very well495 92.9% Speak English less than very well74.2% of residents speak other language at home 961 37.5% Speak English very well1,599 62.5% Speak English less than very well
White (Caucasian) - Speak only English Native:
96.5% (11,320)Foreign-born:
14.0% (101)
White (Caucasian) - Speak another language Native:
3.4% (399)Foreign-born:
83.9% (603)
Black or African American - Speak only English Native:
94.3% (822)Foreign-born:
85.9% (157)
Black or African American - Speak another language Native:
5.8% (51)Foreign-born:
19.0% (35)
American Indian / Alaska Native - Speak only English Native:
42.2% (11)Foreign-born:
71.9% (8)
Asian - Speak only English Native:
16.9% (133)Foreign-born:
8.0% (159)
Asian - Speak another language Native:
88.1% (696)Foreign-born:
91.7% (1,835)
Other race - Speak another language Native:
89.5% (110)Foreign-born:
100.0% (439)
Two or more races - Speak only English Native:
94.1% (682)Foreign-born:
38.4% (36)
Two or more races - Speak another language Native:
4.4% (32)Foreign-born:
61.0% (57)
White alone - Speak only English Native:
96.4% (11,156)Foreign-born:
11.3% (85)
White alone - Speak another language Native:
3.6% (419)Foreign-born:
89.7% (675)
Hispanic or Latino - Speak only English Native:
75.9% (457)Foreign-born:
8.3% (43)
Hispanic or Latino - Speak another language Native:
24.6% (148)Foreign-born:
91.9% (471)
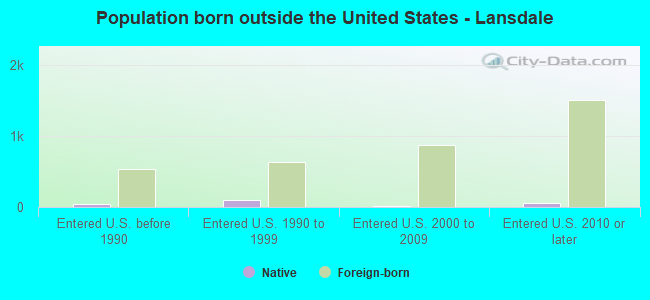
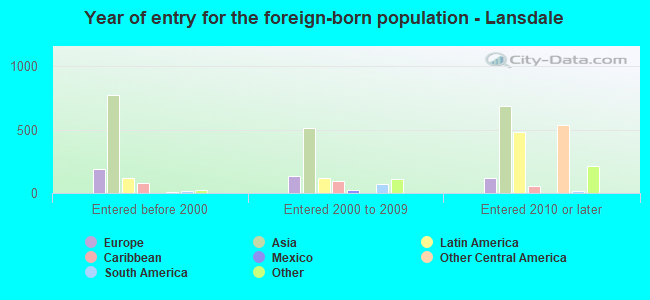
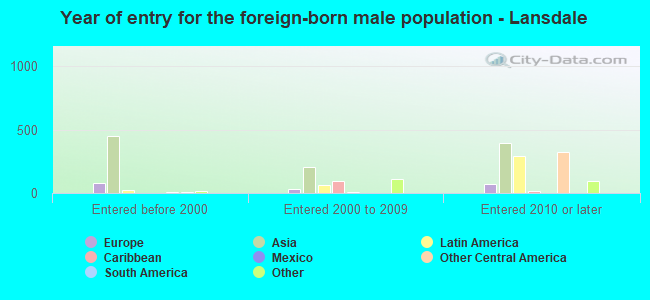
Foreign-born residents in Lansdale 3,613 residents are foreign born (10.7% Asia , 3.6% Latin America , 2.5% Europe ).
This city:
19.1%Pennsylvania:
7.3%
Marital status for residents in Lansdale Marital status - White (Caucasian) population 15 years and over
Males 40.6% Never married46.1% Now married1.1% Separated3.5% Widowed8.7% DivorcedFemales 28.3% Never married47.5% Now married0.8% Separated10.4% Widowed13.0% DivorcedWomen who gave birth in the past 12 months Now married:
72.2% (159)Unmarried:
27.8% (61)
Women who did not give birth in the past 12 months Now married:
49.3% (1,292)Unmarried:
50.7% (1,330)
Marital status - Black or African American population 15 years and over
Males 55.2% Never married40.6% Now married0.0% Separated1.4% Widowed2.8% DivorcedFemales 35.3% Never married40.2% Now married1.1% Separated7.6% Widowed15.9% DivorcedWomen who gave birth in the past 12 months Now married:
0.0% (0)Unmarried:
100.0% (35)
Women who did not give birth in the past 12 months Now married:
43.8% (87)Unmarried:
56.2% (111)
Marital status - Asian population 15 years and over
Males 27.1% Never married69.3% Now married0.0% Separated2.4% Widowed1.2% DivorcedFemales 24.5% Never married67.4% Now married0.0% Separated5.3% Widowed2.8% DivorcedWomen who gave birth in the past 12 months Now married:
100.0% (20)Unmarried:
0.0% (0)
Women who did not give birth in the past 12 months Now married:
59.9% (438)Unmarried:
40.1% (293)
Marital status - Other race population 15 years and over
Males 88.8% Never married11.2% Now married0.0% Separated0.0% Widowed0.0% DivorcedFemales 42.7% Never married49.7% Now married0.0% Separated7.6% Widowed0.0% DivorcedWomen who did not give birth in the past 12 months Now married:
48.7% (95)Unmarried:
51.3% (100)
Marital status - Two or more races population 15 years and over
Males 57.2% Never married35.8% Now married0.0% Separated0.9% Widowed6.0% DivorcedFemales 26.1% Never married63.0% Now married0.0% Separated0.0% Widowed10.9% DivorcedWomen who did not give birth in the past 12 months Now married:
57.7% (101)Unmarried:
42.3% (74)
Marital status - White alone, not Hispanic / Latino population 15 years and over
Males 39.8% Never married46.8% Now married1.1% Separated3.4% Widowed9.0% DivorcedFemales 28.5% Never married47.0% Now married0.8% Separated10.6% Widowed13.2% DivorcedWomen who gave birth in the past 12 months Now married:
72.2% (162)Unmarried:
27.8% (62)
Women who did not give birth in the past 12 months Now married:
49.0% (1,265)Unmarried:
51.0% (1,315)
Marital status - Hispanic or Latino population 15 years and over
Males 73.0% Never married23.6% Now married0.0% Separated3.4% Widowed0.0% DivorcedFemales 38.6% Never married52.1% Now married0.0% Separated1.5% Widowed7.9% DivorcedWomen who gave birth in the past 12 months Now married:
0.0% (0)Unmarried:
100.0% (26)
Women who did not give birth in the past 12 months Now married:
46.6% (154)Unmarried:
53.4% (176)
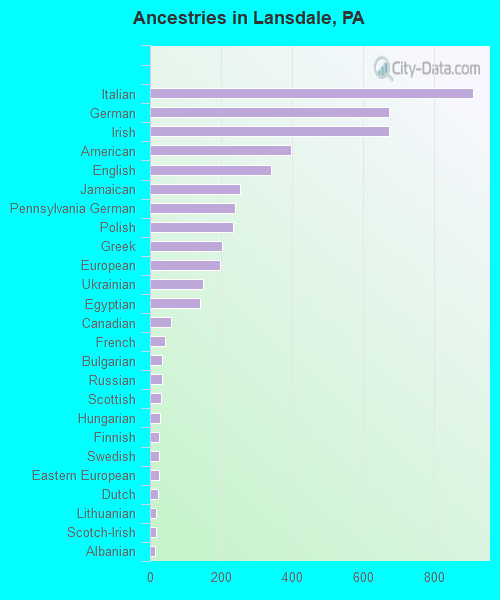
Ancestries in Lansdale
909 10.4% Italian674 7.7% German673 7.7% Irish396 4.5% American341 3.9% English253 2.9% Jamaican238 2.7% Pennsylvania German233 2.7% Polish203 2.3% Greek198 2.3% European150 1.7% Ukrainian140 1.6% Egyptian58 0.7% Canadian41 0.5% French35 0.4% Bulgarian33 0.4% Russian31 0.4% Scottish27 0.3% Hungarian26 0.3% Finnish25 0.3% Swedish24 0.3% Eastern European22 0.3% Dutch18 0.2% Lithuanian18 0.2% Scotch-Irish15 0.2% Albanian14 0.2% Iranian13 0.1% African13 0.1% Haitian12 0.1% Yugoslavian8 0.09% Portuguese7 0.08% Slovene6 0.07% Northern European4 0.05% Slovak4 0.05% French Canadian3 0.03% British
Children Nativity (place of birth) in Lansdale
Children under 6 years - Living with two parents Both parents native 690 99.8% Native2 0.2% Foreign-bornBoth parents foreign-born 84 77.4% Native25 22.6% Foreign-bornOne native, one foreign-born parent 45 100.0% NativeChildren under 6 years - Living with one parent Native parent 333 100.0% NativeForeign-born parent 32 100.0% NativeChildren 6 to 17 years - Living with two parents Both parents native 1,304 100.0% NativeBoth parents foreign-born 256 93.1% Native19 6.9% Foreign-bornOne native, one foreign-born parent 117 82.0% Native26 18.0% Foreign-bornChildren 6 to 17 years - Living with one parent Native parent 754 100.0% NativeForeign-born parent 119 62.0% Native73 38.0% Foreign-born
Grandparents responsible for own grandchildren in Lansdale
Grandparents (30 to 59 years) White / Caucasian 14 37.4% Responsible for grandchildren23 62.6% Not responsible for grandchildrenAsian 13 31.5% Responsible for grandchildren29 68.5% Not responsible for grandchildrenTwo or more races 11 61.4% Responsible for grandchildren7 38.6% Not responsible for grandchildrenWhite alone, not Hispanic / Latino 7 27.9% Responsible for grandchildren17 72.1% Not responsible for grandchildrenHispanic or Latino 7 38.7% Responsible for grandchildren11 61.3% Not responsible for grandchildrenGrandparents (60 years and over) White / Caucasian 52 70.7% Responsible for grandchildren21 29.3% Not responsible for grandchildrenAsian 166 100.0% Not responsible for grandchildrenWhite alone, not Hispanic / Latino 52 70.4% Responsible for grandchildren22 29.6% Not responsible for grandchildren