Races in Landover, Maryland (MD) Detailed Stats
Data:
Races - White alone (%)
Races - White alone (% change since 2000)
Races - Black alone (%)
Races - Black alone (% change since 2000)
Races - American Indian alone (%)
Races - American Indian alone (% change since 2000)
Races - Asian alone (%)
Races - Asian alone (% change since 2000)
Races - Hispanic (%)
Races - Hispanic (% change since 2000)
Races - Native Hawaiian and Other Pacific Islander alone (%)
Races - Native Hawaiian and Other Pacific Islander alone (% change since 2000)
Races - Two or more races(%)
Races - Two or more races(% change since 2000)
Races - Other race alone (%)
Races - Other race alone (% change since 2000)
Racial diversity
Place of birth - Born in state of residence (%)
Place of birth - Born in state of residence (%) - White
Place of birth - Born in state of residence (%) - Black or African American
Place of birth - Born in state of residence (%) - Asian
Place of birth - Born in state of residence (%) - Hispanic or Latino
Place of birth - Born in state of residence (%) - American Indian and Alaska Native
Place of birth - Born in state of residence (%) - Multirace
Place of birth - Born in state of residence (%) - Other Race
Place of birth - Born in other state (%)
Place of birth - Born in other state (%) - White
Place of birth - Born in other state (%) - Black or African American
Place of birth - Born in other state (%) - Asian
Place of birth - Born in other state (%) - Hispanic or Latino
Place of birth - Born in other state (%) - American Indian and Alaska Native
Place of birth - Born in other state (%) - Multirace
Place of birth - Born in other state (%) - Other Race
Place of birth - Native, outside of US (%)
Place of birth - Native, outside of US (%) - White
Place of birth - Native, outside of US (%) - Black or African American
Place of birth - Native, outside of US (%) - Asian
Place of birth - Native, outside of US (%) - Hispanic or Latino
Place of birth - Native, outside of US (%) - American Indian and Alaska Native
Place of birth - Native, outside of US (%) - Multirace
Place of birth - Native, outside of US (%) - Other Race
Place of birth - Foreign born (%)
Place of birth - Foreign born (%) - White
Place of birth - Foreign born (%) - Black or African American
Place of birth - Foreign born (%) - Asian
Place of birth - Foreign born (%) - Hispanic or Latino
Place of birth - Foreign born (%) - American Indian and Alaska Native
Place of birth - Foreign born (%) - Multirace
Place of birth - Foreign born (%) - Other Race
Residents speaking English at home (%)
Residents speaking English at home - Born in the United States (%)
Residents speaking English at home - Native, born elsewhere (%)
Residents speaking English at home - Foreign born (%)
Residents speaking Spanish at home (%)
Residents speaking Spanish at home - Born in the United States (%)
Residents speaking Spanish at home - Native, born elsewhere (%)
Residents speaking Spanish at home - Foreign born (%)
Residents speaking other language at home (%)
Residents speaking other language at home - Born in the United States (%)
Residents speaking other language at home - Native, born elsewhere (%)
Residents speaking other language at home - Foreign born (%)
Marital status - Never married (%)
Marital status - Now married (%)
Marital status - Separated (%)
Marital status - Widowed (%)
Marital status - Divorced (%)
Ancestries Reported - Arab (%)
Ancestries Reported - Czech (%)
Ancestries Reported - Danish (%)
Ancestries Reported - Dutch (%)
Ancestries Reported - English (%)
Ancestries Reported - French (%)
Ancestries Reported - French Canadian (%)
Ancestries Reported - German (%)
Ancestries Reported - Greek (%)
Ancestries Reported - Hungarian (%)
Ancestries Reported - Irish (%)
Ancestries Reported - Italian (%)
Ancestries Reported - Lithuanian (%)
Ancestries Reported - Norwegian (%)
Ancestries Reported - Polish (%)
Ancestries Reported - Portuguese (%)
Ancestries Reported - Russian (%)
Ancestries Reported - Scotch-Irish (%)
Ancestries Reported - Scottish (%)
Ancestries Reported - Slovak (%)
Ancestries Reported - Subsaharan African (%)
Ancestries Reported - Swedish (%)
Ancestries Reported - Swiss (%)
Ancestries Reported - Ukrainian (%)
Ancestries Reported - United States (%)
Ancestries Reported - Welsh (%)
Ancestries Reported - West Indian (%)
Ancestries Reported - Other (%)
Geographical mobility - Same house 1 year ago (%)
Geographical mobility - Same house 1 year ago (%) - White
Geographical mobility - Same house 1 year ago (%) - Black or African American
Geographical mobility - Same house 1 year ago (%) - Asian
Geographical mobility - Same house 1 year ago (%) - Hispanic or Latino
Geographical mobility - Same house 1 year ago (%) - American Indian and Alaska Native
Geographical mobility - Same house 1 year ago (%) - Multirace
Geographical mobility - Same house 1 year ago (%) - Other Race
Geographical mobility - Moved within same county (%)
Geographical mobility - Moved within same county (%) - White
Geographical mobility - Moved within same county (%) - Black or African American
Geographical mobility - Moved within same county (%) - Asian
Geographical mobility - Moved within same county (%) - Hispanic or Latino
Geographical mobility - Moved within same county (%) - American Indian and Alaska Native
Geographical mobility - Moved within same county (%) - Multirace
Geographical mobility - Moved within same county (%) - Other Race
Geographical mobility - Moved from different county within same state (%)
Geographical mobility - Moved from different county within same state (%) - White
Geographical mobility - Moved from different county within same state (%) - Black or African American
Geographical mobility - Moved from different county within same state (%) - Asian
Geographical mobility - Moved from different county within same state (%) - Hispanic or Latino
Geographical mobility - Moved from different county within same state (%) - American Indian and Alaska Native
Geographical mobility - Moved from different county within same state (%) - Multirace
Geographical mobility - Moved from different county within same state (%) - Other Race
Geographical mobility - Moved from different state (%)
Geographical mobility - Moved from different state (%) - White
Geographical mobility - Moved from different state (%) - Black or African American
Geographical mobility - Moved from different state (%) - Asian
Geographical mobility - Moved from different state (%) - Hispanic or Latino
Geographical mobility - Moved from different state (%) - American Indian and Alaska Native
Geographical mobility - Moved from different state (%) - Multirace
Geographical mobility - Moved from different state (%) - Other Race
Geographical mobility - Moved from abroad (%)
Geographical mobility - Moved from abroad (%) - White
Geographical mobility - Moved from abroad (%) - Black or African American
Geographical mobility - Moved from abroad (%) - Asian
Geographical mobility - Moved from abroad (%) - Hispanic or Latino
Geographical mobility - Moved from abroad (%) - American Indian and Alaska Native
Geographical mobility - Moved from abroad (%) - Multirace
Geographical mobility - Moved from abroad (%) - Other Race
Place of birth for the foreign-born population - Ireland (%)
Place of birth for the foreign-born population - Denmark (%)
Place of birth for the foreign-born population - Norway (%)
Place of birth for the foreign-born population - Sweden (%)
Place of birth for the foreign-born population - United Kingdom (%)
Place of birth for the foreign-born population - England (%)
Place of birth for the foreign-born population - Scotland (%)
Place of birth for the foreign-born population - Other Northern Europe (%)
Place of birth for the foreign-born population - Austria (%)
Place of birth for the foreign-born population - Belgium (%)
Place of birth for the foreign-born population - France (%)
Place of birth for the foreign-born population - Germany (%)
Place of birth for the foreign-born population - Netherlands (%)
Place of birth for the foreign-born population - Switzerland (%)
Place of birth for the foreign-born population - Other Western Europe (%)
Place of birth for the foreign-born population - Greece (%)
Place of birth for the foreign-born population - Italy (%)
Place of birth for the foreign-born population - Portugal (%)
Place of birth for the foreign-born population - Spain (%)
Place of birth for the foreign-born population - Other Southern Europe (%)
Place of birth for the foreign-born population - Albania (%)
Place of birth for the foreign-born population - Belarus (%)
Place of birth for the foreign-born population - Bosnia and Herzegovina (%)
Place of birth for the foreign-born population - Bulgaria (%)
Place of birth for the foreign-born population - Croatia (%)
Place of birth for the foreign-born population - Czechoslovakia (%)
Place of birth for the foreign-born population - Hungary (%)
Place of birth for the foreign-born population - Latvia (%)
Place of birth for the foreign-born population - Lithuania (%)
Place of birth for the foreign-born population - North Macedonia (Macedonia) (%)
Place of birth for the foreign-born population - Moldova (%)
Place of birth for the foreign-born population - Poland (%)
Place of birth for the foreign-born population - Romania (%)
Place of birth for the foreign-born population - Russia (%)
Place of birth for the foreign-born population - Serbia (%)
Place of birth for the foreign-born population - Ukraine (%)
Place of birth for the foreign-born population - Other Eastern Europe (%)
Place of birth for the foreign-born population - China (%)
Place of birth for the foreign-born population - Hong Kong (%)
Place of birth for the foreign-born population - Taiwan (%)
Place of birth for the foreign-born population - Japan (%)
Place of birth for the foreign-born population - Korea (%)
Place of birth for the foreign-born population - Other Eastern Asia (%)
Place of birth for the foreign-born population - Afghanistan (%)
Place of birth for the foreign-born population - Bangladesh (%)
Place of birth for the foreign-born population - India (%)
Place of birth for the foreign-born population - Iran (%)
Place of birth for the foreign-born population - Kazakhstan (%)
Place of birth for the foreign-born population - Nepal (%)
Place of birth for the foreign-born population - Pakistan (%)
Place of birth for the foreign-born population - Sri Lanka (%)
Place of birth for the foreign-born population - Uzbekistan (%)
Place of birth for the foreign-born population - Other South Central Asia (%)
Place of birth for the foreign-born population - Burma (%)
Place of birth for the foreign-born population - Cambodia (%)
Place of birth for the foreign-born population - Indonesia (%)
Place of birth for the foreign-born population - Laos (%)
Place of birth for the foreign-born population - Malaysia (%)
Place of birth for the foreign-born population - Philippines (%)
Place of birth for the foreign-born population - Singapore (%)
Place of birth for the foreign-born population - Thailand (%)
Place of birth for the foreign-born population - Vietnam (%)
Place of birth for the foreign-born population - Other South Eastern Asia (%)
Place of birth for the foreign-born population - Armenia (%)
Place of birth for the foreign-born population - Iraq (%)
Place of birth for the foreign-born population - Israel (%)
Place of birth for the foreign-born population - Jordan (%)
Place of birth for the foreign-born population - Kuwait (%)
Place of birth for the foreign-born population - Lebanon (%)
Place of birth for the foreign-born population - Saudi Arabia (%)
Place of birth for the foreign-born population - Syria (%)
Place of birth for the foreign-born population - Turkey (%)
Place of birth for the foreign-born population - Yemen (%)
Place of birth for the foreign-born population - Other Western Asia (%)
Place of birth for the foreign-born population - Eritrea (%)
Place of birth for the foreign-born population - Ethiopia (%)
Place of birth for the foreign-born population - Kenya (%)
Place of birth for the foreign-born population - Somalia (%)
Place of birth for the foreign-born population - Uganda (%)
Place of birth for the foreign-born population - Zimbabwe (%)
Place of birth for the foreign-born population - Other Eastern Africa (%)
Place of birth for the foreign-born population - Cameroon (%)
Place of birth for the foreign-born population - Congo (%)
Place of birth for the foreign-born population - Democratic Republic of Congo (Zaire) (%)
Place of birth for the foreign-born population - Other Middle Africa (%)
Place of birth for the foreign-born population - Egypt (%)
Place of birth for the foreign-born population - Morocco (%)
Place of birth for the foreign-born population - Sudan (%)
Place of birth for the foreign-born population - Other Northern Africa (%)
Place of birth for the foreign-born population - South Africa (%)
Place of birth for the foreign-born population - Other Southern Africa (%)
Place of birth for the foreign-born population - Cabo Verde (%)
Place of birth for the foreign-born population - Ghana (%)
Place of birth for the foreign-born population - Liberia (%)
Place of birth for the foreign-born population - Nigeria (%)
Place of birth for the foreign-born population - Senegal (%)
Place of birth for the foreign-born population - Sierra Leone (%)
Place of birth for the foreign-born population - Other Western Africa (%)
Place of birth for the foreign-born population - Australia (%)
Place of birth for the foreign-born population - New Zealand (%)
Place of birth for the foreign-born population - Fiji (%)
Place of birth for the foreign-born population - Micronesia (%)
Place of birth for the foreign-born population - Bahamas (%)
Place of birth for the foreign-born population - Barbados (%)
Place of birth for the foreign-born population - Cuba (%)
Place of birth for the foreign-born population - Dominica (%)
Place of birth for the foreign-born population - Dominican Republic (%)
Place of birth for the foreign-born population - Grenada (%)
Place of birth for the foreign-born population - Haiti (%)
Place of birth for the foreign-born population - Jamaica (%)
Place of birth for the foreign-born population - St. Vincent and the Grenadines (%)
Place of birth for the foreign-born population - Trinidad and Tobago (%)
Place of birth for the foreign-born population - West Indies (%)
Place of birth for the foreign-born population - Other Caribbean (%)
Place of birth for the foreign-born population - Belize (%)
Place of birth for the foreign-born population - Costa Rica (%)
Place of birth for the foreign-born population - El Salvador (%)
Place of birth for the foreign-born population - Guatemala (%)
Place of birth for the foreign-born population - Honduras (%)
Place of birth for the foreign-born population - Mexico (%)
Place of birth for the foreign-born population - Nicaragua (%)
Place of birth for the foreign-born population - Panama (%)
Place of birth for the foreign-born population - Other Central America (%)
Place of birth for the foreign-born population - Argentina (%)
Place of birth for the foreign-born population - Bolivia (%)
Place of birth for the foreign-born population - Brazil (%)
Place of birth for the foreign-born population - Chile (%)
Place of birth for the foreign-born population - Colombia (%)
Place of birth for the foreign-born population - Ecuador (%)
Place of birth for the foreign-born population - Guyana (%)
Place of birth for the foreign-born population - Peru (%)
Place of birth for the foreign-born population - Uruguay (%)
Place of birth for the foreign-born population - Venezuela (%)
Place of birth for the foreign-born population - Other South America (%)
Place of birth for the foreign-born population - Canada (%)
Place of birth for the foreign-born population - Other Northern America (%)
Place of birth for the foreign-born population - Other (%)
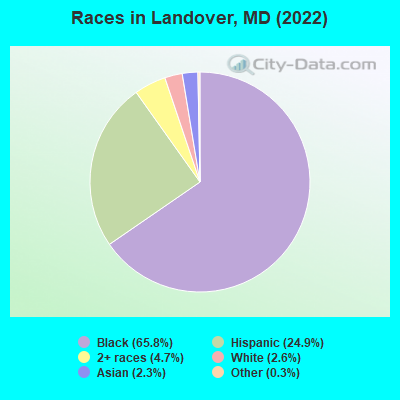
According to 2022 data, the most numerous races in Landover, MD are White alone (639 residents), Black alone (15,915 residents), and Hispanic (6,007 residents). 62.0% of Landover residents speak English at home.
Race distribution in Landover 15,915 65.8% Black alone 6,007 24.9% Hispanic 1,135 4.7% Two or more races 639 2.6% White alone 544 2.3% Asian alone 66 0.3% Other race alone
2000 2022
3,286,547 62.1% White alone 1,464,735 27.7% Black alone 227,916 4.3% Hispanic 209,738 4.0% Asian alone 82,946 1.6% Two or more races 13,312 0.3% American Indian alone 9,379 0.2% Other race alone 1,913 0.04% Native Hawaiian and Other
2,906,492 47.1% White alone 1,800,914 29.2% Black alone 705,842 11.4% Hispanic 401,818 6.5% Asian alone 291,317 4.7% Two or more races 46,930 0.8% Other race alone 8,930 0.1% American Indian alone 2,417 0.04% Native Hawaiian and Other
Income and house value in Landover Median household income in 2022 $86,777 White non-Hispanic householders$64,376 Black householders$34,158 Asian householders$62,232 Some other race householders$62,935 Two or more races householders$70,969 Hispanic or Latino race householders
Median age by race in Landover
33.4 Median age for White residents37.2 32.3 40.2 Median age for Black or African American residents40.2 41.0 66.1 Median age for American Indian / Alaska Native residents-888,297,871.5 -689,905,591.2 22.7 Median age for Asian residents36.4 18.5 -571,600,480.8 Median age for Native Hawaiian / Pacific Islander residents-720,061,021.4 -760,942,760.2 23.1 Median age for Other race residents23.7 20.5 25.4 Median age for Two or more races residents28.9 19.8 38.3 Median age for White alone residents47.7 35.5 24.6 Median age for Hispanic or Latino residents25.3 24.1
Owner/renter occupied households by race in Landover
House owners and renters - White residents 268 77.1% Owner occupied80 22.9% Renter occupiedHouse owners and renters - Black or African American residents 2,815 41.5% Owner occupied3,973 58.5% Renter occupiedHouse owners and renters - American Indian / Alaska Native residents 21 100.0% Owner occupiedHouse owners and renters - Asian residents 49 45.4% Owner occupied59 54.6% Renter occupiedHouse owners and renters - Other race residents 747 62.8% Owner occupied443 37.2% Renter occupiedHouse owners and renters - Two or more races residents 223 52.9% Owner occupied199 47.1% Renter occupiedHouse owners and renters - White alone residents 219 80.1% Owner occupied54 19.9% Renter occupiedHouse owners and renters - Hispanic or Latino residents 939 67.4% Owner occupied454 32.6% Renter occupied
Language usage in Landover
English speakers - Total 62.0% of residents of Landover speak English at home.
21.7% of residents speak Spanish at home 2,117 43.8% Speak English very well2,720 56.2% Speak English less than very well16.8% of residents speak other language at home 2,426 64.9% Speak English very well1,311 35.1% Speak English less than very well
English speakers - Born in the United States 89.4% of residents of Landover speak English at home.
7.9% of residents speak Spanish at home 626 88.7% Speak English very well80 11.3% Speak English less than very well2.7% of residents speak other language at home 190 79.8% Speak English very well48 20.2% Speak English less than very well
English speakers - Native, born elsewhere 88.0% of residents of Landover speak English at home.
11.1% of residents speak Spanish at home 24 100.0% Speak English very well
English speakers - Foreign-born 20.9% of residents of Landover speak English at home.
37.9% of residents speak Spanish at home 538 18.1% Speak English very well2,438 81.9% Speak English less than very well40.5% of residents speak other language at home 1,982 62.3% Speak English very well1,197 37.7% Speak English less than very well
White (Caucasian) - Speak only English Native:
77.2% (573)Foreign-born:
8.1% (14)
White (Caucasian) - Speak another language Native:
21.6% (160)Foreign-born:
85.7% (143)
Black or African American - Speak only English Native:
95.3% (10,705)Foreign-born:
31.9% (1,338)
Black or African American - Speak another language Native:
4.9% (546)Foreign-born:
68.8% (2,888)
Asian - Speak only English Native:
23.2% (28)Foreign-born:
26.4% (103)
Asian - Speak another language Native:
86.3% (105)Foreign-born:
76.1% (296)
Other race - Speak only English Native:
16.3% (301)Foreign-born:
2.7% (68)
Other race - Speak another language Native:
83.7% (1,544)Foreign-born:
97.4% (2,472)
Two or more races - Speak only English Native:
93.0% (662)Foreign-born:
17.5% (126)
Two or more races - Speak another language Native:
5.6% (40)Foreign-born:
83.4% (603)
White alone - Speak only English Native:
99.0% (561)Foreign-born:
31.2% (15)
Hispanic or Latino - Speak only English Native:
18.1% (403)Foreign-born:
2.5% (77)
Hispanic or Latino - Speak another language Native:
81.5% (1,821)Foreign-born:
97.7% (3,001)
Foreign-born residents in Landover
Marital status for residents in Landover Marital status - White (Caucasian) population 15 years and over
Males 46.9% Never married50.6% Now married0.0% Separated0.0% Widowed2.5% DivorcedFemales 33.2% Never married56.7% Now married0.0% Separated6.2% Widowed3.8% DivorcedWomen who gave birth in the past 12 months Now married:
61.1% (9)Unmarried:
38.9% (6)
Women who did not give birth in the past 12 months Now married:
59.8% (191)Unmarried:
40.2% (128)
Marital status - Black or African American population 15 years and over
Males 45.4% Never married35.8% Now married4.2% Separated4.6% Widowed10.0% DivorcedFemales 42.5% Never married31.5% Now married4.0% Separated8.7% Widowed13.2% DivorcedWomen who gave birth in the past 12 months Now married:
46.5% (139)Unmarried:
53.5% (160)
Women who did not give birth in the past 12 months Now married:
29.9% (1,169)Unmarried:
70.1% (2,746)
Marital status - American Indian / Alaska Native population 15 years and over
Males 46.2% Never married53.8% Now married0.0% Separated0.0% Widowed0.0% DivorcedFemales 0.0% Never married100.0% Now married0.0% Separated0.0% Widowed0.0% DivorcedMarital status - Asian population 15 years and over
Males 17.6% Never married71.6% Now married0.0% Separated0.0% Widowed10.8% DivorcedFemales 27.0% Never married70.4% Now married2.6% Separated0.0% Widowed0.0% DivorcedWomen who gave birth in the past 12 months Now married:
100.0% (26)Unmarried:
0.0% (0)
Women who did not give birth in the past 12 months Now married:
68.4% (62)Unmarried:
31.6% (29)
Marital status - Other race population 15 years and over
Males 46.0% Never married47.4% Now married5.1% Separated0.0% Widowed1.6% DivorcedFemales 54.2% Never married39.8% Now married3.3% Separated0.0% Widowed2.7% DivorcedWomen who gave birth in the past 12 months Now married:
41.0% (83)Unmarried:
59.0% (120)
Women who did not give birth in the past 12 months Now married:
42.0% (492)Unmarried:
58.0% (679)
Marital status - Two or more races population 15 years and over
Males 31.3% Never married36.9% Now married11.5% Separated9.2% Widowed11.2% DivorcedFemales 54.5% Never married31.5% Now married0.0% Separated4.0% Widowed9.9% DivorcedWomen who gave birth in the past 12 months Now married:
25.5% (15)Unmarried:
74.5% (45)
Women who did not give birth in the past 12 months Now married:
33.5% (90)Unmarried:
66.5% (179)
Marital status - White alone, not Hispanic / Latino population 15 years and over
Males 51.9% Never married44.0% Now married0.0% Separated0.0% Widowed4.1% DivorcedFemales 21.6% Never married62.7% Now married0.0% Separated9.7% Widowed6.0% DivorcedWomen who gave birth in the past 12 months Now married:
100.0% (10)Unmarried:
0.0% (0)
Women who did not give birth in the past 12 months Now married:
74.6% (168)Unmarried:
25.4% (57)
Marital status - Hispanic or Latino population 15 years and over
Males 45.6% Never married50.3% Now married4.0% Separated0.0% Widowed0.0% DivorcedFemales 54.6% Never married42.2% Now married1.4% Separated0.0% Widowed1.8% DivorcedWomen who gave birth in the past 12 months Now married:
39.5% (77)Unmarried:
60.5% (118)
Women who did not give birth in the past 12 months Now married:
39.7% (542)Unmarried:
60.3% (823)
Ancestries in Landover
1,517 9.0% Nigerian829 4.9% African642 3.8% Jamaican536 3.2% Afghan149 0.9% American144 0.9% Ghanaian102 0.6% Liberian90 0.5% Guyanese76 0.5% Iraqi63 0.4% Haitian60 0.4% Trinidadian and Tobagonian51 0.3% Sierra Leonean47 0.3% Italian35 0.2% Barbadian31 0.2% English29 0.2% British West Indian21 0.1% Slavic20 0.1% Irish17 0.1% French16 0.10% German12 0.07% Senegalese10 0.06% Slovak6 0.04% Polish
Children Nativity (place of birth) in Landover
Children under 6 years - Living with two parents Both parents native 33 100.0% NativeBoth parents foreign-born 741 78.6% Native201 21.4% Foreign-bornOne native, one foreign-born parent 93 100.0% NativeChildren under 6 years - Living with one parent Native parent 611 99.9% Native0 0.1% Foreign-bornForeign-born parent 349 77.9% Native99 22.1% Foreign-bornChildren 6 to 17 years - Living with two parents Both parents native 279 99.1% Native3 0.9% Foreign-bornBoth parents foreign-born 1,063 59.5% Native723 40.5% Foreign-bornOne native, one foreign-born parent 288 100.0% NativeChildren 6 to 17 years - Living with one parent Native parent 824 100.0% NativeForeign-born parent 811 61.0% Native518 39.0% Foreign-born
Grandparents responsible for own grandchildren in Landover
Grandparents (30 to 59 years) White / Caucasian 14 100.0% Responsible for grandchildrenBlack or African American 81 39.1% Responsible for grandchildren126 60.9% Not responsible for grandchildrenOther race 46 40.4% Responsible for grandchildren68 59.6% Not responsible for grandchildrenHispanic or Latino 61 46.0% Responsible for grandchildren72 54.0% Not responsible for grandchildrenGrandparents (60 years and over) Black or African American 19 11.5% Responsible for grandchildren143 88.5% Not responsible for grandchildrenOther race 87 100.0% Not responsible for grandchildrenHispanic or Latino 101 100.0% Not responsible for grandchildren