Races in Lancaster, Texas (TX) Detailed Stats
Data:
Races - White alone (%)
Races - White alone (% change since 2000)
Races - Black alone (%)
Races - Black alone (% change since 2000)
Races - American Indian alone (%)
Races - American Indian alone (% change since 2000)
Races - Asian alone (%)
Races - Asian alone (% change since 2000)
Races - Hispanic (%)
Races - Hispanic (% change since 2000)
Races - Native Hawaiian and Other Pacific Islander alone (%)
Races - Native Hawaiian and Other Pacific Islander alone (% change since 2000)
Races - Two or more races(%)
Races - Two or more races(% change since 2000)
Races - Other race alone (%)
Races - Other race alone (% change since 2000)
Racial diversity
Place of birth - Born in state of residence (%)
Place of birth - Born in state of residence (%) - White
Place of birth - Born in state of residence (%) - Black or African American
Place of birth - Born in state of residence (%) - Asian
Place of birth - Born in state of residence (%) - Hispanic or Latino
Place of birth - Born in state of residence (%) - American Indian and Alaska Native
Place of birth - Born in state of residence (%) - Multirace
Place of birth - Born in state of residence (%) - Other Race
Place of birth - Born in other state (%)
Place of birth - Born in other state (%) - White
Place of birth - Born in other state (%) - Black or African American
Place of birth - Born in other state (%) - Asian
Place of birth - Born in other state (%) - Hispanic or Latino
Place of birth - Born in other state (%) - American Indian and Alaska Native
Place of birth - Born in other state (%) - Multirace
Place of birth - Born in other state (%) - Other Race
Place of birth - Native, outside of US (%)
Place of birth - Native, outside of US (%) - White
Place of birth - Native, outside of US (%) - Black or African American
Place of birth - Native, outside of US (%) - Asian
Place of birth - Native, outside of US (%) - Hispanic or Latino
Place of birth - Native, outside of US (%) - American Indian and Alaska Native
Place of birth - Native, outside of US (%) - Multirace
Place of birth - Native, outside of US (%) - Other Race
Place of birth - Foreign born (%)
Place of birth - Foreign born (%) - White
Place of birth - Foreign born (%) - Black or African American
Place of birth - Foreign born (%) - Asian
Place of birth - Foreign born (%) - Hispanic or Latino
Place of birth - Foreign born (%) - American Indian and Alaska Native
Place of birth - Foreign born (%) - Multirace
Place of birth - Foreign born (%) - Other Race
Residents speaking English at home (%)
Residents speaking English at home - Born in the United States (%)
Residents speaking English at home - Native, born elsewhere (%)
Residents speaking English at home - Foreign born (%)
Residents speaking Spanish at home (%)
Residents speaking Spanish at home - Born in the United States (%)
Residents speaking Spanish at home - Native, born elsewhere (%)
Residents speaking Spanish at home - Foreign born (%)
Residents speaking other language at home (%)
Residents speaking other language at home - Born in the United States (%)
Residents speaking other language at home - Native, born elsewhere (%)
Residents speaking other language at home - Foreign born (%)
Marital status - Never married (%)
Marital status - Now married (%)
Marital status - Separated (%)
Marital status - Widowed (%)
Marital status - Divorced (%)
Ancestries Reported - Arab (%)
Ancestries Reported - Czech (%)
Ancestries Reported - Danish (%)
Ancestries Reported - Dutch (%)
Ancestries Reported - English (%)
Ancestries Reported - French (%)
Ancestries Reported - French Canadian (%)
Ancestries Reported - German (%)
Ancestries Reported - Greek (%)
Ancestries Reported - Hungarian (%)
Ancestries Reported - Irish (%)
Ancestries Reported - Italian (%)
Ancestries Reported - Lithuanian (%)
Ancestries Reported - Norwegian (%)
Ancestries Reported - Polish (%)
Ancestries Reported - Portuguese (%)
Ancestries Reported - Russian (%)
Ancestries Reported - Scotch-Irish (%)
Ancestries Reported - Scottish (%)
Ancestries Reported - Slovak (%)
Ancestries Reported - Subsaharan African (%)
Ancestries Reported - Swedish (%)
Ancestries Reported - Swiss (%)
Ancestries Reported - Ukrainian (%)
Ancestries Reported - United States (%)
Ancestries Reported - Welsh (%)
Ancestries Reported - West Indian (%)
Ancestries Reported - Other (%)
Geographical mobility - Same house 1 year ago (%)
Geographical mobility - Same house 1 year ago (%) - White
Geographical mobility - Same house 1 year ago (%) - Black or African American
Geographical mobility - Same house 1 year ago (%) - Asian
Geographical mobility - Same house 1 year ago (%) - Hispanic or Latino
Geographical mobility - Same house 1 year ago (%) - American Indian and Alaska Native
Geographical mobility - Same house 1 year ago (%) - Multirace
Geographical mobility - Same house 1 year ago (%) - Other Race
Geographical mobility - Moved within same county (%)
Geographical mobility - Moved within same county (%) - White
Geographical mobility - Moved within same county (%) - Black or African American
Geographical mobility - Moved within same county (%) - Asian
Geographical mobility - Moved within same county (%) - Hispanic or Latino
Geographical mobility - Moved within same county (%) - American Indian and Alaska Native
Geographical mobility - Moved within same county (%) - Multirace
Geographical mobility - Moved within same county (%) - Other Race
Geographical mobility - Moved from different county within same state (%)
Geographical mobility - Moved from different county within same state (%) - White
Geographical mobility - Moved from different county within same state (%) - Black or African American
Geographical mobility - Moved from different county within same state (%) - Asian
Geographical mobility - Moved from different county within same state (%) - Hispanic or Latino
Geographical mobility - Moved from different county within same state (%) - American Indian and Alaska Native
Geographical mobility - Moved from different county within same state (%) - Multirace
Geographical mobility - Moved from different county within same state (%) - Other Race
Geographical mobility - Moved from different state (%)
Geographical mobility - Moved from different state (%) - White
Geographical mobility - Moved from different state (%) - Black or African American
Geographical mobility - Moved from different state (%) - Asian
Geographical mobility - Moved from different state (%) - Hispanic or Latino
Geographical mobility - Moved from different state (%) - American Indian and Alaska Native
Geographical mobility - Moved from different state (%) - Multirace
Geographical mobility - Moved from different state (%) - Other Race
Geographical mobility - Moved from abroad (%)
Geographical mobility - Moved from abroad (%) - White
Geographical mobility - Moved from abroad (%) - Black or African American
Geographical mobility - Moved from abroad (%) - Asian
Geographical mobility - Moved from abroad (%) - Hispanic or Latino
Geographical mobility - Moved from abroad (%) - American Indian and Alaska Native
Geographical mobility - Moved from abroad (%) - Multirace
Geographical mobility - Moved from abroad (%) - Other Race
Place of birth for the foreign-born population - Ireland (%)
Place of birth for the foreign-born population - Denmark (%)
Place of birth for the foreign-born population - Norway (%)
Place of birth for the foreign-born population - Sweden (%)
Place of birth for the foreign-born population - United Kingdom (%)
Place of birth for the foreign-born population - England (%)
Place of birth for the foreign-born population - Scotland (%)
Place of birth for the foreign-born population - Other Northern Europe (%)
Place of birth for the foreign-born population - Austria (%)
Place of birth for the foreign-born population - Belgium (%)
Place of birth for the foreign-born population - France (%)
Place of birth for the foreign-born population - Germany (%)
Place of birth for the foreign-born population - Netherlands (%)
Place of birth for the foreign-born population - Switzerland (%)
Place of birth for the foreign-born population - Other Western Europe (%)
Place of birth for the foreign-born population - Greece (%)
Place of birth for the foreign-born population - Italy (%)
Place of birth for the foreign-born population - Portugal (%)
Place of birth for the foreign-born population - Spain (%)
Place of birth for the foreign-born population - Other Southern Europe (%)
Place of birth for the foreign-born population - Albania (%)
Place of birth for the foreign-born population - Belarus (%)
Place of birth for the foreign-born population - Bosnia and Herzegovina (%)
Place of birth for the foreign-born population - Bulgaria (%)
Place of birth for the foreign-born population - Croatia (%)
Place of birth for the foreign-born population - Czechoslovakia (%)
Place of birth for the foreign-born population - Hungary (%)
Place of birth for the foreign-born population - Latvia (%)
Place of birth for the foreign-born population - Lithuania (%)
Place of birth for the foreign-born population - North Macedonia (Macedonia) (%)
Place of birth for the foreign-born population - Moldova (%)
Place of birth for the foreign-born population - Poland (%)
Place of birth for the foreign-born population - Romania (%)
Place of birth for the foreign-born population - Russia (%)
Place of birth for the foreign-born population - Serbia (%)
Place of birth for the foreign-born population - Ukraine (%)
Place of birth for the foreign-born population - Other Eastern Europe (%)
Place of birth for the foreign-born population - China (%)
Place of birth for the foreign-born population - Hong Kong (%)
Place of birth for the foreign-born population - Taiwan (%)
Place of birth for the foreign-born population - Japan (%)
Place of birth for the foreign-born population - Korea (%)
Place of birth for the foreign-born population - Other Eastern Asia (%)
Place of birth for the foreign-born population - Afghanistan (%)
Place of birth for the foreign-born population - Bangladesh (%)
Place of birth for the foreign-born population - India (%)
Place of birth for the foreign-born population - Iran (%)
Place of birth for the foreign-born population - Kazakhstan (%)
Place of birth for the foreign-born population - Nepal (%)
Place of birth for the foreign-born population - Pakistan (%)
Place of birth for the foreign-born population - Sri Lanka (%)
Place of birth for the foreign-born population - Uzbekistan (%)
Place of birth for the foreign-born population - Other South Central Asia (%)
Place of birth for the foreign-born population - Burma (%)
Place of birth for the foreign-born population - Cambodia (%)
Place of birth for the foreign-born population - Indonesia (%)
Place of birth for the foreign-born population - Laos (%)
Place of birth for the foreign-born population - Malaysia (%)
Place of birth for the foreign-born population - Philippines (%)
Place of birth for the foreign-born population - Singapore (%)
Place of birth for the foreign-born population - Thailand (%)
Place of birth for the foreign-born population - Vietnam (%)
Place of birth for the foreign-born population - Other South Eastern Asia (%)
Place of birth for the foreign-born population - Armenia (%)
Place of birth for the foreign-born population - Iraq (%)
Place of birth for the foreign-born population - Israel (%)
Place of birth for the foreign-born population - Jordan (%)
Place of birth for the foreign-born population - Kuwait (%)
Place of birth for the foreign-born population - Lebanon (%)
Place of birth for the foreign-born population - Saudi Arabia (%)
Place of birth for the foreign-born population - Syria (%)
Place of birth for the foreign-born population - Turkey (%)
Place of birth for the foreign-born population - Yemen (%)
Place of birth for the foreign-born population - Other Western Asia (%)
Place of birth for the foreign-born population - Eritrea (%)
Place of birth for the foreign-born population - Ethiopia (%)
Place of birth for the foreign-born population - Kenya (%)
Place of birth for the foreign-born population - Somalia (%)
Place of birth for the foreign-born population - Uganda (%)
Place of birth for the foreign-born population - Zimbabwe (%)
Place of birth for the foreign-born population - Other Eastern Africa (%)
Place of birth for the foreign-born population - Cameroon (%)
Place of birth for the foreign-born population - Congo (%)
Place of birth for the foreign-born population - Democratic Republic of Congo (Zaire) (%)
Place of birth for the foreign-born population - Other Middle Africa (%)
Place of birth for the foreign-born population - Egypt (%)
Place of birth for the foreign-born population - Morocco (%)
Place of birth for the foreign-born population - Sudan (%)
Place of birth for the foreign-born population - Other Northern Africa (%)
Place of birth for the foreign-born population - South Africa (%)
Place of birth for the foreign-born population - Other Southern Africa (%)
Place of birth for the foreign-born population - Cabo Verde (%)
Place of birth for the foreign-born population - Ghana (%)
Place of birth for the foreign-born population - Liberia (%)
Place of birth for the foreign-born population - Nigeria (%)
Place of birth for the foreign-born population - Senegal (%)
Place of birth for the foreign-born population - Sierra Leone (%)
Place of birth for the foreign-born population - Other Western Africa (%)
Place of birth for the foreign-born population - Australia (%)
Place of birth for the foreign-born population - New Zealand (%)
Place of birth for the foreign-born population - Fiji (%)
Place of birth for the foreign-born population - Micronesia (%)
Place of birth for the foreign-born population - Bahamas (%)
Place of birth for the foreign-born population - Barbados (%)
Place of birth for the foreign-born population - Cuba (%)
Place of birth for the foreign-born population - Dominica (%)
Place of birth for the foreign-born population - Dominican Republic (%)
Place of birth for the foreign-born population - Grenada (%)
Place of birth for the foreign-born population - Haiti (%)
Place of birth for the foreign-born population - Jamaica (%)
Place of birth for the foreign-born population - St. Vincent and the Grenadines (%)
Place of birth for the foreign-born population - Trinidad and Tobago (%)
Place of birth for the foreign-born population - West Indies (%)
Place of birth for the foreign-born population - Other Caribbean (%)
Place of birth for the foreign-born population - Belize (%)
Place of birth for the foreign-born population - Costa Rica (%)
Place of birth for the foreign-born population - El Salvador (%)
Place of birth for the foreign-born population - Guatemala (%)
Place of birth for the foreign-born population - Honduras (%)
Place of birth for the foreign-born population - Mexico (%)
Place of birth for the foreign-born population - Nicaragua (%)
Place of birth for the foreign-born population - Panama (%)
Place of birth for the foreign-born population - Other Central America (%)
Place of birth for the foreign-born population - Argentina (%)
Place of birth for the foreign-born population - Bolivia (%)
Place of birth for the foreign-born population - Brazil (%)
Place of birth for the foreign-born population - Chile (%)
Place of birth for the foreign-born population - Colombia (%)
Place of birth for the foreign-born population - Ecuador (%)
Place of birth for the foreign-born population - Guyana (%)
Place of birth for the foreign-born population - Peru (%)
Place of birth for the foreign-born population - Uruguay (%)
Place of birth for the foreign-born population - Venezuela (%)
Place of birth for the foreign-born population - Other South America (%)
Place of birth for the foreign-born population - Canada (%)
Place of birth for the foreign-born population - Other Northern America (%)
Place of birth for the foreign-born population - Other (%)
Latest news about races in Lancaster, TX collected exclusively by city-data.com from local newspapers, TV, and radio stations
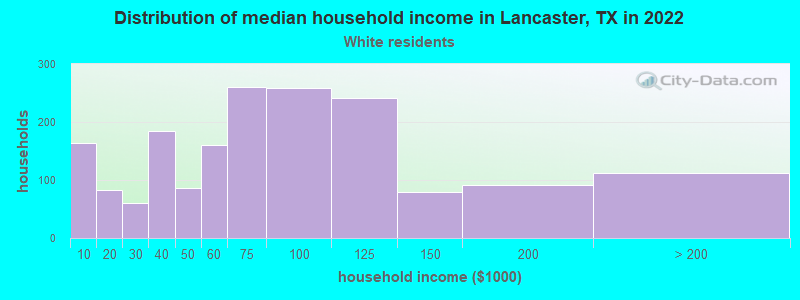
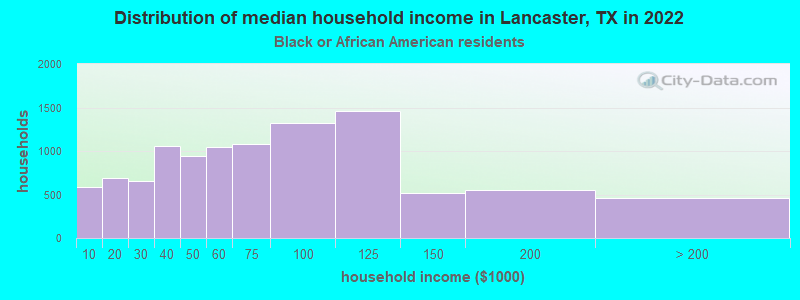
According to 2022 data, the most numerous races in Lancaster, TX are Hispanic (8,967 residents), White alone (3,549 residents), and Black alone (27,058 residents). 80.7% of Lancaster residents speak English at home. 6.3% of Lancaster, TX residents are foreign-born (5.3% born in Latin America), which is 171.1% less than the foreign-born rate of 17.0% across the entire state of Texas.
Race distribution in Lancaster
2000 2022
10,933,313 52.4% White alone 6,669,666 32.0% Hispanic 2,364,255 11.3% Black alone 554,445 2.7% Asian alone 230,567 1.1% Two or more races 68,859 0.3% American Indian alone 19,958 0.10% Other race alone 10,757 0.05% Native Hawaiian and Other
12,070,642 40.2% Hispanic 11,683,430 38.9% White alone 3,508,706 11.7% Black alone 1,608,173 5.4% Asian alone 956,560 3.2% Two or more races 125,763 0.4% Other race alone 47,023 0.2% American Indian alone 29,275 0.10% Native Hawaiian and Other
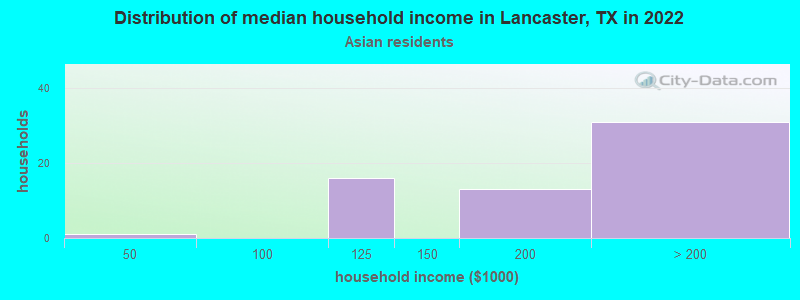
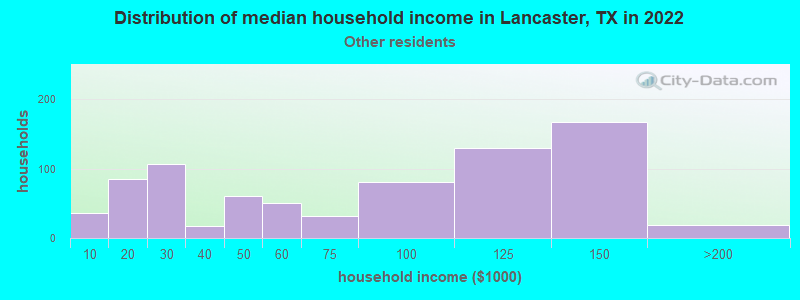
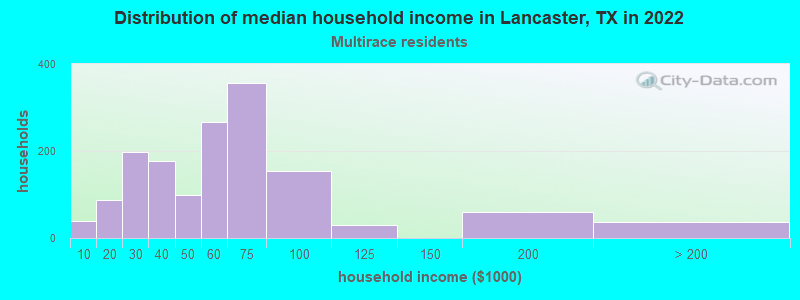
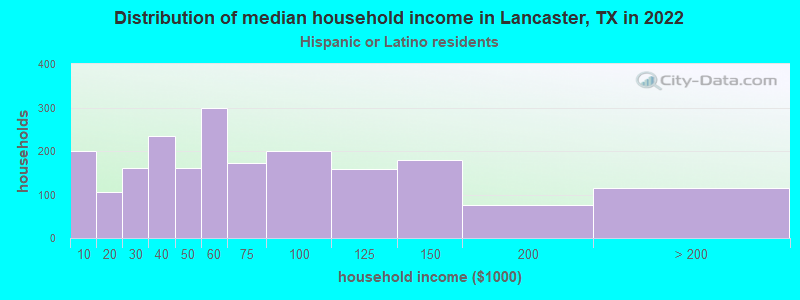
Income and house value in Lancaster Median household income in 2022 $70,586 White non-Hispanic householders$62,143 Black householdersover $200,000 Asian householders$64,526 Some other race householders$51,211 Two or more races householders$53,449 Hispanic or Latino race householdersMedian 2022 house value $214,454 White Non-Hispanic householders$255,435 Black or African American householders$475,128 American Indian or Alaska Native householders $200,281 Asian householders$189,188 Some other race householders$294,567 Two or more races householders$198,740 Hispanic or Latino householders
Median age by race in Lancaster
37.4 Median age for White residents36.5 38.6 31.3 Median age for Black or African American residents28.0 32.8 18.2 Median age for American Indian / Alaska Native residents-670,422,534.5 -820,846,904.7 43.3 Median age for Asian residents40.8 43.8 -711,469,533.3 Median age for Native Hawaiian / Pacific Islander residents-815,813,116.9 -464,594,127.3 23.8 Median age for Other race residents20.6 24.7 35.4 Median age for Two or more races residents35.9 32.9 54.7 Median age for White alone residents51.6 58.6 25.5 Median age for Hispanic or Latino residents25.5 25.5
Owner/renter occupied households by race in Lancaster
House owners and renters - White residents 1,651 88.1% Owner occupied222 11.9% Renter occupiedHouse owners and renters - Black or African American residents 5,912 55.6% Owner occupied4,729 44.4% Renter occupiedHouse owners and renters - American Indian / Alaska Native residents 12 100.0% Renter occupiedHouse owners and renters - Asian residents 30 53.4% Owner occupied26 46.6% Renter occupiedHouse owners and renters - Other race residents 658 82.2% Owner occupied142 17.8% Renter occupiedHouse owners and renters - Two or more races residents 1,204 80.8% Owner occupied287 19.2% Renter occupiedHouse owners and renters - White alone residents 1,139 83.2% Owner occupied229 16.8% Renter occupiedHouse owners and renters - Hispanic or Latino residents 1,839 88.0% Owner occupied250 12.0% Renter occupied
Language usage in Lancaster
English speakers - Total 80.7% of residents of Lancaster speak English at home.
18.7% of residents speak Spanish at home 4,258 61.7% Speak English very well2,643 38.3% Speak English less than very well0.9% of residents speak other language at home 188 57.5% Speak English very well139 42.5% Speak English less than very well
English speakers - Born in the United States 88.8% of residents of Lancaster speak English at home.
10.3% of residents speak Spanish at home 927 100.0% Speak English very well0.4% of residents speak other language at home 17 45.9% Speak English very well20 54.1% Speak English less than very well
English speakers - Native, born elsewhere 56.0% of residents of Lancaster speak English at home.
34.6% of residents speak Spanish at home 136 100.0% Speak English very well
English speakers - Foreign-born 8.0% of residents of Lancaster speak English at home.
82.8% of residents speak Spanish at home 640 31.7% Speak English very well1,379 68.3% Speak English less than very well8.7% of residents speak other language at home 92 43.2% Speak English very well121 56.8% Speak English less than very well
White (Caucasian) - Speak only English Native:
74.2% (3,708)Foreign-born:
5.1% (16)
White (Caucasian) - Speak another language Native:
18.7% (933)Foreign-born:
85.5% (263)
Black or African American - Speak only English Native:
98.5% (24,051)Foreign-born:
26.8% (57)
Black or African American - Speak another language Native:
1.6% (401)Foreign-born:
72.9% (156)
Asian - Speak only English Native:
73.3% (134)Foreign-born:
39.0% (52)
Asian - Speak another language Native:
23.1% (42)Foreign-born:
59.7% (79)
Other race - Speak only English Native:
12.3% (220)Foreign-born:
2.5% (27)
Other race - Speak another language Native:
87.4% (1,558)Foreign-born:
97.5% (1,080)
Two or more races - Speak only English Native:
39.1% (1,379)Foreign-born:
5.7% (66)
Two or more races - Speak another language Native:
61.4% (2,168)Foreign-born:
94.3% (1,088)
White alone - Speak only English Native:
100.0% (3,423)Foreign-born:
100.0% (17)
Hispanic or Latino - Speak only English Native:
17.4% (989)Foreign-born:
3.3% (69)
Hispanic or Latino - Speak another language Native:
82.0% (4,654)Foreign-born:
96.4% (2,016)
Foreign-born residents in Lancaster 2,565 residents are foreign born (5.3% Latin America ).
This city:
6.3%Texas:
17.1%
Marital status for residents in Lancaster Marital status - White (Caucasian) population 15 years and over
Males 27.6% Never married58.8% Now married1.2% Separated4.5% Widowed7.9% DivorcedFemales 25.4% Never married54.4% Now married2.7% Separated9.3% Widowed8.2% DivorcedWomen who gave birth in the past 12 months Now married:
100.0% (162)Unmarried:
0.0% (0)
Women who did not give birth in the past 12 months Now married:
47.1% (373)Unmarried:
52.9% (419)
Marital status - Black or African American population 15 years and over
Males 40.2% Never married45.5% Now married1.7% Separated0.9% Widowed11.6% DivorcedFemales 41.7% Never married31.4% Now married1.9% Separated5.3% Widowed19.7% DivorcedWomen who gave birth in the past 12 months Now married:
62.3% (508)Unmarried:
37.7% (307)
Women who did not give birth in the past 12 months Now married:
29.9% (2,198)Unmarried:
70.1% (5,142)
Marital status - Asian population 15 years and over
Males 0.0% Never married100.0% Now married0.0% Separated0.0% Widowed0.0% DivorcedFemales 0.0% Never married37.6% Now married0.0% Separated27.6% Widowed34.8% DivorcedWomen who did not give birth in the past 12 months Now married:
77.5% (62)Unmarried:
22.5% (18)
Marital status - Other race population 15 years and over
Males 46.2% Never married49.5% Now married0.0% Separated2.1% Widowed2.2% DivorcedFemales 29.0% Never married49.7% Now married10.5% Separated10.8% Widowed0.0% DivorcedWomen who gave birth in the past 12 months Now married:
100.0% (83)Unmarried:
0.0% (0)
Women who did not give birth in the past 12 months Now married:
57.7% (492)Unmarried:
42.3% (360)
Marital status - Two or more races population 15 years and over
Males 32.8% Never married62.0% Now married3.9% Separated0.0% Widowed1.3% DivorcedFemales 24.7% Never married42.7% Now married3.1% Separated14.4% Widowed15.0% DivorcedWomen who gave birth in the past 12 months Now married:
100.0% (79)Unmarried:
0.0% (0)
Women who did not give birth in the past 12 months Now married:
42.8% (480)Unmarried:
57.2% (641)
Marital status - White alone, not Hispanic / Latino population 15 years and over
Males 24.6% Never married55.2% Now married2.0% Separated7.5% Widowed10.8% DivorcedFemales 15.1% Never married54.7% Now married2.8% Separated13.8% Widowed13.8% DivorcedWomen who gave birth in the past 12 months Now married:
100.0% (62)Unmarried:
0.0% (0)
Women who did not give birth in the past 12 months Now married:
49.0% (215)Unmarried:
51.0% (224)
Marital status - Hispanic or Latino population 15 years and over
Males 37.8% Never married59.8% Now married0.0% Separated0.5% Widowed1.9% DivorcedFemales 32.9% Never married54.1% Now married5.7% Separated4.5% Widowed2.8% DivorcedWomen who gave birth in the past 12 months Now married:
100.0% (292)Unmarried:
0.0% (0)
Women who did not give birth in the past 12 months Now married:
50.4% (913)Unmarried:
49.6% (899)
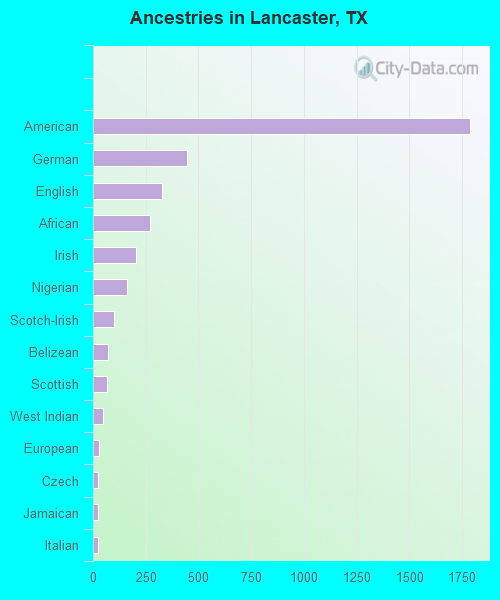
Ancestries in Lancaster
1,789 6.2% American447 1.6% German328 1.1% English272 0.9% African203 0.7% Irish161 0.6% Nigerian100 0.3% Scotch-Irish71 0.2% Belizean65 0.2% Scottish47 0.2% West Indian28 0.10% European23 0.08% Czech23 0.08% Jamaican22 0.08% Italian9 0.03% Dutch West Indian8 0.03% Guyanese5 0.02% Czechoslovakian5 0.02% Polish
Geographical mobility in Lancaster Same house 1 year ago 4,029 76.4% White (Caucasian)22,238 82.4% Black or African American47 100.0% American Indian / Alaska Native107 35.6% Asian2,971 93.9% Other race4,618 89.0% Two or more races3,093 88.4% White alone, not Hispanic / Latino7,050 80.5% Hispanic or LatinoMoved within same county 759 14.4% White / Caucasian3,821 14.2% Black or African American122 40.6% Asian57 1.8% Other race439 8.5% Two or more races275 7.8% White alone, not Hispanic / Latino957 10.9% Hispanic or LatinoMoved within same state 323 6.1% White / Caucasian494 1.8% Black or African American10 3.2% Asian158 5.0% Other race12 0.4% White alone, not Hispanic / Latino479 5.5% Hispanic or LatinoMoved from different state 71 1.3% White / Caucasian338 1.3% Black or African American78 2.2% White alone, not Hispanic / LatinoMoved from abroad 73 1.4% White161 3.1% Two or more races39 1.1% White alone, not Hispanic / Latino247 2.8% Hispanic or Latino
Children Nativity (place of birth) in Lancaster
Children under 6 years - Living with two parents Both parents native 1,991 100.0% NativeBoth parents foreign-born 144 100.0% NativeOne native, one foreign-born parent 299 100.0% NativeChildren under 6 years - Living with one parent Native parent 1,983 100.0% NativeForeign-born parent 119 100.0% NativeChildren 6 to 17 years - Living with two parents Both parents native 2,351 99.8% Native4 0.2% Foreign-bornBoth parents foreign-born 612 83.9% Native117 16.1% Foreign-bornOne native, one foreign-born parent 361 100.0% NativeChildren 6 to 17 years - Living with one parent Native parent 3,478 100.0% NativeForeign-born parent 287 52.5% Native259 47.5% Foreign-born
Grandparents responsible for own grandchildren in Lancaster
Grandparents (30 to 59 years) White / Caucasian 33 56.5% Responsible for grandchildren26 43.5% Not responsible for grandchildrenBlack or African American 268 59.9% Responsible for grandchildren179 40.1% Not responsible for grandchildrenOther race 16 46.1% Responsible for grandchildren19 53.9% Not responsible for grandchildrenTwo or more races 246 100.0% Not responsible for grandchildrenWhite alone, not Hispanic / Latino 33 100.0% Not responsible for grandchildrenHispanic or Latino 79 35.4% Responsible for grandchildren144 64.6% Not responsible for grandchildrenGrandparents (60 years and over) White / Caucasian 64 100.0% Not responsible for grandchildrenBlack or African American 13 4.1% Responsible for grandchildren307 95.9% Not responsible for grandchildrenTwo or more races 58 100.0% Responsible for grandchildrenWhite alone, not Hispanic / Latino 114 100.0% Not responsible for grandchildrenHispanic or Latino 66 91.9% Responsible for grandchildren6 8.1% Not responsible for grandchildren