Races in Lakewood, Washington (WA) Detailed Stats
Data:
Races - White alone (%)
Races - White alone (% change since 2000)
Races - Black alone (%)
Races - Black alone (% change since 2000)
Races - American Indian alone (%)
Races - American Indian alone (% change since 2000)
Races - Asian alone (%)
Races - Asian alone (% change since 2000)
Races - Hispanic (%)
Races - Hispanic (% change since 2000)
Races - Native Hawaiian and Other Pacific Islander alone (%)
Races - Native Hawaiian and Other Pacific Islander alone (% change since 2000)
Races - Two or more races(%)
Races - Two or more races(% change since 2000)
Races - Other race alone (%)
Races - Other race alone (% change since 2000)
Racial diversity
Place of birth - Born in state of residence (%)
Place of birth - Born in state of residence (%) - White
Place of birth - Born in state of residence (%) - Black or African American
Place of birth - Born in state of residence (%) - Asian
Place of birth - Born in state of residence (%) - Hispanic or Latino
Place of birth - Born in state of residence (%) - American Indian and Alaska Native
Place of birth - Born in state of residence (%) - Multirace
Place of birth - Born in state of residence (%) - Other Race
Place of birth - Born in other state (%)
Place of birth - Born in other state (%) - White
Place of birth - Born in other state (%) - Black or African American
Place of birth - Born in other state (%) - Asian
Place of birth - Born in other state (%) - Hispanic or Latino
Place of birth - Born in other state (%) - American Indian and Alaska Native
Place of birth - Born in other state (%) - Multirace
Place of birth - Born in other state (%) - Other Race
Place of birth - Native, outside of US (%)
Place of birth - Native, outside of US (%) - White
Place of birth - Native, outside of US (%) - Black or African American
Place of birth - Native, outside of US (%) - Asian
Place of birth - Native, outside of US (%) - Hispanic or Latino
Place of birth - Native, outside of US (%) - American Indian and Alaska Native
Place of birth - Native, outside of US (%) - Multirace
Place of birth - Native, outside of US (%) - Other Race
Place of birth - Foreign born (%)
Place of birth - Foreign born (%) - White
Place of birth - Foreign born (%) - Black or African American
Place of birth - Foreign born (%) - Asian
Place of birth - Foreign born (%) - Hispanic or Latino
Place of birth - Foreign born (%) - American Indian and Alaska Native
Place of birth - Foreign born (%) - Multirace
Place of birth - Foreign born (%) - Other Race
Residents speaking English at home (%)
Residents speaking English at home - Born in the United States (%)
Residents speaking English at home - Native, born elsewhere (%)
Residents speaking English at home - Foreign born (%)
Residents speaking Spanish at home (%)
Residents speaking Spanish at home - Born in the United States (%)
Residents speaking Spanish at home - Native, born elsewhere (%)
Residents speaking Spanish at home - Foreign born (%)
Residents speaking other language at home (%)
Residents speaking other language at home - Born in the United States (%)
Residents speaking other language at home - Native, born elsewhere (%)
Residents speaking other language at home - Foreign born (%)
Marital status - Never married (%)
Marital status - Now married (%)
Marital status - Separated (%)
Marital status - Widowed (%)
Marital status - Divorced (%)
Ancestries Reported - Arab (%)
Ancestries Reported - Czech (%)
Ancestries Reported - Danish (%)
Ancestries Reported - Dutch (%)
Ancestries Reported - English (%)
Ancestries Reported - French (%)
Ancestries Reported - French Canadian (%)
Ancestries Reported - German (%)
Ancestries Reported - Greek (%)
Ancestries Reported - Hungarian (%)
Ancestries Reported - Irish (%)
Ancestries Reported - Italian (%)
Ancestries Reported - Lithuanian (%)
Ancestries Reported - Norwegian (%)
Ancestries Reported - Polish (%)
Ancestries Reported - Portuguese (%)
Ancestries Reported - Russian (%)
Ancestries Reported - Scotch-Irish (%)
Ancestries Reported - Scottish (%)
Ancestries Reported - Slovak (%)
Ancestries Reported - Subsaharan African (%)
Ancestries Reported - Swedish (%)
Ancestries Reported - Swiss (%)
Ancestries Reported - Ukrainian (%)
Ancestries Reported - United States (%)
Ancestries Reported - Welsh (%)
Ancestries Reported - West Indian (%)
Ancestries Reported - Other (%)
Geographical mobility - Same house 1 year ago (%)
Geographical mobility - Same house 1 year ago (%) - White
Geographical mobility - Same house 1 year ago (%) - Black or African American
Geographical mobility - Same house 1 year ago (%) - Asian
Geographical mobility - Same house 1 year ago (%) - Hispanic or Latino
Geographical mobility - Same house 1 year ago (%) - American Indian and Alaska Native
Geographical mobility - Same house 1 year ago (%) - Multirace
Geographical mobility - Same house 1 year ago (%) - Other Race
Geographical mobility - Moved within same county (%)
Geographical mobility - Moved within same county (%) - White
Geographical mobility - Moved within same county (%) - Black or African American
Geographical mobility - Moved within same county (%) - Asian
Geographical mobility - Moved within same county (%) - Hispanic or Latino
Geographical mobility - Moved within same county (%) - American Indian and Alaska Native
Geographical mobility - Moved within same county (%) - Multirace
Geographical mobility - Moved within same county (%) - Other Race
Geographical mobility - Moved from different county within same state (%)
Geographical mobility - Moved from different county within same state (%) - White
Geographical mobility - Moved from different county within same state (%) - Black or African American
Geographical mobility - Moved from different county within same state (%) - Asian
Geographical mobility - Moved from different county within same state (%) - Hispanic or Latino
Geographical mobility - Moved from different county within same state (%) - American Indian and Alaska Native
Geographical mobility - Moved from different county within same state (%) - Multirace
Geographical mobility - Moved from different county within same state (%) - Other Race
Geographical mobility - Moved from different state (%)
Geographical mobility - Moved from different state (%) - White
Geographical mobility - Moved from different state (%) - Black or African American
Geographical mobility - Moved from different state (%) - Asian
Geographical mobility - Moved from different state (%) - Hispanic or Latino
Geographical mobility - Moved from different state (%) - American Indian and Alaska Native
Geographical mobility - Moved from different state (%) - Multirace
Geographical mobility - Moved from different state (%) - Other Race
Geographical mobility - Moved from abroad (%)
Geographical mobility - Moved from abroad (%) - White
Geographical mobility - Moved from abroad (%) - Black or African American
Geographical mobility - Moved from abroad (%) - Asian
Geographical mobility - Moved from abroad (%) - Hispanic or Latino
Geographical mobility - Moved from abroad (%) - American Indian and Alaska Native
Geographical mobility - Moved from abroad (%) - Multirace
Geographical mobility - Moved from abroad (%) - Other Race
Place of birth for the foreign-born population - Ireland (%)
Place of birth for the foreign-born population - Denmark (%)
Place of birth for the foreign-born population - Norway (%)
Place of birth for the foreign-born population - Sweden (%)
Place of birth for the foreign-born population - United Kingdom (%)
Place of birth for the foreign-born population - England (%)
Place of birth for the foreign-born population - Scotland (%)
Place of birth for the foreign-born population - Other Northern Europe (%)
Place of birth for the foreign-born population - Austria (%)
Place of birth for the foreign-born population - Belgium (%)
Place of birth for the foreign-born population - France (%)
Place of birth for the foreign-born population - Germany (%)
Place of birth for the foreign-born population - Netherlands (%)
Place of birth for the foreign-born population - Switzerland (%)
Place of birth for the foreign-born population - Other Western Europe (%)
Place of birth for the foreign-born population - Greece (%)
Place of birth for the foreign-born population - Italy (%)
Place of birth for the foreign-born population - Portugal (%)
Place of birth for the foreign-born population - Spain (%)
Place of birth for the foreign-born population - Other Southern Europe (%)
Place of birth for the foreign-born population - Albania (%)
Place of birth for the foreign-born population - Belarus (%)
Place of birth for the foreign-born population - Bosnia and Herzegovina (%)
Place of birth for the foreign-born population - Bulgaria (%)
Place of birth for the foreign-born population - Croatia (%)
Place of birth for the foreign-born population - Czechoslovakia (%)
Place of birth for the foreign-born population - Hungary (%)
Place of birth for the foreign-born population - Latvia (%)
Place of birth for the foreign-born population - Lithuania (%)
Place of birth for the foreign-born population - North Macedonia (Macedonia) (%)
Place of birth for the foreign-born population - Moldova (%)
Place of birth for the foreign-born population - Poland (%)
Place of birth for the foreign-born population - Romania (%)
Place of birth for the foreign-born population - Russia (%)
Place of birth for the foreign-born population - Serbia (%)
Place of birth for the foreign-born population - Ukraine (%)
Place of birth for the foreign-born population - Other Eastern Europe (%)
Place of birth for the foreign-born population - China (%)
Place of birth for the foreign-born population - Hong Kong (%)
Place of birth for the foreign-born population - Taiwan (%)
Place of birth for the foreign-born population - Japan (%)
Place of birth for the foreign-born population - Korea (%)
Place of birth for the foreign-born population - Other Eastern Asia (%)
Place of birth for the foreign-born population - Afghanistan (%)
Place of birth for the foreign-born population - Bangladesh (%)
Place of birth for the foreign-born population - India (%)
Place of birth for the foreign-born population - Iran (%)
Place of birth for the foreign-born population - Kazakhstan (%)
Place of birth for the foreign-born population - Nepal (%)
Place of birth for the foreign-born population - Pakistan (%)
Place of birth for the foreign-born population - Sri Lanka (%)
Place of birth for the foreign-born population - Uzbekistan (%)
Place of birth for the foreign-born population - Other South Central Asia (%)
Place of birth for the foreign-born population - Burma (%)
Place of birth for the foreign-born population - Cambodia (%)
Place of birth for the foreign-born population - Indonesia (%)
Place of birth for the foreign-born population - Laos (%)
Place of birth for the foreign-born population - Malaysia (%)
Place of birth for the foreign-born population - Philippines (%)
Place of birth for the foreign-born population - Singapore (%)
Place of birth for the foreign-born population - Thailand (%)
Place of birth for the foreign-born population - Vietnam (%)
Place of birth for the foreign-born population - Other South Eastern Asia (%)
Place of birth for the foreign-born population - Armenia (%)
Place of birth for the foreign-born population - Iraq (%)
Place of birth for the foreign-born population - Israel (%)
Place of birth for the foreign-born population - Jordan (%)
Place of birth for the foreign-born population - Kuwait (%)
Place of birth for the foreign-born population - Lebanon (%)
Place of birth for the foreign-born population - Saudi Arabia (%)
Place of birth for the foreign-born population - Syria (%)
Place of birth for the foreign-born population - Turkey (%)
Place of birth for the foreign-born population - Yemen (%)
Place of birth for the foreign-born population - Other Western Asia (%)
Place of birth for the foreign-born population - Eritrea (%)
Place of birth for the foreign-born population - Ethiopia (%)
Place of birth for the foreign-born population - Kenya (%)
Place of birth for the foreign-born population - Somalia (%)
Place of birth for the foreign-born population - Uganda (%)
Place of birth for the foreign-born population - Zimbabwe (%)
Place of birth for the foreign-born population - Other Eastern Africa (%)
Place of birth for the foreign-born population - Cameroon (%)
Place of birth for the foreign-born population - Congo (%)
Place of birth for the foreign-born population - Democratic Republic of Congo (Zaire) (%)
Place of birth for the foreign-born population - Other Middle Africa (%)
Place of birth for the foreign-born population - Egypt (%)
Place of birth for the foreign-born population - Morocco (%)
Place of birth for the foreign-born population - Sudan (%)
Place of birth for the foreign-born population - Other Northern Africa (%)
Place of birth for the foreign-born population - South Africa (%)
Place of birth for the foreign-born population - Other Southern Africa (%)
Place of birth for the foreign-born population - Cabo Verde (%)
Place of birth for the foreign-born population - Ghana (%)
Place of birth for the foreign-born population - Liberia (%)
Place of birth for the foreign-born population - Nigeria (%)
Place of birth for the foreign-born population - Senegal (%)
Place of birth for the foreign-born population - Sierra Leone (%)
Place of birth for the foreign-born population - Other Western Africa (%)
Place of birth for the foreign-born population - Australia (%)
Place of birth for the foreign-born population - New Zealand (%)
Place of birth for the foreign-born population - Fiji (%)
Place of birth for the foreign-born population - Micronesia (%)
Place of birth for the foreign-born population - Bahamas (%)
Place of birth for the foreign-born population - Barbados (%)
Place of birth for the foreign-born population - Cuba (%)
Place of birth for the foreign-born population - Dominica (%)
Place of birth for the foreign-born population - Dominican Republic (%)
Place of birth for the foreign-born population - Grenada (%)
Place of birth for the foreign-born population - Haiti (%)
Place of birth for the foreign-born population - Jamaica (%)
Place of birth for the foreign-born population - St. Vincent and the Grenadines (%)
Place of birth for the foreign-born population - Trinidad and Tobago (%)
Place of birth for the foreign-born population - West Indies (%)
Place of birth for the foreign-born population - Other Caribbean (%)
Place of birth for the foreign-born population - Belize (%)
Place of birth for the foreign-born population - Costa Rica (%)
Place of birth for the foreign-born population - El Salvador (%)
Place of birth for the foreign-born population - Guatemala (%)
Place of birth for the foreign-born population - Honduras (%)
Place of birth for the foreign-born population - Mexico (%)
Place of birth for the foreign-born population - Nicaragua (%)
Place of birth for the foreign-born population - Panama (%)
Place of birth for the foreign-born population - Other Central America (%)
Place of birth for the foreign-born population - Argentina (%)
Place of birth for the foreign-born population - Bolivia (%)
Place of birth for the foreign-born population - Brazil (%)
Place of birth for the foreign-born population - Chile (%)
Place of birth for the foreign-born population - Colombia (%)
Place of birth for the foreign-born population - Ecuador (%)
Place of birth for the foreign-born population - Guyana (%)
Place of birth for the foreign-born population - Peru (%)
Place of birth for the foreign-born population - Uruguay (%)
Place of birth for the foreign-born population - Venezuela (%)
Place of birth for the foreign-born population - Other South America (%)
Place of birth for the foreign-born population - Canada (%)
Place of birth for the foreign-born population - Other Northern America (%)
Place of birth for the foreign-born population - Other (%)
Latest news about races in Lakewood, WA collected exclusively by city-data.com from local newspapers, TV, and radio stations
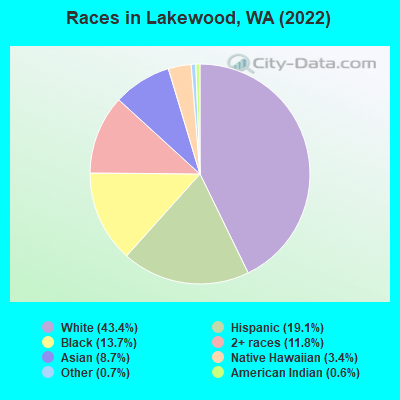
According to 2022 data, the most numerous races in Lakewood, WA are White alone (27,681 residents), Hispanic (12,175 residents), and Asian alone (5,544 residents). 76.2% of Lakewood residents speak English at home. 15.9% of Lakewood, WA residents are foreign-born (6.9% born in Asia, 5.7% born in Latin America), which is 5.5% greater than the foreign-born rate of 15.0% across the entire state of Washington.
Race distribution in Lakewood
2000 2022
35,829 61.6% White alone 6,890 11.8% Black alone 5,144 8.8% Asian alone 4,941 8.5% Hispanic 3,432 5.9% Two or more races 1,032 1.8% Native Hawaiian and Other 764 1.3% American Indian alone 179 0.3% Other race alone
27,681 43.4% White alone 12,175 19.1% Hispanic 8,735 13.7% Black alone 7,532 11.8% Two or more races 5,544 8.7% Asian alone 2,160 3.4% Native Hawaiian and Other 476 0.7% Other race alone 380 0.6% American Indian alone
2000 2022
4,652,490 78.9% White alone 441,509 7.5% Hispanic 319,401 5.4% Asian alone 184,631 3.1% Black alone 175,926 3.0% Two or more races 85,396 1.4% American Indian alone 22,779 0.4% Native Hawaiian and Other 11,989 0.2% Other race alone
4,941,456 63.5% White alone 1,093,313 14.0% Hispanic 755,832 9.7% Asian alone 523,448 6.7% Two or more races 299,537 3.8% Black alone 69,024 0.9% American Indian alone 52,231 0.7% Native Hawaiian and Other 50,945 0.7% Other race alone
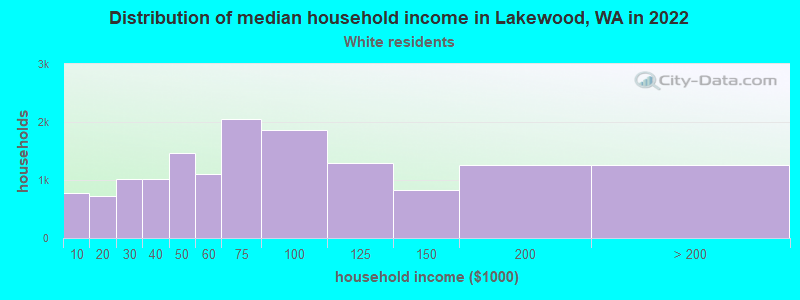
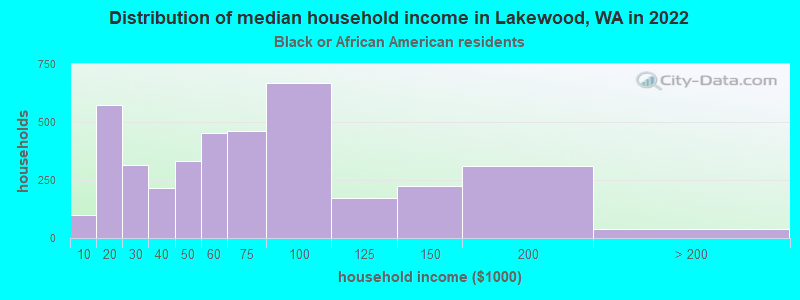
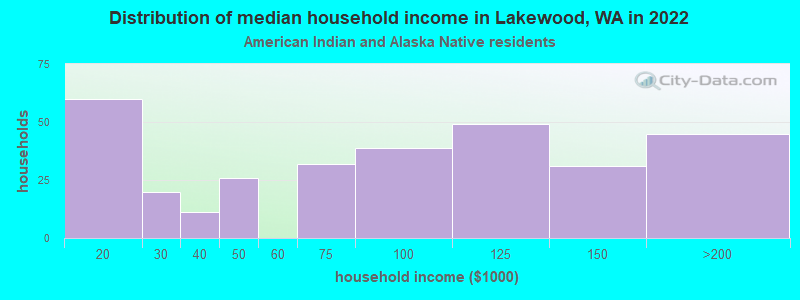
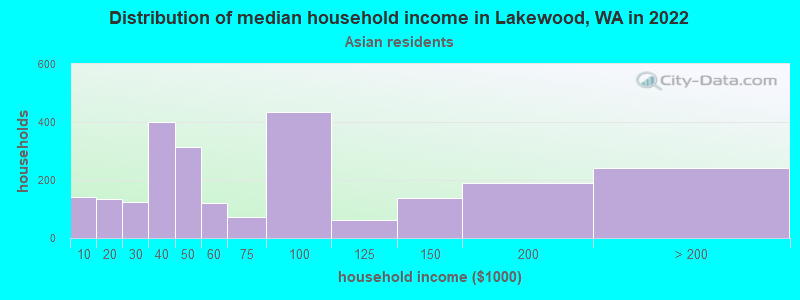
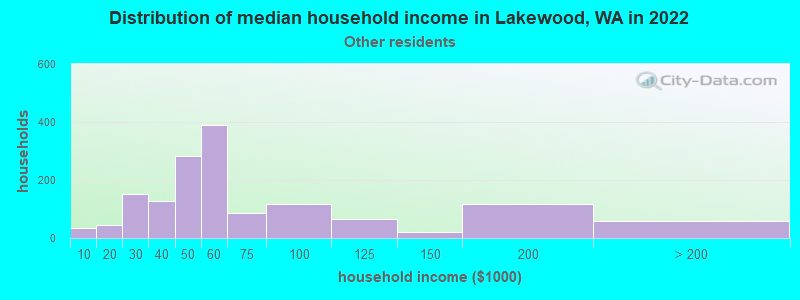
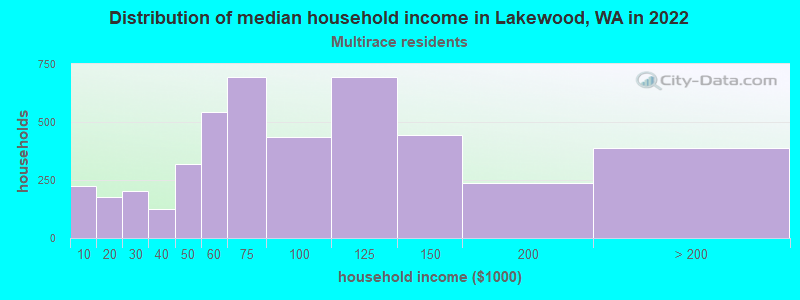
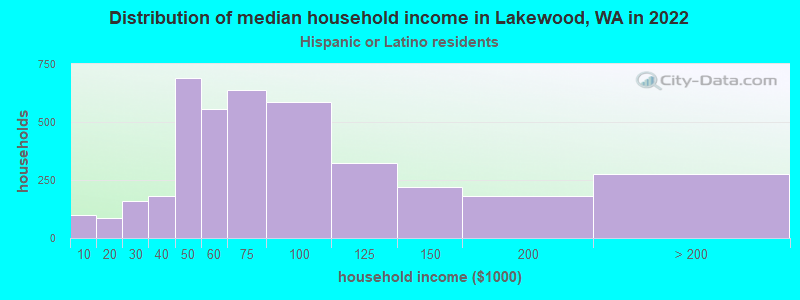
Income and house value in Lakewood Median household income in 2022 $69,377 White non-Hispanic householders$57,506 Black householders$97,671 American Indian and Alaska Native householders$50,223 Asian householders$65,487 Native Hawaiian and other Pacific Islander householders$55,528 Some other race householders$78,767 Two or more races householders$76,392 Hispanic or Latino race householdersMedian 2022 house value $528,980 White Non-Hispanic householders$485,661 Black or African American householders$432,481 American Indian or Alaska Native householders $479,674 Asian householders$548,350 Native Hawaiian and other Pacific Islander householders$345,140 Some other race householders$520,880 Two or more races householders$454,317 Hispanic or Latino householders
Median age by race in Lakewood
46.8 Median age for White residents43.5 48.3 32.0 Median age for Black or African American residents32.0 32.2 32.7 Median age for American Indian / Alaska Native residents34.6 32.0 47.5 Median age for Asian residents38.1 52.2 29.5 Median age for Native Hawaiian / Pacific Islander residents25.2 31.0 28.7 Median age for Other race residents27.5 28.4 28.0 Median age for Two or more races residents24.7 31.1 50.2 Median age for White alone residents48.6 52.6 26.4 Median age for Hispanic or Latino residents26.6 26.4
Owner/renter occupied households by race in Lakewood
House owners and renters - White residents 7,809 52.7% Owner occupied7,000 47.3% Renter occupiedHouse owners and renters - Black or African American residents 868 22.1% Owner occupied3,054 77.9% Renter occupiedHouse owners and renters - American Indian / Alaska Native residents 86 39.9% Owner occupied129 60.1% Renter occupiedHouse owners and renters - Asian residents 1,209 51.6% Owner occupied1,134 48.4% Renter occupiedHouse owners and renters - Native Hawaiian / Pacific Islander residents 94 15.0% Owner occupied534 85.0% Renter occupiedHouse owners and renters - Other race residents 358 25.4% Owner occupied1,050 74.6% Renter occupiedHouse owners and renters - Two or more races residents 1,507 32.9% Owner occupied3,069 67.1% Renter occupiedHouse owners and renters - White alone residents 7,480 54.6% Owner occupied6,223 45.4% Renter occupiedHouse owners and renters - Hispanic or Latino residents 1,189 29.3% Owner occupied2,863 70.7% Renter occupied
Language usage in Lakewood
English speakers - Total 76.2% of residents of Lakewood speak English at home.
11.1% of residents speak Spanish at home 4,294 64.6% Speak English very well2,356 35.4% Speak English less than very well12.6% of residents speak other language at home 4,656 61.3% Speak English very well2,938 38.7% Speak English less than very well
English speakers - Born in the United States 87.6% of residents of Lakewood speak English at home.
9.4% of residents speak Spanish at home 1,826 80.4% Speak English very well444 19.6% Speak English less than very well3.1% of residents speak other language at home 609 80.8% Speak English very well145 19.2% Speak English less than very well
English speakers - Native, born elsewhere 54.7% of residents of Lakewood speak English at home.
15.5% of residents speak Spanish at home 390 70.7% Speak English very well162 29.3% Speak English less than very well26.6% of residents speak other language at home 803 84.8% Speak English very well144 15.2% Speak English less than very well
English speakers - Foreign-born 20.1% of residents of Lakewood speak English at home.
25.3% of residents speak Spanish at home 991 37.9% Speak English very well1,623 62.1% Speak English less than very well53.8% of residents speak other language at home 2,897 52.2% Speak English very well2,651 47.8% Speak English less than very well
White (Caucasian) - Speak only English Native:
94.6% (26,079)Foreign-born:
36.8% (772)
White (Caucasian) - Speak another language Native:
4.5% (1,246)Foreign-born:
61.7% (1,297)
Black or African American - Speak only English Native:
96.0% (7,154)Foreign-born:
22.0% (258)
Black or African American - Speak another language Native:
3.9% (293)Foreign-born:
68.6% (804)
American Indian / Alaska Native - Speak another language Native:
7.9% (37)Foreign-born:
100.0% (90)
Asian - Speak only English Native:
63.0% (721)Foreign-born:
12.4% (536)
Asian - Speak another language Native:
36.8% (421)Foreign-born:
85.3% (3,688)
Native Hawaiian / Pacific Islander - Speak only English Native:
67.5% (1,323)Foreign-born:
38.4% (62)
Native Hawaiian / Pacific Islander - Speak another language Native:
32.1% (629)Foreign-born:
67.4% (109)
Other race - Speak only English Native:
34.8% (1,093)Foreign-born:
3.7% (32)
Other race - Speak another language Native:
64.6% (2,027)Foreign-born:
95.6% (820)
Two or more races - Speak only English Native:
80.7% (7,670)Foreign-born:
16.5% (300)
Two or more races - Speak another language Native:
19.8% (1,885)Foreign-born:
79.2% (1,445)
White alone - Speak only English Native:
96.5% (24,563)Foreign-born:
50.1% (644)
White alone - Speak another language Native:
3.3% (829)Foreign-born:
42.4% (546)
Hispanic or Latino - Speak only English Native:
50.7% (3,960)Foreign-born:
11.5% (372)
Hispanic or Latino - Speak another language Native:
47.8% (3,732)Foreign-born:
87.6% (2,832)
Foreign-born residents in Lakewood 10,112 residents are foreign born (6.9% Asia , 5.7% Latin America ).
This city:
15.9%Washington:
14.9%
Marital status for residents in Lakewood Marital status - White (Caucasian) population 15 years and over
Males 34.0% Never married47.2% Now married2.3% Separated3.1% Widowed13.4% DivorcedFemales 23.5% Never married44.0% Now married2.2% Separated10.9% Widowed19.4% DivorcedWomen who gave birth in the past 12 months Now married:
94.3% (294)Unmarried:
5.7% (18)
Women who did not give birth in the past 12 months Now married:
45.8% (2,712)Unmarried:
54.2% (3,203)
Marital status - Black or African American population 15 years and over
Males 45.2% Never married40.0% Now married0.3% Separated2.7% Widowed11.8% DivorcedFemales 40.5% Never married27.8% Now married6.0% Separated5.5% Widowed20.1% DivorcedWomen who gave birth in the past 12 months Now married:
67.1% (50)Unmarried:
32.9% (25)
Women who did not give birth in the past 12 months Now married:
35.3% (790)Unmarried:
64.7% (1,450)
Marital status - American Indian / Alaska Native population 15 years and over
Males 45.1% Never married34.5% Now married20.4% Separated0.0% Widowed0.0% DivorcedFemales 51.8% Never married18.4% Now married9.6% Separated6.7% Widowed13.5% DivorcedWomen who did not give birth in the past 12 months Now married:
16.7% (42)Unmarried:
83.3% (211)
Marital status - Asian population 15 years and over
Males 32.3% Never married54.4% Now married4.3% Separated2.1% Widowed6.9% DivorcedFemales 13.8% Never married57.9% Now married1.5% Separated20.0% Widowed6.9% DivorcedWomen who gave birth in the past 12 months Now married:
100.0% (97)Unmarried:
0.0% (0)
Women who did not give birth in the past 12 months Now married:
65.3% (840)Unmarried:
34.7% (445)
Marital status - Native Hawaiian / Pacific Islander population 15 years and over
Males 58.8% Never married31.0% Now married0.1% Separated0.0% Widowed10.0% DivorcedFemales 42.9% Never married26.2% Now married0.0% Separated3.7% Widowed27.2% DivorcedWomen who gave birth in the past 12 months Now married:
100.0% (65)Unmarried:
0.0% (0)
Women who did not give birth in the past 12 months Now married:
20.2% (82)Unmarried:
79.8% (325)
Marital status - Other race population 15 years and over
Males 42.8% Never married45.1% Now married3.4% Separated0.0% Widowed8.7% DivorcedFemales 21.0% Never married60.2% Now married7.1% Separated0.0% Widowed11.7% DivorcedWomen who gave birth in the past 12 months Now married:
68.2% (116)Unmarried:
31.8% (54)
Women who did not give birth in the past 12 months Now married:
68.6% (708)Unmarried:
31.4% (324)
Marital status - Two or more races population 15 years and over
Males 56.0% Never married34.2% Now married2.8% Separated0.9% Widowed6.2% DivorcedFemales 43.8% Never married35.6% Now married0.5% Separated2.3% Widowed17.8% DivorcedWomen who gave birth in the past 12 months Now married:
29.5% (92)Unmarried:
70.5% (220)
Women who did not give birth in the past 12 months Now married:
35.5% (1,236)Unmarried:
64.5% (2,249)
Marital status - White alone, not Hispanic / Latino population 15 years and over
Males 32.9% Never married47.3% Now married2.6% Separated3.4% Widowed13.9% DivorcedFemales 21.7% Never married44.6% Now married2.1% Separated11.5% Widowed20.2% DivorcedWomen who gave birth in the past 12 months Now married:
95.7% (258)Unmarried:
4.3% (12)
Women who did not give birth in the past 12 months Now married:
47.2% (2,452)Unmarried:
52.8% (2,748)
Marital status - Hispanic or Latino population 15 years and over
Males 49.2% Never married40.0% Now married3.5% Separated0.2% Widowed7.1% DivorcedFemales 36.1% Never married44.0% Now married4.2% Separated1.8% Widowed13.8% DivorcedWomen who gave birth in the past 12 months Now married:
47.6% (185)Unmarried:
52.4% (203)
Women who did not give birth in the past 12 months Now married:
48.5% (1,375)Unmarried:
51.5% (1,462)
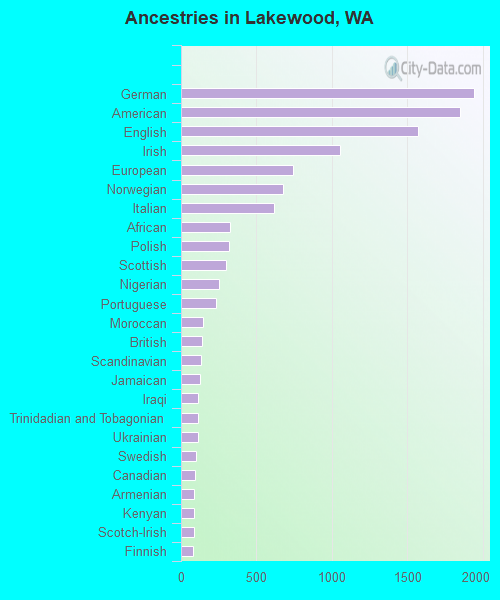
Ancestries in Lakewood
1,943 6.3% German1,850 6.0% American1,572 5.1% English1,051 3.4% Irish742 2.4% European673 2.2% Norwegian618 2.0% Italian325 1.1% African320 1.0% Polish301 1.0% Scottish252 0.8% Nigerian231 0.8% Portuguese145 0.5% Moroccan139 0.5% British135 0.4% Scandinavian128 0.4% Jamaican112 0.4% Iraqi112 0.4% Trinidadian and Tobagonian110 0.4% Ukrainian101 0.3% Swedish90 0.3% Canadian88 0.3% Armenian86 0.3% Kenyan83 0.3% Scotch-Irish80 0.3% Finnish75 0.2% Northern European68 0.2% French53 0.2% Croatian49 0.2% Russian47 0.2% Dutch32 0.1% Welsh29 0.09% Turkish25 0.08% Czech25 0.08% Hungarian23 0.07% Danish22 0.07% Romanian19 0.06% Cajun19 0.06% British West Indian17 0.06% Belgian16 0.05% Greek16 0.05% French Canadian15 0.05% Austrian9 0.03% Latvian8 0.03% Ethiopian8 0.03% Swiss7 0.02% Pennsylvania German7 0.02% Eastern European7 0.02% Lebanese6 0.02% Haitian4 0.01% Bahamian
Geographical mobility in Lakewood Same house 1 year ago 26,433 85.9% White (Caucasian)7,792 85.6% Black or African American594 100.0% American Indian / Alaska Native4,440 80.6% Asian1,485 72.7% Native Hawaiian / Pacific Islander3,712 90.7% Other race9,310 77.6% Two or more races23,751 86.4% White alone, not Hispanic / Latino9,965 84.4% Hispanic or LatinoMoved within same county 2,418 7.9% White / Caucasian540 5.9% Black or African American399 7.2% Asian192 9.4% Native Hawaiian / Pacific Islander256 6.3% Other race1,814 15.1% Two or more races2,011 7.3% White alone, not Hispanic / Latino1,403 11.9% Hispanic or LatinoMoved within same state 609 2.0% White / Caucasian158 1.7% Black or African American30 5.5% American Indian / Alaska Native124 2.3% Asian24 1.2% Native Hawaiian / Pacific Islander67 1.6% Other race239 2.0% Two or more races550 2.0% White alone, not Hispanic / Latino196 1.7% Hispanic or LatinoMoved from different state 1,291 4.2% White / Caucasian481 5.3% Black or African American1 0.2% American Indian / Alaska Native179 3.2% Asian77 3.8% Native Hawaiian / Pacific Islander229 5.6% Other race635 5.3% Two or more races1,155 4.2% White alone, not Hispanic / Latino366 3.1% Hispanic or LatinoMoved from abroad 63 0.2% White213 2.3% Black or African American423 7.7% Asian202 9.9% Native Hawaiian / Pacific Islander41 0.3% Two or more races64 0.2% White alone, not Hispanic / Latino6 0.0% Hispanic or Latino
Children Nativity (place of birth) in Lakewood
Children under 6 years - Living with two parents Both parents native 1,358 100.0% NativeBoth parents foreign-born 402 85.1% Native70 14.9% Foreign-bornOne native, one foreign-born parent 454 100.0% NativeChildren under 6 years - Living with one parent Native parent 1,719 100.0% NativeForeign-born parent 256 89.0% Native32 11.0% Foreign-bornChildren 6 to 17 years - Living with two parents Both parents native 1,775 100.0% NativeBoth parents foreign-born 551 71.2% Native223 28.8% Foreign-bornOne native, one foreign-born parent 730 100.0% NativeChildren 6 to 17 years - Living with one parent Native parent 3,690 100.0% NativeForeign-born parent 752 51.8% Native698 48.2% Foreign-born
Grandparents responsible for own grandchildren in Lakewood
Grandparents (30 to 59 years) White / Caucasian 106 17.3% Responsible for grandchildren505 82.7% Not responsible for grandchildrenBlack or African American 41 100.0% Not responsible for grandchildrenAsian 37 100.0% Responsible for grandchildrenNative Hawaiian / Pacific Islander 12 100.0% Responsible for grandchildrenOther race 22 45.5% Responsible for grandchildren26 54.5% Not responsible for grandchildrenTwo or more races 117 100.0% Not responsible for grandchildrenWhite alone, not Hispanic / Latino 93 15.1% Responsible for grandchildren520 84.9% Not responsible for grandchildrenHispanic or Latino 43 57.8% Responsible for grandchildren31 42.2% Not responsible for grandchildrenGrandparents (60 years and over) White / Caucasian 193 47.7% Responsible for grandchildren212 52.3% Not responsible for grandchildrenBlack or African American 13 20.1% Responsible for grandchildren51 79.9% Not responsible for grandchildrenAsian 30 100.0% Not responsible for grandchildrenNative Hawaiian / Pacific Islander 21 24.9% Responsible for grandchildren64 75.1% Not responsible for grandchildrenOther race 25 100.0% Not responsible for grandchildrenTwo or more races 59 100.0% Not responsible for grandchildrenWhite alone, not Hispanic / Latino 201 48.6% Responsible for grandchildren212 51.4% Not responsible for grandchildrenHispanic or Latino 44 100.0% Not responsible for grandchildren