Races in Lake Zurich, Illinois (IL) Detailed Stats
Data:
Races - White alone (%)
Races - White alone (% change since 2000)
Races - Black alone (%)
Races - Black alone (% change since 2000)
Races - American Indian alone (%)
Races - American Indian alone (% change since 2000)
Races - Asian alone (%)
Races - Asian alone (% change since 2000)
Races - Hispanic (%)
Races - Hispanic (% change since 2000)
Races - Native Hawaiian and Other Pacific Islander alone (%)
Races - Native Hawaiian and Other Pacific Islander alone (% change since 2000)
Races - Two or more races(%)
Races - Two or more races(% change since 2000)
Races - Other race alone (%)
Races - Other race alone (% change since 2000)
Racial diversity
Place of birth - Born in state of residence (%)
Place of birth - Born in state of residence (%) - White
Place of birth - Born in state of residence (%) - Black or African American
Place of birth - Born in state of residence (%) - Asian
Place of birth - Born in state of residence (%) - Hispanic or Latino
Place of birth - Born in state of residence (%) - American Indian and Alaska Native
Place of birth - Born in state of residence (%) - Multirace
Place of birth - Born in state of residence (%) - Other Race
Place of birth - Born in other state (%)
Place of birth - Born in other state (%) - White
Place of birth - Born in other state (%) - Black or African American
Place of birth - Born in other state (%) - Asian
Place of birth - Born in other state (%) - Hispanic or Latino
Place of birth - Born in other state (%) - American Indian and Alaska Native
Place of birth - Born in other state (%) - Multirace
Place of birth - Born in other state (%) - Other Race
Place of birth - Native, outside of US (%)
Place of birth - Native, outside of US (%) - White
Place of birth - Native, outside of US (%) - Black or African American
Place of birth - Native, outside of US (%) - Asian
Place of birth - Native, outside of US (%) - Hispanic or Latino
Place of birth - Native, outside of US (%) - American Indian and Alaska Native
Place of birth - Native, outside of US (%) - Multirace
Place of birth - Native, outside of US (%) - Other Race
Place of birth - Foreign born (%)
Place of birth - Foreign born (%) - White
Place of birth - Foreign born (%) - Black or African American
Place of birth - Foreign born (%) - Asian
Place of birth - Foreign born (%) - Hispanic or Latino
Place of birth - Foreign born (%) - American Indian and Alaska Native
Place of birth - Foreign born (%) - Multirace
Place of birth - Foreign born (%) - Other Race
Residents speaking English at home (%)
Residents speaking English at home - Born in the United States (%)
Residents speaking English at home - Native, born elsewhere (%)
Residents speaking English at home - Foreign born (%)
Residents speaking Spanish at home (%)
Residents speaking Spanish at home - Born in the United States (%)
Residents speaking Spanish at home - Native, born elsewhere (%)
Residents speaking Spanish at home - Foreign born (%)
Residents speaking other language at home (%)
Residents speaking other language at home - Born in the United States (%)
Residents speaking other language at home - Native, born elsewhere (%)
Residents speaking other language at home - Foreign born (%)
Marital status - Never married (%)
Marital status - Now married (%)
Marital status - Separated (%)
Marital status - Widowed (%)
Marital status - Divorced (%)
Ancestries Reported - Arab (%)
Ancestries Reported - Czech (%)
Ancestries Reported - Danish (%)
Ancestries Reported - Dutch (%)
Ancestries Reported - English (%)
Ancestries Reported - French (%)
Ancestries Reported - French Canadian (%)
Ancestries Reported - German (%)
Ancestries Reported - Greek (%)
Ancestries Reported - Hungarian (%)
Ancestries Reported - Irish (%)
Ancestries Reported - Italian (%)
Ancestries Reported - Lithuanian (%)
Ancestries Reported - Norwegian (%)
Ancestries Reported - Polish (%)
Ancestries Reported - Portuguese (%)
Ancestries Reported - Russian (%)
Ancestries Reported - Scotch-Irish (%)
Ancestries Reported - Scottish (%)
Ancestries Reported - Slovak (%)
Ancestries Reported - Subsaharan African (%)
Ancestries Reported - Swedish (%)
Ancestries Reported - Swiss (%)
Ancestries Reported - Ukrainian (%)
Ancestries Reported - United States (%)
Ancestries Reported - Welsh (%)
Ancestries Reported - West Indian (%)
Ancestries Reported - Other (%)
Geographical mobility - Same house 1 year ago (%)
Geographical mobility - Same house 1 year ago (%) - White
Geographical mobility - Same house 1 year ago (%) - Black or African American
Geographical mobility - Same house 1 year ago (%) - Asian
Geographical mobility - Same house 1 year ago (%) - Hispanic or Latino
Geographical mobility - Same house 1 year ago (%) - American Indian and Alaska Native
Geographical mobility - Same house 1 year ago (%) - Multirace
Geographical mobility - Same house 1 year ago (%) - Other Race
Geographical mobility - Moved within same county (%)
Geographical mobility - Moved within same county (%) - White
Geographical mobility - Moved within same county (%) - Black or African American
Geographical mobility - Moved within same county (%) - Asian
Geographical mobility - Moved within same county (%) - Hispanic or Latino
Geographical mobility - Moved within same county (%) - American Indian and Alaska Native
Geographical mobility - Moved within same county (%) - Multirace
Geographical mobility - Moved within same county (%) - Other Race
Geographical mobility - Moved from different county within same state (%)
Geographical mobility - Moved from different county within same state (%) - White
Geographical mobility - Moved from different county within same state (%) - Black or African American
Geographical mobility - Moved from different county within same state (%) - Asian
Geographical mobility - Moved from different county within same state (%) - Hispanic or Latino
Geographical mobility - Moved from different county within same state (%) - American Indian and Alaska Native
Geographical mobility - Moved from different county within same state (%) - Multirace
Geographical mobility - Moved from different county within same state (%) - Other Race
Geographical mobility - Moved from different state (%)
Geographical mobility - Moved from different state (%) - White
Geographical mobility - Moved from different state (%) - Black or African American
Geographical mobility - Moved from different state (%) - Asian
Geographical mobility - Moved from different state (%) - Hispanic or Latino
Geographical mobility - Moved from different state (%) - American Indian and Alaska Native
Geographical mobility - Moved from different state (%) - Multirace
Geographical mobility - Moved from different state (%) - Other Race
Geographical mobility - Moved from abroad (%)
Geographical mobility - Moved from abroad (%) - White
Geographical mobility - Moved from abroad (%) - Black or African American
Geographical mobility - Moved from abroad (%) - Asian
Geographical mobility - Moved from abroad (%) - Hispanic or Latino
Geographical mobility - Moved from abroad (%) - American Indian and Alaska Native
Geographical mobility - Moved from abroad (%) - Multirace
Geographical mobility - Moved from abroad (%) - Other Race
Place of birth for the foreign-born population - Ireland (%)
Place of birth for the foreign-born population - Denmark (%)
Place of birth for the foreign-born population - Norway (%)
Place of birth for the foreign-born population - Sweden (%)
Place of birth for the foreign-born population - United Kingdom (%)
Place of birth for the foreign-born population - England (%)
Place of birth for the foreign-born population - Scotland (%)
Place of birth for the foreign-born population - Other Northern Europe (%)
Place of birth for the foreign-born population - Austria (%)
Place of birth for the foreign-born population - Belgium (%)
Place of birth for the foreign-born population - France (%)
Place of birth for the foreign-born population - Germany (%)
Place of birth for the foreign-born population - Netherlands (%)
Place of birth for the foreign-born population - Switzerland (%)
Place of birth for the foreign-born population - Other Western Europe (%)
Place of birth for the foreign-born population - Greece (%)
Place of birth for the foreign-born population - Italy (%)
Place of birth for the foreign-born population - Portugal (%)
Place of birth for the foreign-born population - Spain (%)
Place of birth for the foreign-born population - Other Southern Europe (%)
Place of birth for the foreign-born population - Albania (%)
Place of birth for the foreign-born population - Belarus (%)
Place of birth for the foreign-born population - Bosnia and Herzegovina (%)
Place of birth for the foreign-born population - Bulgaria (%)
Place of birth for the foreign-born population - Croatia (%)
Place of birth for the foreign-born population - Czechoslovakia (%)
Place of birth for the foreign-born population - Hungary (%)
Place of birth for the foreign-born population - Latvia (%)
Place of birth for the foreign-born population - Lithuania (%)
Place of birth for the foreign-born population - North Macedonia (Macedonia) (%)
Place of birth for the foreign-born population - Moldova (%)
Place of birth for the foreign-born population - Poland (%)
Place of birth for the foreign-born population - Romania (%)
Place of birth for the foreign-born population - Russia (%)
Place of birth for the foreign-born population - Serbia (%)
Place of birth for the foreign-born population - Ukraine (%)
Place of birth for the foreign-born population - Other Eastern Europe (%)
Place of birth for the foreign-born population - China (%)
Place of birth for the foreign-born population - Hong Kong (%)
Place of birth for the foreign-born population - Taiwan (%)
Place of birth for the foreign-born population - Japan (%)
Place of birth for the foreign-born population - Korea (%)
Place of birth for the foreign-born population - Other Eastern Asia (%)
Place of birth for the foreign-born population - Afghanistan (%)
Place of birth for the foreign-born population - Bangladesh (%)
Place of birth for the foreign-born population - India (%)
Place of birth for the foreign-born population - Iran (%)
Place of birth for the foreign-born population - Kazakhstan (%)
Place of birth for the foreign-born population - Nepal (%)
Place of birth for the foreign-born population - Pakistan (%)
Place of birth for the foreign-born population - Sri Lanka (%)
Place of birth for the foreign-born population - Uzbekistan (%)
Place of birth for the foreign-born population - Other South Central Asia (%)
Place of birth for the foreign-born population - Burma (%)
Place of birth for the foreign-born population - Cambodia (%)
Place of birth for the foreign-born population - Indonesia (%)
Place of birth for the foreign-born population - Laos (%)
Place of birth for the foreign-born population - Malaysia (%)
Place of birth for the foreign-born population - Philippines (%)
Place of birth for the foreign-born population - Singapore (%)
Place of birth for the foreign-born population - Thailand (%)
Place of birth for the foreign-born population - Vietnam (%)
Place of birth for the foreign-born population - Other South Eastern Asia (%)
Place of birth for the foreign-born population - Armenia (%)
Place of birth for the foreign-born population - Iraq (%)
Place of birth for the foreign-born population - Israel (%)
Place of birth for the foreign-born population - Jordan (%)
Place of birth for the foreign-born population - Kuwait (%)
Place of birth for the foreign-born population - Lebanon (%)
Place of birth for the foreign-born population - Saudi Arabia (%)
Place of birth for the foreign-born population - Syria (%)
Place of birth for the foreign-born population - Turkey (%)
Place of birth for the foreign-born population - Yemen (%)
Place of birth for the foreign-born population - Other Western Asia (%)
Place of birth for the foreign-born population - Eritrea (%)
Place of birth for the foreign-born population - Ethiopia (%)
Place of birth for the foreign-born population - Kenya (%)
Place of birth for the foreign-born population - Somalia (%)
Place of birth for the foreign-born population - Uganda (%)
Place of birth for the foreign-born population - Zimbabwe (%)
Place of birth for the foreign-born population - Other Eastern Africa (%)
Place of birth for the foreign-born population - Cameroon (%)
Place of birth for the foreign-born population - Congo (%)
Place of birth for the foreign-born population - Democratic Republic of Congo (Zaire) (%)
Place of birth for the foreign-born population - Other Middle Africa (%)
Place of birth for the foreign-born population - Egypt (%)
Place of birth for the foreign-born population - Morocco (%)
Place of birth for the foreign-born population - Sudan (%)
Place of birth for the foreign-born population - Other Northern Africa (%)
Place of birth for the foreign-born population - South Africa (%)
Place of birth for the foreign-born population - Other Southern Africa (%)
Place of birth for the foreign-born population - Cabo Verde (%)
Place of birth for the foreign-born population - Ghana (%)
Place of birth for the foreign-born population - Liberia (%)
Place of birth for the foreign-born population - Nigeria (%)
Place of birth for the foreign-born population - Senegal (%)
Place of birth for the foreign-born population - Sierra Leone (%)
Place of birth for the foreign-born population - Other Western Africa (%)
Place of birth for the foreign-born population - Australia (%)
Place of birth for the foreign-born population - New Zealand (%)
Place of birth for the foreign-born population - Fiji (%)
Place of birth for the foreign-born population - Micronesia (%)
Place of birth for the foreign-born population - Bahamas (%)
Place of birth for the foreign-born population - Barbados (%)
Place of birth for the foreign-born population - Cuba (%)
Place of birth for the foreign-born population - Dominica (%)
Place of birth for the foreign-born population - Dominican Republic (%)
Place of birth for the foreign-born population - Grenada (%)
Place of birth for the foreign-born population - Haiti (%)
Place of birth for the foreign-born population - Jamaica (%)
Place of birth for the foreign-born population - St. Vincent and the Grenadines (%)
Place of birth for the foreign-born population - Trinidad and Tobago (%)
Place of birth for the foreign-born population - West Indies (%)
Place of birth for the foreign-born population - Other Caribbean (%)
Place of birth for the foreign-born population - Belize (%)
Place of birth for the foreign-born population - Costa Rica (%)
Place of birth for the foreign-born population - El Salvador (%)
Place of birth for the foreign-born population - Guatemala (%)
Place of birth for the foreign-born population - Honduras (%)
Place of birth for the foreign-born population - Mexico (%)
Place of birth for the foreign-born population - Nicaragua (%)
Place of birth for the foreign-born population - Panama (%)
Place of birth for the foreign-born population - Other Central America (%)
Place of birth for the foreign-born population - Argentina (%)
Place of birth for the foreign-born population - Bolivia (%)
Place of birth for the foreign-born population - Brazil (%)
Place of birth for the foreign-born population - Chile (%)
Place of birth for the foreign-born population - Colombia (%)
Place of birth for the foreign-born population - Ecuador (%)
Place of birth for the foreign-born population - Guyana (%)
Place of birth for the foreign-born population - Peru (%)
Place of birth for the foreign-born population - Uruguay (%)
Place of birth for the foreign-born population - Venezuela (%)
Place of birth for the foreign-born population - Other South America (%)
Place of birth for the foreign-born population - Canada (%)
Place of birth for the foreign-born population - Other Northern America (%)
Place of birth for the foreign-born population - Other (%)
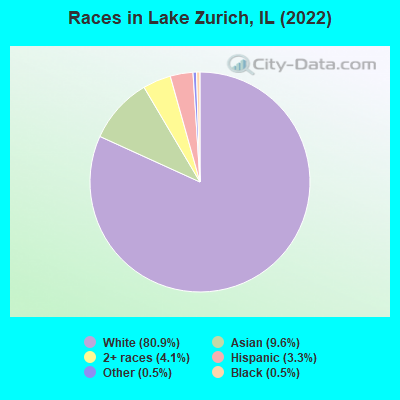
According to 2022 data, the most numerous races in Lake Zurich, IL are White alone (15,889 residents), Hispanic (646 residents), and Black alone (98 residents). 79.9% of Lake Zurich residents speak English at home. 15.5% of Lake Zurich, IL residents are foreign-born (8.5% born in Europe, 5.5% born in Asia), which is 9.6% greater than the foreign-born rate of 14.0% across the entire state of Illinois.
Race distribution in Lake Zurich
2000 2022
8,424,140 67.8% White alone 1,856,152 14.9% Black alone 1,530,262 12.3% Hispanic 419,916 3.4% Asian alone 153,996 1.2% Two or more races 13,479 0.1% Other race alone 18,232 0.1% American Indian alone 3,116 0.03% Native Hawaiian and Other
7,356,301 58.5% White alone 2,299,726 18.3% Hispanic 1,660,423 13.2% Black alone 747,296 5.9% Asian alone 458,599 3.6% Two or more races 45,386 0.4% Other race alone 10,405 0.08% American Indian alone 3,896 0.03% Native Hawaiian and Other
Income and house value in Lake Zurich Median household income in 2022 $127,962 White non-Hispanic householders$158,410 Black householders$173,581 Asian householders$114,881 Hispanic or Latino race householdersMedian 2022 house value $417,343 White Non-Hispanic householders$308,930 Black or African American householders $515,934 Asian householders$176,055 Native Hawaiian and other Pacific Islander householders$336,358 Some other race householders$416,973 Two or more races householders$328,204 Hispanic or Latino householders
Median age by race in Lake Zurich
44.8 Median age for White residents43.3 46.6 64.0 Median age for Black or African American residents40.3 70.9 -657,243,815.6 Median age for American Indian / Alaska Native residents-671,532,846.0 -638,251,365.5 36.4 Median age for Asian residents39.3 34.0 -593,236,714.4 Median age for Native Hawaiian / Pacific Islander residents-658,536,584.7 -576,015,108.0 22.0 Median age for Other race residents21.3 48.8 21.4 Median age for Two or more races residents25.5 21.2 43.9 Median age for White alone residents42.0 46.1 22.3 Median age for Hispanic or Latino residents19.5 33.5
Owner/renter occupied households by race in Lake Zurich
House owners and renters - White residents 4,993 82.6% Owner occupied1,054 17.4% Renter occupiedHouse owners and renters - Black or African American residents 32 100.0% Owner occupiedHouse owners and renters - Asian residents 631 93.3% Owner occupied46 6.7% Renter occupiedHouse owners and renters - Other race residents 6 25.6% Owner occupied16 74.4% Renter occupiedHouse owners and renters - Two or more races residents 179 58.3% Owner occupied128 41.7% Renter occupiedHouse owners and renters - White alone residents 5,073 82.0% Owner occupied1,116 18.0% Renter occupiedHouse owners and renters - Hispanic or Latino residents 133 88.1% Owner occupied18 11.9% Renter occupied
Language usage in Lake Zurich
English speakers - Total 79.9% of residents of Lake Zurich speak English at home.
1.8% of residents speak Spanish at home 256 76.6% Speak English very well78 23.4% Speak English less than very well18.2% of residents speak other language at home 2,277 67.4% Speak English very well1,100 32.6% Speak English less than very well
English speakers - Born in the United States 93.8% of residents of Lake Zurich speak English at home.
2.3% of residents speak Spanish at home 71 91.0% Speak English very well7 9.0% Speak English less than very well3.4% of residents speak other language at home 107 94.7% Speak English very well6 5.3% Speak English less than very well
English speakers - Native, born elsewhere 69.8% of residents of Lake Zurich speak English at home.
32.6% of residents speak other language at home 30 71.4% Speak English very well12 28.6% Speak English less than very well
English speakers - Foreign-born 16.6% of residents of Lake Zurich speak English at home.
3.6% of residents speak Spanish at home 78 69.0% Speak English very well35 31.0% Speak English less than very well79.7% of residents speak other language at home 1,573 62.3% Speak English very well950 37.7% Speak English less than very well
White (Caucasian) - Speak only English Native:
99.0% (12,763)Foreign-born:
26.5% (377)
White (Caucasian) - Speak another language Native:
2.8% (367)Foreign-born:
73.2% (1,042)
Asian - Speak only English Native:
41.8% (281)Foreign-born:
6.3% (67)
Asian - Speak another language Native:
59.7% (402)Foreign-born:
94.1% (1,006)
Other race - Speak another language Native:
11.6% (18)Foreign-born:
94.8% (7)
Two or more races - Speak only English Native:
79.2% (755)Foreign-born:
28.4% (52)
Two or more races - Speak another language Native:
16.9% (161)Foreign-born:
67.7% (123)
White alone - Speak only English Native:
96.1% (12,778)Foreign-born:
18.7% (345)
White alone - Speak another language Native:
3.9% (513)Foreign-born:
80.7% (1,494)
Hispanic or Latino - Speak only English Native:
91.4% (413)Foreign-born:
56.9% (76)
Hispanic or Latino - Speak another language Native:
12.7% (57)Foreign-born:
59.8% (80)
Foreign-born residents in Lake Zurich 3,042 residents are foreign born (8.5% Europe , 5.5% Asia ).
This city:
15.5%Illinois:
14.1%
Marital status for residents in Lake Zurich Marital status - White (Caucasian) population 15 years and over
Males 25.1% Never married66.1% Now married0.2% Separated1.5% Widowed7.1% DivorcedFemales 23.5% Never married60.8% Now married0.5% Separated7.1% Widowed8.2% DivorcedWomen who gave birth in the past 12 months Now married:
100.0% (184)Unmarried:
0.0% (0)
Women who did not give birth in the past 12 months Now married:
48.6% (1,461)Unmarried:
51.4% (1,546)
Marital status - Black or African American population 15 years and over
Males 50.0% Never married50.0% Now married0.0% Separated0.0% Widowed0.0% DivorcedFemales 58.5% Never married26.6% Now married0.0% Separated0.0% Widowed14.9% DivorcedWomen who did not give birth in the past 12 months Now married:
0.0% (0)Unmarried:
100.0% (13)
Marital status - Asian population 15 years and over
Males 9.6% Never married83.5% Now married2.5% Separated2.3% Widowed2.1% DivorcedFemales 21.3% Never married63.1% Now married2.6% Separated0.0% Widowed13.0% DivorcedWomen who gave birth in the past 12 months Now married:
100.0% (38)Unmarried:
0.0% (0)
Women who did not give birth in the past 12 months Now married:
67.8% (375)Unmarried:
32.2% (178)
Marital status - Other race population 15 years and over
Males 91.7% Never married8.3% Now married0.0% Separated0.0% Widowed0.0% DivorcedFemales 12.9% Never married59.7% Now married0.0% Separated0.0% Widowed27.4% DivorcedWomen who did not give birth in the past 12 months Now married:
100.0% (37)Unmarried:
0.0% (0)
Marital status - Two or more races population 15 years and over
Males 41.0% Never married59.0% Now married0.0% Separated0.0% Widowed0.0% DivorcedFemales 59.0% Never married23.8% Now married10.2% Separated2.7% Widowed4.2% DivorcedWomen who did not give birth in the past 12 months Now married:
20.2% (78)Unmarried:
79.8% (308)
Marital status - White alone, not Hispanic / Latino population 15 years and over
Males 25.2% Never married66.3% Now married0.0% Separated1.5% Widowed7.0% DivorcedFemales 23.3% Never married61.2% Now married0.5% Separated7.2% Widowed7.8% DivorcedWomen who gave birth in the past 12 months Now married:
100.0% (196)Unmarried:
0.0% (0)
Women who did not give birth in the past 12 months Now married:
49.2% (1,527)Unmarried:
50.8% (1,579)
Marital status - Hispanic or Latino population 15 years and over
Males 41.3% Never married42.4% Now married6.4% Separated0.0% Widowed9.9% DivorcedFemales 39.8% Never married36.3% Now married0.0% Separated3.2% Widowed20.8% DivorcedWomen who did not give birth in the past 12 months Now married:
36.1% (76)Unmarried:
63.9% (135)
Ancestries in Lake Zurich
1,004 12.1% German868 10.4% American796 9.6% Irish785 9.4% Polish478 5.7% Italian302 3.6% English281 3.4% Russian238 2.9% European200 2.4% Bulgarian156 1.9% Czech139 1.7% Norwegian107 1.3% Lithuanian101 1.2% Ukrainian86 1.0% Eastern European86 1.0% Greek81 1.0% Romanian68 0.8% Portuguese62 0.7% Swedish42 0.5% Scottish33 0.4% Welsh29 0.3% British26 0.3% French19 0.2% Assyrian19 0.2% Yugoslavian18 0.2% Scotch-Irish17 0.2% Scandinavian11 0.1% Hungarian10 0.1% Croatian9 0.1% Turkish8 0.10% Dutch7 0.08% Canadian7 0.08% Northern European6 0.07% Israeli6 0.07% Slovak5 0.06% Lebanese3 0.04% Slavic
Children Nativity (place of birth) in Lake Zurich
Children under 6 years - Living with two parents Both parents native 860 100.0% NativeBoth parents foreign-born 195 95.2% Native10 4.8% Foreign-bornOne native, one foreign-born parent 190 100.0% NativeChildren under 6 years - Living with one parent Native parent 48 100.0% NativeChildren 6 to 17 years - Living with two parents Both parents native 1,871 100.0% NativeBoth parents foreign-born 396 81.5% Native90 18.5% Foreign-bornOne native, one foreign-born parent 333 100.0% NativeChildren 6 to 17 years - Living with one parent Native parent 287 100.0% NativeForeign-born parent 117 51.8% Native109 48.2% Foreign-born
Grandparents responsible for own grandchildren in Lake Zurich
Grandparents (30 to 59 years) White / Caucasian 17 100.0% Not responsible for grandchildrenWhite alone, not Hispanic / Latino 18 100.0% Not responsible for grandchildren
Grandparents (60 years and over) White / Caucasian 45 100.0% Not responsible for grandchildrenWhite alone, not Hispanic / Latino 63 100.0% Not responsible for grandchildren