Races in Lake Barcroft, Virginia (VA) Detailed Stats
Data:
Races - White alone (%)
Races - White alone (% change since 2000)
Races - Black alone (%)
Races - Black alone (% change since 2000)
Races - American Indian alone (%)
Races - American Indian alone (% change since 2000)
Races - Asian alone (%)
Races - Asian alone (% change since 2000)
Races - Hispanic (%)
Races - Hispanic (% change since 2000)
Races - Native Hawaiian and Other Pacific Islander alone (%)
Races - Native Hawaiian and Other Pacific Islander alone (% change since 2000)
Races - Two or more races(%)
Races - Two or more races(% change since 2000)
Races - Other race alone (%)
Races - Other race alone (% change since 2000)
Racial diversity
Place of birth - Born in state of residence (%)
Place of birth - Born in state of residence (%) - White
Place of birth - Born in state of residence (%) - Black or African American
Place of birth - Born in state of residence (%) - Asian
Place of birth - Born in state of residence (%) - Hispanic or Latino
Place of birth - Born in state of residence (%) - American Indian and Alaska Native
Place of birth - Born in state of residence (%) - Multirace
Place of birth - Born in state of residence (%) - Other Race
Place of birth - Born in other state (%)
Place of birth - Born in other state (%) - White
Place of birth - Born in other state (%) - Black or African American
Place of birth - Born in other state (%) - Asian
Place of birth - Born in other state (%) - Hispanic or Latino
Place of birth - Born in other state (%) - American Indian and Alaska Native
Place of birth - Born in other state (%) - Multirace
Place of birth - Born in other state (%) - Other Race
Place of birth - Native, outside of US (%)
Place of birth - Native, outside of US (%) - White
Place of birth - Native, outside of US (%) - Black or African American
Place of birth - Native, outside of US (%) - Asian
Place of birth - Native, outside of US (%) - Hispanic or Latino
Place of birth - Native, outside of US (%) - American Indian and Alaska Native
Place of birth - Native, outside of US (%) - Multirace
Place of birth - Native, outside of US (%) - Other Race
Place of birth - Foreign born (%)
Place of birth - Foreign born (%) - White
Place of birth - Foreign born (%) - Black or African American
Place of birth - Foreign born (%) - Asian
Place of birth - Foreign born (%) - Hispanic or Latino
Place of birth - Foreign born (%) - American Indian and Alaska Native
Place of birth - Foreign born (%) - Multirace
Place of birth - Foreign born (%) - Other Race
Residents speaking English at home (%)
Residents speaking English at home - Born in the United States (%)
Residents speaking English at home - Native, born elsewhere (%)
Residents speaking English at home - Foreign born (%)
Residents speaking Spanish at home (%)
Residents speaking Spanish at home - Born in the United States (%)
Residents speaking Spanish at home - Native, born elsewhere (%)
Residents speaking Spanish at home - Foreign born (%)
Residents speaking other language at home (%)
Residents speaking other language at home - Born in the United States (%)
Residents speaking other language at home - Native, born elsewhere (%)
Residents speaking other language at home - Foreign born (%)
Marital status - Never married (%)
Marital status - Now married (%)
Marital status - Separated (%)
Marital status - Widowed (%)
Marital status - Divorced (%)
Ancestries Reported - Arab (%)
Ancestries Reported - Czech (%)
Ancestries Reported - Danish (%)
Ancestries Reported - Dutch (%)
Ancestries Reported - English (%)
Ancestries Reported - French (%)
Ancestries Reported - French Canadian (%)
Ancestries Reported - German (%)
Ancestries Reported - Greek (%)
Ancestries Reported - Hungarian (%)
Ancestries Reported - Irish (%)
Ancestries Reported - Italian (%)
Ancestries Reported - Lithuanian (%)
Ancestries Reported - Norwegian (%)
Ancestries Reported - Polish (%)
Ancestries Reported - Portuguese (%)
Ancestries Reported - Russian (%)
Ancestries Reported - Scotch-Irish (%)
Ancestries Reported - Scottish (%)
Ancestries Reported - Slovak (%)
Ancestries Reported - Subsaharan African (%)
Ancestries Reported - Swedish (%)
Ancestries Reported - Swiss (%)
Ancestries Reported - Ukrainian (%)
Ancestries Reported - United States (%)
Ancestries Reported - Welsh (%)
Ancestries Reported - West Indian (%)
Ancestries Reported - Other (%)
Geographical mobility - Same house 1 year ago (%)
Geographical mobility - Same house 1 year ago (%) - White
Geographical mobility - Same house 1 year ago (%) - Black or African American
Geographical mobility - Same house 1 year ago (%) - Asian
Geographical mobility - Same house 1 year ago (%) - Hispanic or Latino
Geographical mobility - Same house 1 year ago (%) - American Indian and Alaska Native
Geographical mobility - Same house 1 year ago (%) - Multirace
Geographical mobility - Same house 1 year ago (%) - Other Race
Geographical mobility - Moved within same county (%)
Geographical mobility - Moved within same county (%) - White
Geographical mobility - Moved within same county (%) - Black or African American
Geographical mobility - Moved within same county (%) - Asian
Geographical mobility - Moved within same county (%) - Hispanic or Latino
Geographical mobility - Moved within same county (%) - American Indian and Alaska Native
Geographical mobility - Moved within same county (%) - Multirace
Geographical mobility - Moved within same county (%) - Other Race
Geographical mobility - Moved from different county within same state (%)
Geographical mobility - Moved from different county within same state (%) - White
Geographical mobility - Moved from different county within same state (%) - Black or African American
Geographical mobility - Moved from different county within same state (%) - Asian
Geographical mobility - Moved from different county within same state (%) - Hispanic or Latino
Geographical mobility - Moved from different county within same state (%) - American Indian and Alaska Native
Geographical mobility - Moved from different county within same state (%) - Multirace
Geographical mobility - Moved from different county within same state (%) - Other Race
Geographical mobility - Moved from different state (%)
Geographical mobility - Moved from different state (%) - White
Geographical mobility - Moved from different state (%) - Black or African American
Geographical mobility - Moved from different state (%) - Asian
Geographical mobility - Moved from different state (%) - Hispanic or Latino
Geographical mobility - Moved from different state (%) - American Indian and Alaska Native
Geographical mobility - Moved from different state (%) - Multirace
Geographical mobility - Moved from different state (%) - Other Race
Geographical mobility - Moved from abroad (%)
Geographical mobility - Moved from abroad (%) - White
Geographical mobility - Moved from abroad (%) - Black or African American
Geographical mobility - Moved from abroad (%) - Asian
Geographical mobility - Moved from abroad (%) - Hispanic or Latino
Geographical mobility - Moved from abroad (%) - American Indian and Alaska Native
Geographical mobility - Moved from abroad (%) - Multirace
Geographical mobility - Moved from abroad (%) - Other Race
Place of birth for the foreign-born population - Ireland (%)
Place of birth for the foreign-born population - Denmark (%)
Place of birth for the foreign-born population - Norway (%)
Place of birth for the foreign-born population - Sweden (%)
Place of birth for the foreign-born population - United Kingdom (%)
Place of birth for the foreign-born population - England (%)
Place of birth for the foreign-born population - Scotland (%)
Place of birth for the foreign-born population - Other Northern Europe (%)
Place of birth for the foreign-born population - Austria (%)
Place of birth for the foreign-born population - Belgium (%)
Place of birth for the foreign-born population - France (%)
Place of birth for the foreign-born population - Germany (%)
Place of birth for the foreign-born population - Netherlands (%)
Place of birth for the foreign-born population - Switzerland (%)
Place of birth for the foreign-born population - Other Western Europe (%)
Place of birth for the foreign-born population - Greece (%)
Place of birth for the foreign-born population - Italy (%)
Place of birth for the foreign-born population - Portugal (%)
Place of birth for the foreign-born population - Spain (%)
Place of birth for the foreign-born population - Other Southern Europe (%)
Place of birth for the foreign-born population - Albania (%)
Place of birth for the foreign-born population - Belarus (%)
Place of birth for the foreign-born population - Bosnia and Herzegovina (%)
Place of birth for the foreign-born population - Bulgaria (%)
Place of birth for the foreign-born population - Croatia (%)
Place of birth for the foreign-born population - Czechoslovakia (%)
Place of birth for the foreign-born population - Hungary (%)
Place of birth for the foreign-born population - Latvia (%)
Place of birth for the foreign-born population - Lithuania (%)
Place of birth for the foreign-born population - North Macedonia (Macedonia) (%)
Place of birth for the foreign-born population - Moldova (%)
Place of birth for the foreign-born population - Poland (%)
Place of birth for the foreign-born population - Romania (%)
Place of birth for the foreign-born population - Russia (%)
Place of birth for the foreign-born population - Serbia (%)
Place of birth for the foreign-born population - Ukraine (%)
Place of birth for the foreign-born population - Other Eastern Europe (%)
Place of birth for the foreign-born population - China (%)
Place of birth for the foreign-born population - Hong Kong (%)
Place of birth for the foreign-born population - Taiwan (%)
Place of birth for the foreign-born population - Japan (%)
Place of birth for the foreign-born population - Korea (%)
Place of birth for the foreign-born population - Other Eastern Asia (%)
Place of birth for the foreign-born population - Afghanistan (%)
Place of birth for the foreign-born population - Bangladesh (%)
Place of birth for the foreign-born population - India (%)
Place of birth for the foreign-born population - Iran (%)
Place of birth for the foreign-born population - Kazakhstan (%)
Place of birth for the foreign-born population - Nepal (%)
Place of birth for the foreign-born population - Pakistan (%)
Place of birth for the foreign-born population - Sri Lanka (%)
Place of birth for the foreign-born population - Uzbekistan (%)
Place of birth for the foreign-born population - Other South Central Asia (%)
Place of birth for the foreign-born population - Burma (%)
Place of birth for the foreign-born population - Cambodia (%)
Place of birth for the foreign-born population - Indonesia (%)
Place of birth for the foreign-born population - Laos (%)
Place of birth for the foreign-born population - Malaysia (%)
Place of birth for the foreign-born population - Philippines (%)
Place of birth for the foreign-born population - Singapore (%)
Place of birth for the foreign-born population - Thailand (%)
Place of birth for the foreign-born population - Vietnam (%)
Place of birth for the foreign-born population - Other South Eastern Asia (%)
Place of birth for the foreign-born population - Armenia (%)
Place of birth for the foreign-born population - Iraq (%)
Place of birth for the foreign-born population - Israel (%)
Place of birth for the foreign-born population - Jordan (%)
Place of birth for the foreign-born population - Kuwait (%)
Place of birth for the foreign-born population - Lebanon (%)
Place of birth for the foreign-born population - Saudi Arabia (%)
Place of birth for the foreign-born population - Syria (%)
Place of birth for the foreign-born population - Turkey (%)
Place of birth for the foreign-born population - Yemen (%)
Place of birth for the foreign-born population - Other Western Asia (%)
Place of birth for the foreign-born population - Eritrea (%)
Place of birth for the foreign-born population - Ethiopia (%)
Place of birth for the foreign-born population - Kenya (%)
Place of birth for the foreign-born population - Somalia (%)
Place of birth for the foreign-born population - Uganda (%)
Place of birth for the foreign-born population - Zimbabwe (%)
Place of birth for the foreign-born population - Other Eastern Africa (%)
Place of birth for the foreign-born population - Cameroon (%)
Place of birth for the foreign-born population - Congo (%)
Place of birth for the foreign-born population - Democratic Republic of Congo (Zaire) (%)
Place of birth for the foreign-born population - Other Middle Africa (%)
Place of birth for the foreign-born population - Egypt (%)
Place of birth for the foreign-born population - Morocco (%)
Place of birth for the foreign-born population - Sudan (%)
Place of birth for the foreign-born population - Other Northern Africa (%)
Place of birth for the foreign-born population - South Africa (%)
Place of birth for the foreign-born population - Other Southern Africa (%)
Place of birth for the foreign-born population - Cabo Verde (%)
Place of birth for the foreign-born population - Ghana (%)
Place of birth for the foreign-born population - Liberia (%)
Place of birth for the foreign-born population - Nigeria (%)
Place of birth for the foreign-born population - Senegal (%)
Place of birth for the foreign-born population - Sierra Leone (%)
Place of birth for the foreign-born population - Other Western Africa (%)
Place of birth for the foreign-born population - Australia (%)
Place of birth for the foreign-born population - New Zealand (%)
Place of birth for the foreign-born population - Fiji (%)
Place of birth for the foreign-born population - Micronesia (%)
Place of birth for the foreign-born population - Bahamas (%)
Place of birth for the foreign-born population - Barbados (%)
Place of birth for the foreign-born population - Cuba (%)
Place of birth for the foreign-born population - Dominica (%)
Place of birth for the foreign-born population - Dominican Republic (%)
Place of birth for the foreign-born population - Grenada (%)
Place of birth for the foreign-born population - Haiti (%)
Place of birth for the foreign-born population - Jamaica (%)
Place of birth for the foreign-born population - St. Vincent and the Grenadines (%)
Place of birth for the foreign-born population - Trinidad and Tobago (%)
Place of birth for the foreign-born population - West Indies (%)
Place of birth for the foreign-born population - Other Caribbean (%)
Place of birth for the foreign-born population - Belize (%)
Place of birth for the foreign-born population - Costa Rica (%)
Place of birth for the foreign-born population - El Salvador (%)
Place of birth for the foreign-born population - Guatemala (%)
Place of birth for the foreign-born population - Honduras (%)
Place of birth for the foreign-born population - Mexico (%)
Place of birth for the foreign-born population - Nicaragua (%)
Place of birth for the foreign-born population - Panama (%)
Place of birth for the foreign-born population - Other Central America (%)
Place of birth for the foreign-born population - Argentina (%)
Place of birth for the foreign-born population - Bolivia (%)
Place of birth for the foreign-born population - Brazil (%)
Place of birth for the foreign-born population - Chile (%)
Place of birth for the foreign-born population - Colombia (%)
Place of birth for the foreign-born population - Ecuador (%)
Place of birth for the foreign-born population - Guyana (%)
Place of birth for the foreign-born population - Peru (%)
Place of birth for the foreign-born population - Uruguay (%)
Place of birth for the foreign-born population - Venezuela (%)
Place of birth for the foreign-born population - Other South America (%)
Place of birth for the foreign-born population - Canada (%)
Place of birth for the foreign-born population - Other Northern America (%)
Place of birth for the foreign-born population - Other (%)
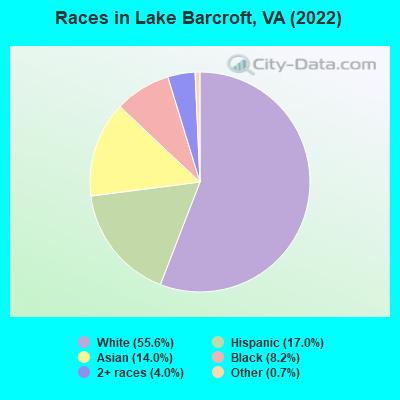
According to 2022 data, the most numerous races in Lake Barcroft, VA are White alone (5,850 residents), Black alone (860 residents), and Hispanic (1,786 residents). 62.0% of Lake Barcroft residents speak English at home. 31.9% of Lake Barcroft, VA residents are foreign-born (13.3% born in Asia, 10.1% born in Latin America, 6.0% born in Africa), which is 62.4% greater than the foreign-born rate of 12.0% across the entire state of Virginia.
Race distribution in Lake Barcroft
2000 2022
4,965,637 70.2% White alone 1,376,378 19.4% Black alone 329,540 4.7% Hispanic 259,277 3.7% Asian alone 114,022 1.6% Two or more races 18,596 0.3% American Indian alone 11,685 0.2% Other race alone 3,380 0.05% Native Hawaiian and Other
5,095,130 58.7% White alone 1,594,785 18.4% Black alone 905,750 10.4% Hispanic 602,881 6.9% Asian alone 406,047 4.7% Two or more races 60,419 0.7% Other race alone 11,738 0.1% American Indian alone 6,869 0.08% Native Hawaiian and Other
Income and house value in Lake Barcroft Median household income in 2022 $175,328 White non-Hispanic householders$94,257 Black householders$88,021 Asian householders$74,525 Some other race householders$137,596 Two or more races householders$121,307 Hispanic or Latino race householdersMedian 2022 house value $933,623 White Non-Hispanic householders$738,093 Black or African American householders $872,900 Asian householders$561,692 Some other race householders$807,925 Two or more races householders$818,856 Hispanic or Latino householders
Median age by race in Lake Barcroft
49.8 Median age for White residents49.8 48.9 38.8 Median age for Black or African American residents36.5 41.2 38.8 Median age for American Indian / Alaska Native residents12.3 34.9 44.7 Median age for Asian residents39.5 47.8 -666,666,666.0 Median age for Native Hawaiian / Pacific Islander residents-558,791,801.0 -584,518,166.9 37.1 Median age for Other race residents42.3 24.6 37.3 Median age for Two or more races residents40.4 24.6 49.7 Median age for White alone residents51.4 47.5 40.4 Median age for Hispanic or Latino residents40.8 38.8
Owner/renter occupied households by race in Lake Barcroft
House owners and renters - White residents 1,988 80.4% Owner occupied486 19.6% Renter occupiedHouse owners and renters - Black or African American residents 124 43.5% Owner occupied161 56.5% Renter occupiedHouse owners and renters - American Indian / Alaska Native residents 8 100.0% Owner occupiedHouse owners and renters - Asian residents 220 38.7% Owner occupied348 61.3% Renter occupiedHouse owners and renters - Other race residents 129 45.7% Owner occupied153 54.3% Renter occupiedHouse owners and renters - Two or more races residents 206 64.9% Owner occupied112 35.1% Renter occupiedHouse owners and renters - White alone residents 1,932 81.3% Owner occupied443 18.7% Renter occupiedHouse owners and renters - Hispanic or Latino residents 318 57.4% Owner occupied236 42.6% Renter occupied
Language usage in Lake Barcroft
English speakers - Total 62.0% of residents of Lake Barcroft speak English at home.
14.0% of residents speak Spanish at home 770 54.5% Speak English very well642 45.5% Speak English less than very well24.0% of residents speak other language at home 1,326 54.9% Speak English very well1,090 45.1% Speak English less than very well
English speakers - Born in the United States 92.6% of residents of Lake Barcroft speak English at home.
4.0% of residents speak Spanish at home 134 74.0% Speak English very well47 26.0% Speak English less than very well3.6% of residents speak other language at home 141 86.0% Speak English very well23 14.0% Speak English less than very well
English speakers - Native, born elsewhere 47.8% of residents of Lake Barcroft speak English at home.
26.1% of residents speak Spanish at home 70 92.1% Speak English very well6 7.9% Speak English less than very well26.8% of residents speak other language at home 41 52.6% Speak English very well37 47.4% Speak English less than very well
English speakers - Foreign-born 14.0% of residents of Lake Barcroft speak English at home.
28.0% of residents speak Spanish at home 382 40.8% Speak English very well555 59.2% Speak English less than very well58.0% of residents speak other language at home 907 46.7% Speak English very well1,036 53.3% Speak English less than very well
White (Caucasian) - Speak only English Native:
93.1% (4,552)Foreign-born:
24.0% (200)
White (Caucasian) - Speak another language Native:
6.8% (333)Foreign-born:
75.4% (630)
Black or African American - Speak only English Native:
96.4% (460)Foreign-born:
27.4% (85)
Black or African American - Speak another language Native:
2.0% (9)Foreign-born:
73.4% (227)
American Indian / Alaska Native - Speak only English Native:
22.5% (4)Foreign-born:
23.4% (8)
American Indian / Alaska Native - Speak another language Native:
76.1% (12)Foreign-born:
73.0% (25)
Asian - Speak only English Native:
46.9% (124)Foreign-born:
10.8% (125)
Asian - Speak another language Native:
53.4% (142)Foreign-born:
88.9% (1,034)
Other race - Speak only English Native:
35.3% (117)Foreign-born:
2.6% (12)
Other race - Speak another language Native:
62.3% (206)Foreign-born:
96.2% (458)
Two or more races - Speak only English Native:
70.1% (501)Foreign-born:
4.8% (18)
Two or more races - Speak another language Native:
30.2% (215)Foreign-born:
95.3% (358)
White alone - Speak only English Native:
92.3% (4,475)Foreign-born:
22.6% (177)
White alone - Speak another language Native:
7.5% (362)Foreign-born:
76.6% (599)
Hispanic or Latino - Speak only English Native:
47.1% (330)Foreign-born:
5.3% (53)
Hispanic or Latino - Speak another language Native:
53.0% (371)Foreign-born:
94.7% (942)
Foreign-born residents in Lake Barcroft 3,362 residents are foreign born (13.3% Asia , 10.1% Latin America , 6.0% Africa ).
This city:
31.9%Virginia:
12.6%
Marital status for residents in Lake Barcroft Marital status - White (Caucasian) population 15 years and over
Males 29.0% Never married61.4% Now married0.7% Separated0.8% Widowed8.0% DivorcedFemales 19.9% Never married58.7% Now married0.8% Separated6.1% Widowed14.5% DivorcedWomen who gave birth in the past 12 months Now married:
100.0% (27)Unmarried:
0.0% (0)
Women who did not give birth in the past 12 months Now married:
53.3% (580)Unmarried:
46.7% (509)
Marital status - Black or African American population 15 years and over
Males 38.1% Never married51.4% Now married0.0% Separated0.0% Widowed10.4% DivorcedFemales 26.5% Never married54.2% Now married6.5% Separated0.0% Widowed12.7% DivorcedWomen who did not give birth in the past 12 months Now married:
64.7% (132)Unmarried:
35.3% (72)
Marital status - American Indian / Alaska Native population 15 years and over
Males 0.0% Never married100.0% Now married0.0% Separated0.0% Widowed0.0% DivorcedFemales 27.8% Never married33.3% Now married0.0% Separated0.0% Widowed38.9% DivorcedWomen who did not give birth in the past 12 months Now married:
54.5% (6)Unmarried:
45.5% (5)
Marital status - Asian population 15 years and over
Males 42.2% Never married54.8% Now married0.0% Separated0.0% Widowed3.0% DivorcedFemales 35.2% Never married45.5% Now married2.4% Separated12.7% Widowed4.3% DivorcedWomen who gave birth in the past 12 months Now married:
100.0% (10)Unmarried:
0.0% (0)
Women who did not give birth in the past 12 months Now married:
35.3% (144)Unmarried:
64.7% (264)
Marital status - Other race population 15 years and over
Males 54.7% Never married24.3% Now married0.0% Separated2.0% Widowed19.0% DivorcedFemales 57.5% Never married14.4% Now married19.2% Separated3.8% Widowed5.1% DivorcedWomen who did not give birth in the past 12 months Now married:
30.6% (91)Unmarried:
69.4% (206)
Marital status - Two or more races population 15 years and over
Males 46.3% Never married43.8% Now married2.8% Separated0.0% Widowed7.1% DivorcedFemales 31.9% Never married40.1% Now married0.4% Separated0.0% Widowed27.6% DivorcedWomen who gave birth in the past 12 months Now married:
100.0% (11)Unmarried:
0.0% (0)
Women who did not give birth in the past 12 months Now married:
34.3% (66)Unmarried:
65.7% (126)
Marital status - White alone, not Hispanic / Latino population 15 years and over
Males 26.0% Never married63.5% Now married0.7% Separated0.9% Widowed8.9% DivorcedFemales 19.1% Never married59.5% Now married0.8% Separated5.8% Widowed14.7% DivorcedWomen who gave birth in the past 12 months Now married:
100.0% (29)Unmarried:
0.0% (0)
Women who did not give birth in the past 12 months Now married:
53.7% (585)Unmarried:
46.3% (504)
Marital status - Hispanic or Latino population 15 years and over
Males 50.0% Never married37.2% Now married1.0% Separated0.8% Widowed11.0% DivorcedFemales 42.2% Never married36.4% Now married8.1% Separated4.6% Widowed8.7% DivorcedWomen who gave birth in the past 12 months Now married:
100.0% (4)Unmarried:
0.0% (0)
Women who did not give birth in the past 12 months Now married:
35.3% (158)Unmarried:
64.7% (290)
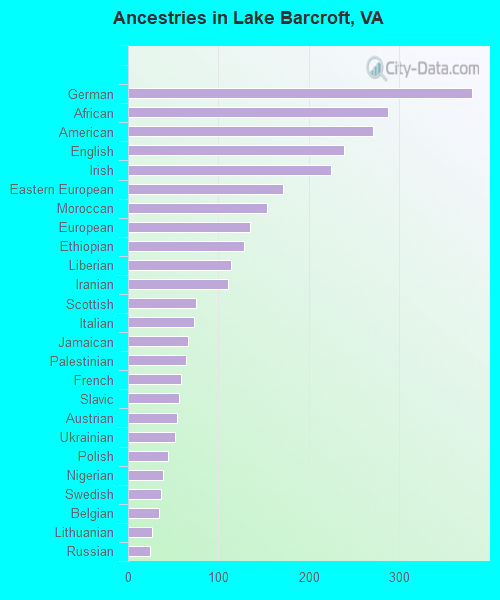
Ancestries in Lake Barcroft
380 7.0% German287 5.3% African271 5.0% American239 4.4% English224 4.1% Irish171 3.2% Eastern European154 2.8% Moroccan135 2.5% European128 2.4% Ethiopian114 2.1% Liberian110 2.0% Iranian75 1.4% Scottish73 1.4% Italian66 1.2% Jamaican64 1.2% Palestinian59 1.1% French56 1.0% Slavic54 1.0% Austrian52 1.0% Ukrainian44 0.8% Polish39 0.7% Nigerian36 0.7% Swedish34 0.6% Belgian26 0.5% Lithuanian24 0.4% Russian19 0.4% British15 0.3% Senegalese12 0.2% Scotch-Irish10 0.2% Egyptian8 0.1% Iraqi8 0.1% Scandinavian8 0.1% Czech8 0.1% Welsh7 0.1% Jordanian7 0.1% Portuguese6 0.1% Estonian6 0.1% Swiss5 0.09% Croatian4 0.07% Afghan4 0.07% Hungarian4 0.07% Norwegian4 0.07% Turkish3 0.06% Arab3 0.06% Danish2 0.04% French Canadian
Children Nativity (place of birth) in Lake Barcroft
Children under 6 years - Living with two parents Both parents native 312 100.0% NativeBoth parents foreign-born 58 100.0% NativeOne native, one foreign-born parent 73 100.0% NativeChildren under 6 years - Living with one parent Native parent 20 100.0% NativeForeign-born parent 21 58.8% Native14 41.2% Foreign-bornChildren 6 to 17 years - Living with two parents Both parents native 776 99.2% Native6 0.8% Foreign-bornBoth parents foreign-born 152 76.6% Native46 23.4% Foreign-bornOne native, one foreign-born parent 195 98.5% Native3 1.5% Foreign-bornChildren 6 to 17 years - Living with one parent Native parent 13 100.0% NativeForeign-born parent 273 54.6% Native227 45.4% Foreign-born
Grandparents responsible for own grandchildren in Lake Barcroft
Grandparents (30 to 59 years) White / Caucasian 22 100.0% Not responsible for grandchildrenTwo or more races 32 100.0% Not responsible for grandchildrenWhite alone, not Hispanic / Latino 10 100.0% Not responsible for grandchildrenHispanic or Latino 47 100.0% Not responsible for grandchildren
Grandparents (60 years and over) White / Caucasian 52 100.0% Not responsible for grandchildrenWhite alone, not Hispanic / Latino 50 100.0% Not responsible for grandchildrenHispanic or Latino 31 100.0% Not responsible for grandchildren