Races in Lady Lake, Florida (FL) Detailed Stats
Ancestries, Foreign-born residents, place of birth
Settings
X


Recent posts about races in Lady Lake, Florida on our local forum with over 2,400,000 registered users:
 | Florida's love affair with fart can vehicles (69 replies) |
| Quiet town between Orlando and Tampa (31 replies) |
| School shooting in Parkland (240 replies) |
| Lady Lake (13 replies) |
| Looking for a quiet safe city (11 replies) |
| Lady Lakes (1 reply) |
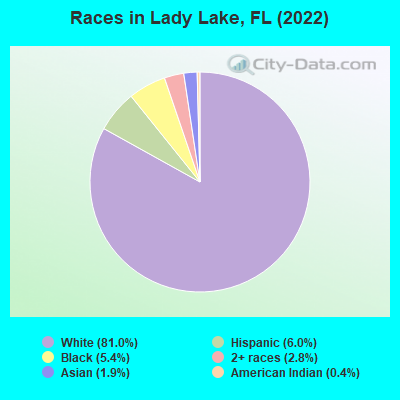
According to 2022 data, the most numerous races in Lady Lake, FL are White alone (13,784 residents), Hispanic (1,016 residents), and Black alone (921 residents). 93.1% of Lady Lake residents speak English at home. 3.7% of Lady Lake, FL residents are foreign-born (1.6% born in Europe, 0.9% born in Latin America, 0.5% born in North America, 0.4% born in Asia), which is 470.8% less than the foreign-born rate of 21.0% across the entire state of Florida.
Race distribution in Lady Lake
2000
2022

- 11,11694.0%White alone
- 3753.2%Black alone
- 2171.8%Hispanic
- 500.4%Two or more races
- 370.3%Asian alone
- 240.2%American Indian alone
- 60.05%Native Hawaiian and Other
Pacific Islander alone - 30.03%Other race alone

-
- 13,78481.0%White alone
- 1,0166.0%Hispanic
- 9215.4%Black alone
- 4832.8%Two or more races
- 3151.9%Asian alone
- 740.4%American Indian alone
2000
2022
-
- 10,458,50965.4%White alone
- 2,682,71516.8%Hispanic
- 2,264,26814.2%Black alone
- 261,6931.6%Asian alone
- 236,9541.5%Two or more races
- 42,3580.3%American Indian alone
- 28,9940.2%Other race alone
- 6,8870.04%Native Hawaiian and Other
Pacific Islander alone

-
- 11,309,40350.8%White alone
- 6,025,03927.1%Hispanic
- 3,241,01514.6%Black alone
- 861,6303.9%Two or more races
- 623,6922.8%Asian alone
- 152,0540.7%Other race alone
- 22,5040.1%American Indian alone
- 9,4860.04%Native Hawaiian and Other
Pacific Islander alone

Income and house value in Lady Lake
- Median household income in 2022
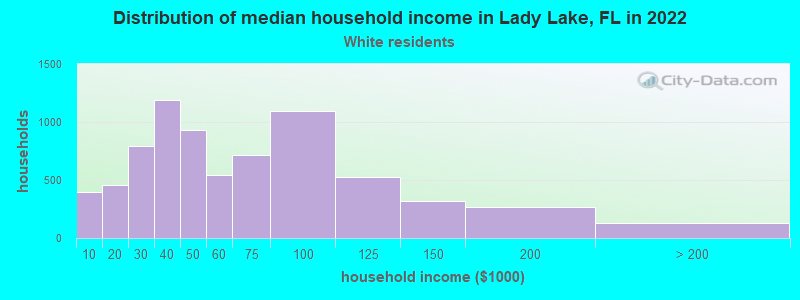
- $47,614White non-Hispanic householders
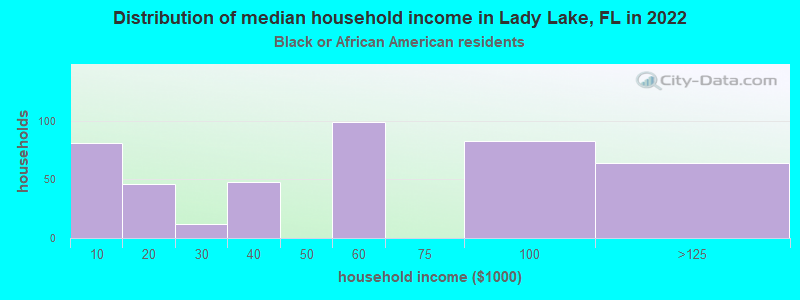
- $53,191Black householders
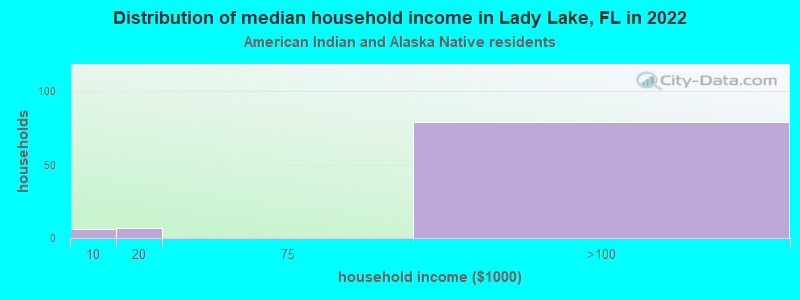
- $88,078American Indian and Alaska Native householders
- Median 2022 house value
- $275,614White Non-Hispanic householders
- $167,675Black or African American householders
- $280,937Asian householders
- $230,073Two or more races householders
- $220,018Hispanic or Latino householders
Household income for White non-Hispanic householders
Household income for Black householders
Household income for American Indian and Alaska Native householders
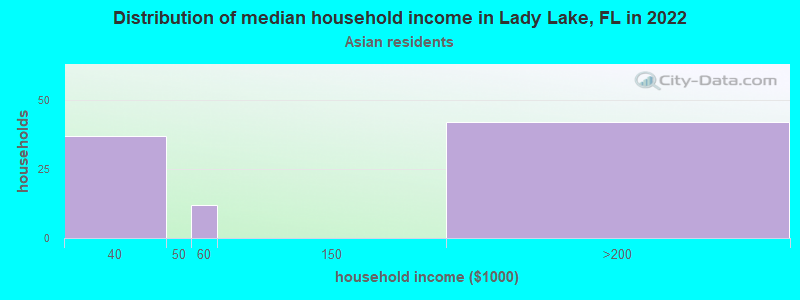
Household income for Asian householders
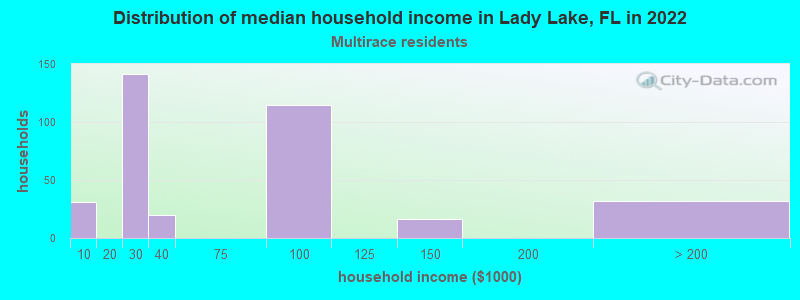
Household income for Two or more races householders
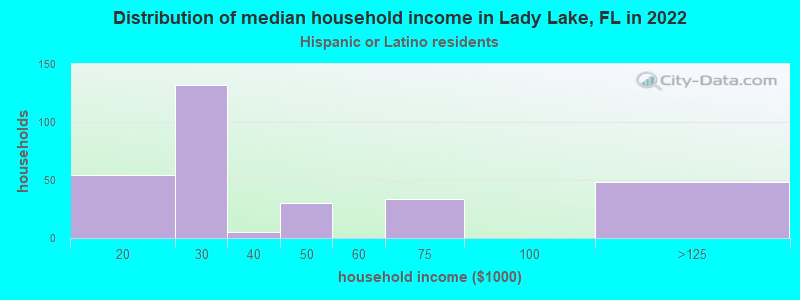
Household income for Hispanic or Latino race householders
Median age by race in Lady Lake
- 69.1Median age for White residents
- 69.6Males
- 68.8Females
- 31.2Median age for Black or African American residents
- 45.1Males
- 29.7Females
- 63.2Median age for American Indian / Alaska Native residents
- 64.2Males
- -591,194,968.0Females
- 13.6Median age for Asian residents
- 10.9Males
- 13.9Females
- -679,849,340.2Median age for Native Hawaiian / Pacific Islander residents
- -858,307,848.3Males
- -443,298,968.6Females
- 40.5Median age for Other race residents
- -666,666,666.0Males
- 36.4Females
- 35.5Median age for Two or more races residents
- 18.1Males
- 34.6Females
- 68.5Median age for White alone residents
- 69.7Males
- 67.8Females
- 32.7Median age for Hispanic or Latino residents
- 37.0Males
- 18.6Females
Owner/renter occupied households by race in Lady Lake
- House owners and renters - White residents
- 5,72076.1%Owner occupied
- 1,80123.9%Renter occupied
- House owners and renters - Black or African American residents
- 19441.2%Owner occupied
- 27658.8%Renter occupied
- House owners and renters - American Indian / Alaska Native residents
- 91100.0%Owner occupied
- House owners and renters - Asian residents
- 96100.0%Owner occupied
- House owners and renters - Other race residents
- 12100.0%Owner occupied
- House owners and renters - Two or more races residents
- 10031.2%Owner occupied
- 22168.8%Renter occupied
- House owners and renters - White alone residents
- 5,69174.4%Owner occupied
- 1,96125.6%Renter occupied
- House owners and renters - Hispanic or Latino residents
- 18360.1%Owner occupied
- 12139.9%Renter occupied
Language usage in Lady Lake
- English speakers - Total
- 93.1% of residents of Lady Lake speak English at home.
- 4.0% of residents speak Spanish at home
- 45067.4%Speak English very well
- 21832.6%Speak English less than very well
- 1.8% of residents speak other language at home
- 18763.2%Speak English very well
- 10936.8%Speak English less than very well
- English speakers - Born in the United States
- 98.1% of residents of Lady Lake speak English at home.
- 1.0% of residents speak Spanish at home
- 10388.0%Speak English very well
- 1412.0%Speak English less than very well
- 0.3% of residents speak other language at home
- 2256.4%Speak English very well
- 1743.6%Speak English less than very well
- English speakers - Native, born elsewhere
- 53.1% of residents of Lady Lake speak English at home.
- 45.1% of residents speak Spanish at home
- 17668.8%Speak English very well
- 8031.2%Speak English less than very well
- 6.2% of residents speak other language at home
- 35100.0%Speak English very well
- English speakers - Foreign-born
- 30.5% of residents of Lady Lake speak English at home.
- 30.5% of residents speak Spanish at home
- 6335.2%Speak English very well
- 11664.8%Speak English less than very well
- 41.6% of residents speak other language at home
- 14961.1%Speak English very well
- 9538.9%Speak English less than very well
White (Caucasian) - Speak only English
| Native: | 97.8% (13,116) |
| Foreign-born: | 73.6% (150) |
White (Caucasian) - Speak another language
| Native: | 2.5% (331) |
| Foreign-born: | 62.7% (127) |
Black or African American - Speak only English
| Native: | 100.0% (945) |
| Foreign-born: | 94.5% (21) |
Asian - Speak another language
| Native: | 3.4% (6) |
| Foreign-born: | 100.0% (92) |
Other race - Speak another language
| Native: | 65.8% (28) |
| Foreign-born: | 100.0% (65) |
Two or more races - Speak only English
| Native: | 90.9% (672) |
| Foreign-born: | 17.3% (10) |
Two or more races - Speak another language
| Native: | 12.0% (89) |
| Foreign-born: | 77.7% (45) |
White alone - Speak only English
| Native: | 99.2% (13,164) |
| Foreign-born: | 62.6% (172) |
White alone - Speak another language
| Native: | 0.6% (85) |
| Foreign-born: | 33.2% (91) |
Hispanic or Latino - Speak another language
| Native: | 58.8% (472) |
| Foreign-born: | 100.0% (154) |
Foreign-born residents in Lady Lake
626 residents are foreign born (1.6% Europe, 0.9% Latin America, 0.5% North America, 0.4% Asia).
| This city: | 3.7% |
| Florida: | 21.1% |


Marital status for residents in Lady Lake
Marital status - White (Caucasian) population 15 years and over
- Males
- 16.5%Never married
- 57.4%Now married
- 1.6%Separated
- 8.7%Widowed
- 15.8%Divorced
- Females
- 13.4%Never married
- 50.2%Now married
- 1.0%Separated
- 16.6%Widowed
- 18.8%Divorced
Women who gave birth in the past 12 months
| Now married: | 13.2% (20) |
| Unmarried: | 86.8% (131) |
Women who did not give birth in the past 12 months
| Now married: | 29.8% (358) |
| Unmarried: | 70.2% (842) |
Marital status - Black or African American population 15 years and over
- Males
- 43.0%Never married
- 46.7%Now married
- 0.0%Separated
- 0.0%Widowed
- 10.4%Divorced
- Females
- 52.9%Never married
- 14.4%Now married
- 0.0%Separated
- 8.5%Widowed
- 24.2%Divorced
Women who did not give birth in the past 12 months
| Now married: | 13.8% (60) |
| Unmarried: | 86.2% (378) |
Marital status - Asian population 15 years and over
- Males
- 13.5%Never married
- 86.5%Now married
- 0.0%Separated
- 0.0%Widowed
- 0.0%Divorced
- Females
- 28.8%Never married
- 10.2%Now married
- 0.0%Separated
- 0.0%Widowed
- 61.0%Divorced
Women who did not give birth in the past 12 months
| Now married: | 0.0% (0) |
| Unmarried: | 100.0% (59) |
Marital status - Other race population 15 years and over
- Males
- 100.0%Never married
- 0.0%Now married
- 0.0%Separated
- 0.0%Widowed
- 0.0%Divorced
- Females
- 0.0%Never married
- 90.6%Now married
- 0.0%Separated
- 0.0%Widowed
- 9.4%Divorced
Women who did not give birth in the past 12 months
| Now married: | 100.0% (77) |
| Unmarried: | 0.0% (0) |
Marital status - Two or more races population 15 years and over
- Males
- 47.8%Never married
- 10.2%Now married
- 0.0%Separated
- 8.6%Widowed
- 33.3%Divorced
- Females
- 63.7%Never married
- 14.6%Now married
- 0.0%Separated
- 5.0%Widowed
- 16.7%Divorced
Women who did not give birth in the past 12 months
| Now married: | 5.3% (13) |
| Unmarried: | 94.7% (231) |
Marital status - White alone, not Hispanic / Latino population 15 years and over
- Males
- 14.5%Never married
- 59.2%Now married
- 1.7%Separated
- 9.0%Widowed
- 15.7%Divorced
- Females
- 12.5%Never married
- 50.5%Now married
- 1.0%Separated
- 16.8%Widowed
- 19.2%Divorced
Women who gave birth in the past 12 months
| Now married: | 13.2% (21) |
| Unmarried: | 86.8% (141) |
Women who did not give birth in the past 12 months
| Now married: | 29.9% (352) |
| Unmarried: | 70.1% (825) |
Marital status - Hispanic or Latino population 15 years and over
- Males
- 53.6%Never married
- 17.4%Now married
- 0.0%Separated
- 3.1%Widowed
- 25.9%Divorced
- Females
- 47.3%Never married
- 41.9%Now married
- 0.0%Separated
- 9.0%Widowed
- 1.8%Divorced
Women who did not give birth in the past 12 months
| Now married: | 34.0% (77) |
| Unmarried: | 66.0% (149) |
Ancestries in Lady Lake

- 1,39015.9%English
- 1,31115.0%German
- 1,22014.0%Irish
- 6948.0%American
- 6757.7%Italian
- 3454.0%Polish
- 3133.6%French Canadian
- 2412.8%Hungarian
- 2112.4%Scottish
- 1491.7%European
- 1261.4%French
- 941.1%Norwegian
- 590.7%British
- 590.7%Scotch-Irish
- 520.6%Austrian
- 520.6%Nigerian
- 460.5%Zimbabwean
- 450.5%Croatian
- 450.5%Ukrainian
- 380.4%Dutch
- 330.4%Canadian
- 330.4%Greek
- 280.3%Welsh
- 270.3%Swedish
- 260.3%Czech
- 150.2%Swiss
- 140.2%Russian
- 110.1%Danish
- 110.1%Slovak
- 80.09%Slavic
- 70.08%Syrian
- 70.08%Finnish
- 30.03%Jamaican

Geographical mobility in Lady Lake

- Same house 1 year ago
- 11,45184.1%White (Caucasian)
- 58263.2%Black or African American
- 2223.7%American Indian / Alaska Native
- 287100.0%Asian
- 4441.5%Other race
- 66283.5%Two or more races
- 11,61284.7%White alone, not Hispanic / Latino
- 71169.6%Hispanic or Latino

-
- Moved within same county
- 5494.0%White / Caucasian
- 58463.5%Black or African American
- 8510.8%Two or more races
- 4463.3%White alone, not Hispanic / Latino
- 17016.6%Hispanic or Latino

-
- Moved within same state
- 6104.5%White / Caucasian
- 262.8%Black or African American
- 40.5%Two or more races
- 6774.9%White alone, not Hispanic / Latino
- 171.7%Hispanic or Latino

-
- Moved from different state
- 8896.5%White / Caucasian
- 5660.3%American Indian / Alaska Native
- 5854.6%Other race
- 111.4%Two or more races
- 9046.6%White alone, not Hispanic / Latino
- 515.0%Hispanic or Latino

-
- Moved from abroad
- 630.5%White
- 650.5%White alone, not Hispanic / Latino
- 171.7%Hispanic or Latino

Children Nativity (place of birth) in Lady Lake
Place of birth for residents in Lady Lake
![Place of birth for the foreign-born population - Regions]()
- 278Europe
- 236Americas
- 159Latin America
- 123Western Europe
- 95Northern Europe
- 77Northern America
- 75Central America
- 73Asia
- 73South Eastern Asia
- 58Eastern Europe
- 47Caribbean
- 37Africa
- 35South America
- 25Eastern Africa
- 12Southern Africa

![Place of birth for the foreign-born population - Countries]()
- 109Germany
- 77Canada
- 75Mexico
- 73Vietnam
- 45Ireland
- 43Cuba
- 36United Kingdom
- 36Ukraine
- 35Colombia
- 25Zimbabwe
- 13England
- 13Switzerland
- 13Croatia
- 12South Africa
- 8Hungary
- 4Jamaica

Grandparents responsible for own grandchildren in Lady Lake
Zip codes: 32195.