Races in La Salle, Illinois (IL) Detailed Stats
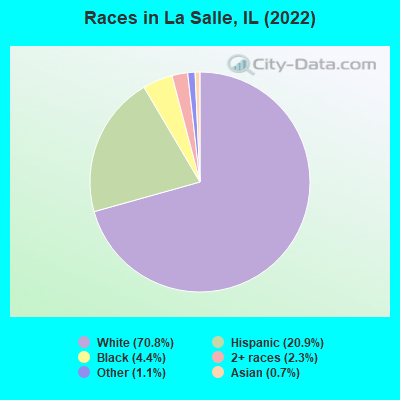
According to 2022 data, the most numerous races in La Salle, IL are White alone (6,686 residents), Hispanic (1,975 residents), and Black alone (417 residents). 86.8% of La Salle residents speak English at home. 5.6% of La Salle, IL residents are foreign-born (3.5% born in Latin America, 1.4% born in Europe, 0.6% born in Asia), which is 150.7% less than the foreign-born rate of 14.0% across the entire state of Illinois.
Race distribution in La Salle
2000 2022
8,424,140 67.8% White alone 1,856,152 14.9% Black alone 1,530,262 12.3% Hispanic 419,916 3.4% Asian alone 153,996 1.2% Two or more races 13,479 0.1% Other race alone 18,232 0.1% American Indian alone 3,116 0.03% Native Hawaiian and Other
7,356,301 58.5% White alone 2,299,726 18.3% Hispanic 1,660,423 13.2% Black alone 747,296 5.9% Asian alone 458,599 3.6% Two or more races 45,386 0.4% Other race alone 10,405 0.08% American Indian alone 3,896 0.03% Native Hawaiian and Other
Income and house value in La Salle Median household income in 2022 $44,093 White non-Hispanic householders$50,826 Black householders$148,620 Asian householders$74,662 Some other race householders$79,984 Two or more races householders$62,725 Hispanic or Latino race householdersMedian 2022 house value $108,454 White Non-Hispanic householders$111,579 American Indian or Alaska Native householders $98,338 Asian householders$90,304 Some other race householders$92,238 Two or more races householders$95,511 Hispanic or Latino householders
Median age by race in La Salle
48.1 Median age for White residents48.9 47.2 28.7 Median age for Black or African American residents22.7 42.1 -672,816,727.5 Median age for American Indian / Alaska Native residents-720,238,094.5 -666,666,666.0 41.6 Median age for Asian residents-904,109,588.1 71.6 -593,236,714.4 Median age for Native Hawaiian / Pacific Islander residents-666,666,666.0 -576,015,108.0 23.0 Median age for Other race residents50.2 19.3 21.4 Median age for Two or more races residents25.9 25.9 48.4 Median age for White alone residents49.3 47.7 22.3 Median age for Hispanic or Latino residents26.6 21.4
Owner/renter occupied households by race in La Salle
House owners and renters - White residents 2,183 65.2% Owner occupied1,164 34.8% Renter occupiedHouse owners and renters - Black or African American residents 130 100.0% Renter occupiedHouse owners and renters - Asian residents 45 100.0% Owner occupiedHouse owners and renters - Other race residents 130 62.2% Owner occupied79 37.8% Renter occupiedHouse owners and renters - Two or more races residents 314 75.5% Owner occupied102 24.5% Renter occupiedHouse owners and renters - White alone residents 2,109 66.4% Owner occupied1,068 33.6% Renter occupiedHouse owners and renters - Hispanic or Latino residents 326 56.9% Owner occupied247 43.1% Renter occupied
Language usage in La Salle
English speakers - Total 86.8% of residents of La Salle speak English at home.
11.2% of residents speak Spanish at home 576 57.8% Speak English very well420 42.2% Speak English less than very well2.5% of residents speak other language at home 166 75.8% Speak English very well53 24.2% Speak English less than very well
English speakers - Born in the United States 89.4% of residents of La Salle speak English at home.
14.8% of residents speak Spanish at home 23 13.2% Speak English very well151 86.8% Speak English less than very well3.5% of residents speak other language at home 41 100.0% Speak English very well
English speakers - Native, born elsewhere 91.5% of residents of La Salle speak English at home.
8.5% of residents speak Spanish at home 4 100.0% Speak English very well
English speakers - Foreign-born 6.0% of residents of La Salle speak English at home.
69.9% of residents speak Spanish at home 222 49.1% Speak English very well230 50.9% Speak English less than very well24.7% of residents speak other language at home 106 66.2% Speak English very well54 33.8% Speak English less than very well
White (Caucasian) - Speak only English Native:
97.1% (6,388)Foreign-born:
7.2% (18)
White (Caucasian) - Speak another language Native:
2.3% (150)Foreign-born:
95.1% (242)
Other race - Speak another language Native:
45.8% (270)Foreign-born:
97.6% (267)
Two or more races - Speak another language Native:
21.2% (207)Foreign-born:
100.0% (34)
White alone - Speak only English Native:
99.3% (6,241)Foreign-born:
8.3% (13)
White alone - Speak another language Native:
0.8% (47)Foreign-born:
100.0% (155)
Hispanic or Latino - Speak another language Native:
38.7% (506)Foreign-born:
97.8% (448)
Foreign-born residents in La Salle 527 residents are foreign born (3.5% Latin America , 1.4% Europe , 0.6% Asia ).
This city:
5.6%Illinois:
14.1%
Marital status for residents in La Salle Marital status - White (Caucasian) population 15 years and over
Males 36.2% Never married43.0% Now married0.5% Separated6.6% Widowed13.7% DivorcedFemales 29.0% Never married43.6% Now married1.8% Separated15.3% Widowed10.3% DivorcedWomen who gave birth in the past 12 months Now married:
59.1% (24)Unmarried:
40.9% (17)
Women who did not give birth in the past 12 months Now married:
35.9% (521)Unmarried:
64.1% (932)
Marital status - Black or African American population 15 years and over
Males 84.9% Never married15.1% Now married0.0% Separated0.0% Widowed0.0% DivorcedFemales 63.3% Never married12.5% Now married24.2% Separated0.0% Widowed0.0% DivorcedWomen who gave birth in the past 12 months Now married:
0.0% (0)Unmarried:
100.0% (16)
Women who did not give birth in the past 12 months Now married:
0.0% (0)Unmarried:
100.0% (61)
Marital status - Asian population 15 years and over
Males 0.0% Never married100.0% Now married0.0% Separated0.0% Widowed0.0% DivorcedFemales 0.0% Never married35.0% Now married0.0% Separated0.0% Widowed65.0% DivorcedWomen who did not give birth in the past 12 months Now married:
100.0% (7)Unmarried:
0.0% (0)
Marital status - Other race population 15 years and over
Males 25.2% Never married55.9% Now married0.0% Separated0.0% Widowed18.9% DivorcedFemales 60.1% Never married35.5% Now married0.0% Separated2.6% Widowed1.8% DivorcedWomen who gave birth in the past 12 months Now married:
100.0% (3)Unmarried:
0.0% (0)
Women who did not give birth in the past 12 months Now married:
34.1% (123)Unmarried:
65.9% (238)
Marital status - Two or more races population 15 years and over
Males 45.2% Never married54.8% Now married0.0% Separated0.0% Widowed0.0% DivorcedFemales 65.1% Never married28.5% Now married0.0% Separated0.0% Widowed6.4% DivorcedWomen who gave birth in the past 12 months Now married:
35.6% (22)Unmarried:
64.4% (40)
Women who did not give birth in the past 12 months Now married:
8.4% (16)Unmarried:
91.6% (173)
Marital status - White alone, not Hispanic / Latino population 15 years and over
Males 34.5% Never married43.2% Now married0.6% Separated7.1% Widowed14.7% DivorcedFemales 29.1% Never married43.8% Now married1.4% Separated16.1% Widowed9.6% DivorcedWomen who gave birth in the past 12 months Now married:
41.9% (12)Unmarried:
58.1% (17)
Women who did not give birth in the past 12 months Now married:
36.6% (503)Unmarried:
63.4% (872)
Marital status - Hispanic or Latino population 15 years and over
Males 41.4% Never married51.0% Now married0.0% Separated0.0% Widowed7.7% DivorcedFemales 60.4% Never married31.5% Now married1.8% Separated0.0% Widowed6.3% DivorcedWomen who gave birth in the past 12 months Now married:
49.3% (38)Unmarried:
50.7% (39)
Women who did not give birth in the past 12 months Now married:
25.6% (152)Unmarried:
74.4% (443)
Ancestries in La Salle
643 15.9% German305 7.6% American286 7.1% Irish271 6.7% Welsh230 5.7% Italian150 3.7% English114 2.8% Polish95 2.4% African58 1.4% Slovene53 1.3% European45 1.1% Australian44 1.1% Russian43 1.1% Czech42 1.0% Norwegian37 0.9% French Canadian34 0.8% Belgian25 0.6% Greek23 0.6% Portuguese18 0.4% Slavic15 0.4% Lithuanian14 0.3% Scotch-Irish13 0.3% French12 0.3% Slovak11 0.3% Scottish10 0.2% Dutch8 0.2% Swedish1 0.02% Croatian1 0.02% Yugoslavian
Children Nativity (place of birth) in La Salle
Children under 6 years - Living with two parents Both parents native 199 100.0% NativeBoth parents foreign-born 10 100.0% NativeOne native, one foreign-born parent 39 100.0% NativeChildren under 6 years - Living with one parent Native parent 326 100.0% NativeForeign-born parent 8 100.0% NativeChildren 6 to 17 years - Living with two parents Both parents native 438 100.0% NativeBoth parents foreign-born 160 90.9% Native16 9.1% Foreign-bornOne native, one foreign-born parent 29 100.0% NativeChildren 6 to 17 years - Living with one parent Native parent 618 100.0% NativeForeign-born parent 20 49.8% Native20 50.2% Foreign-born
Grandparents responsible for own grandchildren in La Salle
Grandparents (30 to 59 years) White / Caucasian 24 43.3% Responsible for grandchildren32 56.7% Not responsible for grandchildrenBlack or African American 25 100.0% Not responsible for grandchildrenWhite alone, not Hispanic / Latino 24 42.6% Responsible for grandchildren33 57.4% Not responsible for grandchildren
Grandparents (60 years and over) White / Caucasian 20 100.0% Responsible for grandchildrenWhite alone, not Hispanic / Latino 20 100.0% Responsible for grandchildren