Races in La Grange, Illinois (IL) Detailed Stats
Data:
Races - White alone (%)
Races - White alone (% change since 2000)
Races - Black alone (%)
Races - Black alone (% change since 2000)
Races - American Indian alone (%)
Races - American Indian alone (% change since 2000)
Races - Asian alone (%)
Races - Asian alone (% change since 2000)
Races - Hispanic (%)
Races - Hispanic (% change since 2000)
Races - Native Hawaiian and Other Pacific Islander alone (%)
Races - Native Hawaiian and Other Pacific Islander alone (% change since 2000)
Races - Two or more races(%)
Races - Two or more races(% change since 2000)
Races - Other race alone (%)
Races - Other race alone (% change since 2000)
Racial diversity
Place of birth - Born in state of residence (%)
Place of birth - Born in state of residence (%) - White
Place of birth - Born in state of residence (%) - Black or African American
Place of birth - Born in state of residence (%) - Asian
Place of birth - Born in state of residence (%) - Hispanic or Latino
Place of birth - Born in state of residence (%) - American Indian and Alaska Native
Place of birth - Born in state of residence (%) - Multirace
Place of birth - Born in state of residence (%) - Other Race
Place of birth - Born in other state (%)
Place of birth - Born in other state (%) - White
Place of birth - Born in other state (%) - Black or African American
Place of birth - Born in other state (%) - Asian
Place of birth - Born in other state (%) - Hispanic or Latino
Place of birth - Born in other state (%) - American Indian and Alaska Native
Place of birth - Born in other state (%) - Multirace
Place of birth - Born in other state (%) - Other Race
Place of birth - Native, outside of US (%)
Place of birth - Native, outside of US (%) - White
Place of birth - Native, outside of US (%) - Black or African American
Place of birth - Native, outside of US (%) - Asian
Place of birth - Native, outside of US (%) - Hispanic or Latino
Place of birth - Native, outside of US (%) - American Indian and Alaska Native
Place of birth - Native, outside of US (%) - Multirace
Place of birth - Native, outside of US (%) - Other Race
Place of birth - Foreign born (%)
Place of birth - Foreign born (%) - White
Place of birth - Foreign born (%) - Black or African American
Place of birth - Foreign born (%) - Asian
Place of birth - Foreign born (%) - Hispanic or Latino
Place of birth - Foreign born (%) - American Indian and Alaska Native
Place of birth - Foreign born (%) - Multirace
Place of birth - Foreign born (%) - Other Race
Residents speaking English at home (%)
Residents speaking English at home - Born in the United States (%)
Residents speaking English at home - Native, born elsewhere (%)
Residents speaking English at home - Foreign born (%)
Residents speaking Spanish at home (%)
Residents speaking Spanish at home - Born in the United States (%)
Residents speaking Spanish at home - Native, born elsewhere (%)
Residents speaking Spanish at home - Foreign born (%)
Residents speaking other language at home (%)
Residents speaking other language at home - Born in the United States (%)
Residents speaking other language at home - Native, born elsewhere (%)
Residents speaking other language at home - Foreign born (%)
Marital status - Never married (%)
Marital status - Now married (%)
Marital status - Separated (%)
Marital status - Widowed (%)
Marital status - Divorced (%)
Ancestries Reported - Arab (%)
Ancestries Reported - Czech (%)
Ancestries Reported - Danish (%)
Ancestries Reported - Dutch (%)
Ancestries Reported - English (%)
Ancestries Reported - French (%)
Ancestries Reported - French Canadian (%)
Ancestries Reported - German (%)
Ancestries Reported - Greek (%)
Ancestries Reported - Hungarian (%)
Ancestries Reported - Irish (%)
Ancestries Reported - Italian (%)
Ancestries Reported - Lithuanian (%)
Ancestries Reported - Norwegian (%)
Ancestries Reported - Polish (%)
Ancestries Reported - Portuguese (%)
Ancestries Reported - Russian (%)
Ancestries Reported - Scotch-Irish (%)
Ancestries Reported - Scottish (%)
Ancestries Reported - Slovak (%)
Ancestries Reported - Subsaharan African (%)
Ancestries Reported - Swedish (%)
Ancestries Reported - Swiss (%)
Ancestries Reported - Ukrainian (%)
Ancestries Reported - United States (%)
Ancestries Reported - Welsh (%)
Ancestries Reported - West Indian (%)
Ancestries Reported - Other (%)
Geographical mobility - Same house 1 year ago (%)
Geographical mobility - Same house 1 year ago (%) - White
Geographical mobility - Same house 1 year ago (%) - Black or African American
Geographical mobility - Same house 1 year ago (%) - Asian
Geographical mobility - Same house 1 year ago (%) - Hispanic or Latino
Geographical mobility - Same house 1 year ago (%) - American Indian and Alaska Native
Geographical mobility - Same house 1 year ago (%) - Multirace
Geographical mobility - Same house 1 year ago (%) - Other Race
Geographical mobility - Moved within same county (%)
Geographical mobility - Moved within same county (%) - White
Geographical mobility - Moved within same county (%) - Black or African American
Geographical mobility - Moved within same county (%) - Asian
Geographical mobility - Moved within same county (%) - Hispanic or Latino
Geographical mobility - Moved within same county (%) - American Indian and Alaska Native
Geographical mobility - Moved within same county (%) - Multirace
Geographical mobility - Moved within same county (%) - Other Race
Geographical mobility - Moved from different county within same state (%)
Geographical mobility - Moved from different county within same state (%) - White
Geographical mobility - Moved from different county within same state (%) - Black or African American
Geographical mobility - Moved from different county within same state (%) - Asian
Geographical mobility - Moved from different county within same state (%) - Hispanic or Latino
Geographical mobility - Moved from different county within same state (%) - American Indian and Alaska Native
Geographical mobility - Moved from different county within same state (%) - Multirace
Geographical mobility - Moved from different county within same state (%) - Other Race
Geographical mobility - Moved from different state (%)
Geographical mobility - Moved from different state (%) - White
Geographical mobility - Moved from different state (%) - Black or African American
Geographical mobility - Moved from different state (%) - Asian
Geographical mobility - Moved from different state (%) - Hispanic or Latino
Geographical mobility - Moved from different state (%) - American Indian and Alaska Native
Geographical mobility - Moved from different state (%) - Multirace
Geographical mobility - Moved from different state (%) - Other Race
Geographical mobility - Moved from abroad (%)
Geographical mobility - Moved from abroad (%) - White
Geographical mobility - Moved from abroad (%) - Black or African American
Geographical mobility - Moved from abroad (%) - Asian
Geographical mobility - Moved from abroad (%) - Hispanic or Latino
Geographical mobility - Moved from abroad (%) - American Indian and Alaska Native
Geographical mobility - Moved from abroad (%) - Multirace
Geographical mobility - Moved from abroad (%) - Other Race
Place of birth for the foreign-born population - Ireland (%)
Place of birth for the foreign-born population - Denmark (%)
Place of birth for the foreign-born population - Norway (%)
Place of birth for the foreign-born population - Sweden (%)
Place of birth for the foreign-born population - United Kingdom (%)
Place of birth for the foreign-born population - England (%)
Place of birth for the foreign-born population - Scotland (%)
Place of birth for the foreign-born population - Other Northern Europe (%)
Place of birth for the foreign-born population - Austria (%)
Place of birth for the foreign-born population - Belgium (%)
Place of birth for the foreign-born population - France (%)
Place of birth for the foreign-born population - Germany (%)
Place of birth for the foreign-born population - Netherlands (%)
Place of birth for the foreign-born population - Switzerland (%)
Place of birth for the foreign-born population - Other Western Europe (%)
Place of birth for the foreign-born population - Greece (%)
Place of birth for the foreign-born population - Italy (%)
Place of birth for the foreign-born population - Portugal (%)
Place of birth for the foreign-born population - Spain (%)
Place of birth for the foreign-born population - Other Southern Europe (%)
Place of birth for the foreign-born population - Albania (%)
Place of birth for the foreign-born population - Belarus (%)
Place of birth for the foreign-born population - Bosnia and Herzegovina (%)
Place of birth for the foreign-born population - Bulgaria (%)
Place of birth for the foreign-born population - Croatia (%)
Place of birth for the foreign-born population - Czechoslovakia (%)
Place of birth for the foreign-born population - Hungary (%)
Place of birth for the foreign-born population - Latvia (%)
Place of birth for the foreign-born population - Lithuania (%)
Place of birth for the foreign-born population - North Macedonia (Macedonia) (%)
Place of birth for the foreign-born population - Moldova (%)
Place of birth for the foreign-born population - Poland (%)
Place of birth for the foreign-born population - Romania (%)
Place of birth for the foreign-born population - Russia (%)
Place of birth for the foreign-born population - Serbia (%)
Place of birth for the foreign-born population - Ukraine (%)
Place of birth for the foreign-born population - Other Eastern Europe (%)
Place of birth for the foreign-born population - China (%)
Place of birth for the foreign-born population - Hong Kong (%)
Place of birth for the foreign-born population - Taiwan (%)
Place of birth for the foreign-born population - Japan (%)
Place of birth for the foreign-born population - Korea (%)
Place of birth for the foreign-born population - Other Eastern Asia (%)
Place of birth for the foreign-born population - Afghanistan (%)
Place of birth for the foreign-born population - Bangladesh (%)
Place of birth for the foreign-born population - India (%)
Place of birth for the foreign-born population - Iran (%)
Place of birth for the foreign-born population - Kazakhstan (%)
Place of birth for the foreign-born population - Nepal (%)
Place of birth for the foreign-born population - Pakistan (%)
Place of birth for the foreign-born population - Sri Lanka (%)
Place of birth for the foreign-born population - Uzbekistan (%)
Place of birth for the foreign-born population - Other South Central Asia (%)
Place of birth for the foreign-born population - Burma (%)
Place of birth for the foreign-born population - Cambodia (%)
Place of birth for the foreign-born population - Indonesia (%)
Place of birth for the foreign-born population - Laos (%)
Place of birth for the foreign-born population - Malaysia (%)
Place of birth for the foreign-born population - Philippines (%)
Place of birth for the foreign-born population - Singapore (%)
Place of birth for the foreign-born population - Thailand (%)
Place of birth for the foreign-born population - Vietnam (%)
Place of birth for the foreign-born population - Other South Eastern Asia (%)
Place of birth for the foreign-born population - Armenia (%)
Place of birth for the foreign-born population - Iraq (%)
Place of birth for the foreign-born population - Israel (%)
Place of birth for the foreign-born population - Jordan (%)
Place of birth for the foreign-born population - Kuwait (%)
Place of birth for the foreign-born population - Lebanon (%)
Place of birth for the foreign-born population - Saudi Arabia (%)
Place of birth for the foreign-born population - Syria (%)
Place of birth for the foreign-born population - Turkey (%)
Place of birth for the foreign-born population - Yemen (%)
Place of birth for the foreign-born population - Other Western Asia (%)
Place of birth for the foreign-born population - Eritrea (%)
Place of birth for the foreign-born population - Ethiopia (%)
Place of birth for the foreign-born population - Kenya (%)
Place of birth for the foreign-born population - Somalia (%)
Place of birth for the foreign-born population - Uganda (%)
Place of birth for the foreign-born population - Zimbabwe (%)
Place of birth for the foreign-born population - Other Eastern Africa (%)
Place of birth for the foreign-born population - Cameroon (%)
Place of birth for the foreign-born population - Congo (%)
Place of birth for the foreign-born population - Democratic Republic of Congo (Zaire) (%)
Place of birth for the foreign-born population - Other Middle Africa (%)
Place of birth for the foreign-born population - Egypt (%)
Place of birth for the foreign-born population - Morocco (%)
Place of birth for the foreign-born population - Sudan (%)
Place of birth for the foreign-born population - Other Northern Africa (%)
Place of birth for the foreign-born population - South Africa (%)
Place of birth for the foreign-born population - Other Southern Africa (%)
Place of birth for the foreign-born population - Cabo Verde (%)
Place of birth for the foreign-born population - Ghana (%)
Place of birth for the foreign-born population - Liberia (%)
Place of birth for the foreign-born population - Nigeria (%)
Place of birth for the foreign-born population - Senegal (%)
Place of birth for the foreign-born population - Sierra Leone (%)
Place of birth for the foreign-born population - Other Western Africa (%)
Place of birth for the foreign-born population - Australia (%)
Place of birth for the foreign-born population - New Zealand (%)
Place of birth for the foreign-born population - Fiji (%)
Place of birth for the foreign-born population - Micronesia (%)
Place of birth for the foreign-born population - Bahamas (%)
Place of birth for the foreign-born population - Barbados (%)
Place of birth for the foreign-born population - Cuba (%)
Place of birth for the foreign-born population - Dominica (%)
Place of birth for the foreign-born population - Dominican Republic (%)
Place of birth for the foreign-born population - Grenada (%)
Place of birth for the foreign-born population - Haiti (%)
Place of birth for the foreign-born population - Jamaica (%)
Place of birth for the foreign-born population - St. Vincent and the Grenadines (%)
Place of birth for the foreign-born population - Trinidad and Tobago (%)
Place of birth for the foreign-born population - West Indies (%)
Place of birth for the foreign-born population - Other Caribbean (%)
Place of birth for the foreign-born population - Belize (%)
Place of birth for the foreign-born population - Costa Rica (%)
Place of birth for the foreign-born population - El Salvador (%)
Place of birth for the foreign-born population - Guatemala (%)
Place of birth for the foreign-born population - Honduras (%)
Place of birth for the foreign-born population - Mexico (%)
Place of birth for the foreign-born population - Nicaragua (%)
Place of birth for the foreign-born population - Panama (%)
Place of birth for the foreign-born population - Other Central America (%)
Place of birth for the foreign-born population - Argentina (%)
Place of birth for the foreign-born population - Bolivia (%)
Place of birth for the foreign-born population - Brazil (%)
Place of birth for the foreign-born population - Chile (%)
Place of birth for the foreign-born population - Colombia (%)
Place of birth for the foreign-born population - Ecuador (%)
Place of birth for the foreign-born population - Guyana (%)
Place of birth for the foreign-born population - Peru (%)
Place of birth for the foreign-born population - Uruguay (%)
Place of birth for the foreign-born population - Venezuela (%)
Place of birth for the foreign-born population - Other South America (%)
Place of birth for the foreign-born population - Canada (%)
Place of birth for the foreign-born population - Other Northern America (%)
Place of birth for the foreign-born population - Other (%)
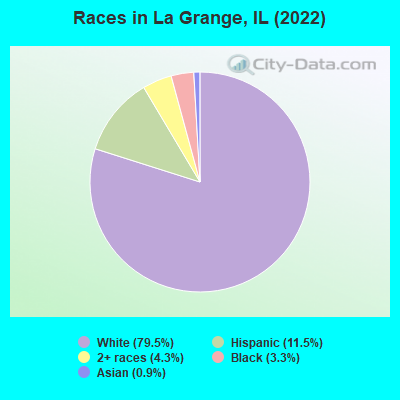
According to 2022 data, the most numerous races in La Grange, IL are White alone (12,544 residents), Hispanic (1,808 residents), and Black alone (518 residents). 87.5% of La Grange residents speak English at home. 6.6% of La Grange, IL residents are foreign-born (2.9% born in Europe, 2.8% born in Latin America), which is 111.7% less than the foreign-born rate of 14.0% across the entire state of Illinois.
Race distribution in La Grange
2000 2022
8,424,140 67.8% White alone 1,856,152 14.9% Black alone 1,530,262 12.3% Hispanic 419,916 3.4% Asian alone 153,996 1.2% Two or more races 13,479 0.1% Other race alone 18,232 0.1% American Indian alone 3,116 0.03% Native Hawaiian and Other
7,356,301 58.5% White alone 2,299,726 18.3% Hispanic 1,660,423 13.2% Black alone 747,296 5.9% Asian alone 458,599 3.6% Two or more races 45,386 0.4% Other race alone 10,405 0.08% American Indian alone 3,896 0.03% Native Hawaiian and Other
Income and house value in La Grange Median household income in 2022 $143,116 White non-Hispanic householders$102,666 Black householders$117,533 Asian householders$58,962 Some other race householders$161,554 Two or more races householders$112,687 Hispanic or Latino race householdersMedian 2022 house value $605,942 White Non-Hispanic householders$302,201 Black or African American householders $217,145 Asian householders$416,708 Some other race householders$521,985 Two or more races householders$554,952 Hispanic or Latino householders
Median age by race in La Grange
45.6 Median age for White residents43.9 47.2 50.7 Median age for Black or African American residents51.2 48.0 -680,473,372.1 Median age for American Indian / Alaska Native residents-736,736,736.0 -641,399,416.3 43.6 Median age for Asian residents41.0 44.2 -687,999,999.3 Median age for Native Hawaiian / Pacific Islander residents-918,721,460.3 -610,229,276.3 37.7 Median age for Other race residents33.1 39.5 14.8 Median age for Two or more races residents14.4 15.3 45.9 Median age for White alone residents44.4 46.7 22.9 Median age for Hispanic or Latino residents22.7 25.5
Owner/renter occupied households by race in La Grange
House owners and renters - White residents 4,027 83.4% Owner occupied804 16.6% Renter occupiedHouse owners and renters - Black or African American residents 69 55.1% Owner occupied56 44.9% Renter occupiedHouse owners and renters - American Indian / Alaska Native residents 21 100.0% Owner occupiedHouse owners and renters - Asian residents 64 100.0% Owner occupiedHouse owners and renters - Other race residents 131 52.2% Owner occupied120 47.8% Renter occupiedHouse owners and renters - Two or more races residents 271 94.4% Owner occupied16 5.6% Renter occupiedHouse owners and renters - White alone residents 4,103 82.8% Owner occupied851 17.2% Renter occupiedHouse owners and renters - Hispanic or Latino residents 394 73.5% Owner occupied142 26.5% Renter occupied
Language usage in La Grange
English speakers - Total 87.5% of residents of La Grange speak English at home.
7.6% of residents speak Spanish at home 940 82.9% Speak English very well194 17.1% Speak English less than very well4.2% of residents speak other language at home 384 61.6% Speak English very well239 38.4% Speak English less than very well
English speakers - Born in the United States 95.7% of residents of La Grange speak English at home.
2.2% of residents speak Spanish at home 57 100.0% Speak English very well1.8% of residents speak other language at home 46 100.0% Speak English very well
English speakers - Native, born elsewhere 87.5% of residents of La Grange speak English at home.
14.4% of residents speak Spanish at home 15 100.0% Speak English very well
English speakers - Foreign-born 29.2% of residents of La Grange speak English at home.
39.3% of residents speak Spanish at home 301 73.4% Speak English very well109 26.6% Speak English less than very well29.7% of residents speak other language at home 109 35.2% Speak English very well201 64.8% Speak English less than very well
White (Caucasian) - Speak only English Native:
98.8% (10,914)Foreign-born:
43.5% (202)
White (Caucasian) - Speak another language Native:
4.1% (453)Foreign-born:
58.7% (272)
Black or African American - Speak only English Native:
100.0% (501)Foreign-born:
100.0% (20)
Asian - Speak only English Native:
91.8% (67)Foreign-born:
67.2% (45)
Asian - Speak another language Native:
8.5% (6)Foreign-born:
24.6% (16)
Other race - Speak another language Native:
77.6% (262)Foreign-born:
100.0% (310)
Two or more races - Speak only English Native:
81.4% (970)Foreign-born:
8.3% (7)
Two or more races - Speak another language Native:
15.8% (189)Foreign-born:
91.7% (79)
White alone - Speak only English Native:
96.0% (10,901)Foreign-born:
37.6% (190)
White alone - Speak another language Native:
3.5% (397)Foreign-born:
59.9% (303)
Hispanic or Latino - Speak only English Native:
49.1% (613)Foreign-born:
8.5% (38)
Hispanic or Latino - Speak another language Native:
51.9% (648)Foreign-born:
91.0% (404)
Foreign-born residents in La Grange 1,043 residents are foreign born (2.9% Europe , 2.8% Latin America ).
This city:
6.6%Illinois:
14.1%
Marital status for residents in La Grange Marital status - White (Caucasian) population 15 years and over
Males 27.3% Never married65.9% Now married1.2% Separated1.1% Widowed4.5% DivorcedFemales 24.8% Never married57.3% Now married0.8% Separated8.5% Widowed8.6% DivorcedWomen who gave birth in the past 12 months Now married:
84.2% (131)Unmarried:
15.8% (25)
Women who did not give birth in the past 12 months Now married:
56.2% (1,205)Unmarried:
43.8% (941)
Marital status - Black or African American population 15 years and over
Males 34.2% Never married42.8% Now married0.0% Separated0.0% Widowed23.0% DivorcedFemales 40.5% Never married19.0% Now married0.0% Separated13.7% Widowed26.8% DivorcedWomen who did not give birth in the past 12 months Now married:
7.2% (9)Unmarried:
92.8% (121)
Marital status - American Indian / Alaska Native population 15 years and over
Males 0.0% Never married100.0% Now married0.0% Separated0.0% Widowed0.0% DivorcedFemales 0.0% Never married100.0% Now married0.0% Separated0.0% Widowed0.0% DivorcedMarital status - Asian population 15 years and over
Males 18.4% Never married81.6% Now married0.0% Separated0.0% Widowed0.0% DivorcedFemales 16.0% Never married66.7% Now married0.0% Separated17.3% Widowed0.0% DivorcedWomen who did not give birth in the past 12 months Now married:
80.6% (55)Unmarried:
19.4% (13)
Marital status - Other race population 15 years and over
Males 20.8% Never married44.8% Now married12.5% Separated0.0% Widowed21.9% DivorcedFemales 55.3% Never married44.3% Now married0.0% Separated0.0% Widowed0.4% DivorcedWomen who did not give birth in the past 12 months Now married:
38.4% (91)Unmarried:
61.6% (147)
Marital status - Two or more races population 15 years and over
Males 31.7% Never married67.6% Now married0.0% Separated0.7% Widowed0.0% DivorcedFemales 25.7% Never married62.6% Now married0.0% Separated5.3% Widowed6.3% DivorcedWomen who gave birth in the past 12 months Now married:
100.0% (28)Unmarried:
0.0% (0)
Women who did not give birth in the past 12 months Now married:
56.9% (121)Unmarried:
43.1% (92)
Marital status - White alone, not Hispanic / Latino population 15 years and over
Males 26.5% Never married66.6% Now married1.3% Separated1.1% Widowed4.6% DivorcedFemales 24.1% Never married58.2% Now married0.9% Separated8.7% Widowed8.1% DivorcedWomen who gave birth in the past 12 months Now married:
83.0% (135)Unmarried:
17.0% (28)
Women who did not give birth in the past 12 months Now married:
58.2% (1,269)Unmarried:
41.8% (911)
Marital status - Hispanic or Latino population 15 years and over
Males 31.6% Never married55.4% Now married4.1% Separated0.3% Widowed8.6% DivorcedFemales 41.7% Never married45.5% Now married0.0% Separated2.6% Widowed10.2% DivorcedWomen who gave birth in the past 12 months Now married:
100.0% (23)Unmarried:
0.0% (0)
Women who did not give birth in the past 12 months Now married:
39.2% (205)Unmarried:
60.8% (317)
Ancestries in La Grange
1,202 18.0% Irish777 11.6% Polish471 7.1% American430 6.4% German400 6.0% English290 4.3% Italian268 4.0% Serbian192 2.9% Czech144 2.2% Palestinian113 1.7% European76 1.1% Scottish69 1.0% Slovak68 1.0% Lithuanian61 0.9% Croatian47 0.7% Greek46 0.7% Slovene42 0.6% French39 0.6% Haitian38 0.6% Russian38 0.6% Swedish37 0.6% Norwegian30 0.4% Eastern European26 0.4% Ukrainian25 0.4% Latvian24 0.4% Macedonian21 0.3% Dutch18 0.3% Scandinavian16 0.2% Canadian13 0.2% British11 0.2% Portuguese11 0.2% Scotch-Irish10 0.1% Belgian9 0.1% Northern European8 0.1% Luxembourger8 0.1% Welsh7 0.1% Austrian6 0.09% Arab6 0.09% African5 0.07% Danish
Children Nativity (place of birth) in La Grange
Children under 6 years - Living with two parents Both parents native 833 100.0% NativeOne native, one foreign-born parent 56 100.0% NativeChildren under 6 years - Living with one parent Native parent 68 100.0% NativeForeign-born parent 39 100.0% NativeChildren 6 to 17 years - Living with two parents Both parents native 2,432 99.4% Native15 0.6% Foreign-bornBoth parents foreign-born 136 100.0% NativeOne native, one foreign-born parent 188 100.0% NativeChildren 6 to 17 years - Living with one parent Native parent 318 100.0% NativeForeign-born parent 134 50.1% Native134 49.9% Foreign-born
Grandparents responsible for own grandchildren in La Grange
Grandparents (30 to 59 years) White / Caucasian 5 100.0% Not responsible for grandchildrenWhite alone, not Hispanic / Latino 4 100.0% Not responsible for grandchildrenGrandparents (60 years and over) White / Caucasian 49 43.4% Responsible for grandchildren64 56.6% Not responsible for grandchildrenWhite alone, not Hispanic / Latino 60 42.2% Responsible for grandchildren82 57.8% Not responsible for grandchildren