Races in Knightdale, North Carolina (NC) Detailed Stats
Data:
Races - White alone (%)
Races - White alone (% change since 2000)
Races - Black alone (%)
Races - Black alone (% change since 2000)
Races - American Indian alone (%)
Races - American Indian alone (% change since 2000)
Races - Asian alone (%)
Races - Asian alone (% change since 2000)
Races - Hispanic (%)
Races - Hispanic (% change since 2000)
Races - Native Hawaiian and Other Pacific Islander alone (%)
Races - Native Hawaiian and Other Pacific Islander alone (% change since 2000)
Races - Two or more races(%)
Races - Two or more races(% change since 2000)
Races - Other race alone (%)
Races - Other race alone (% change since 2000)
Racial diversity
Place of birth - Born in state of residence (%)
Place of birth - Born in state of residence (%) - White
Place of birth - Born in state of residence (%) - Black or African American
Place of birth - Born in state of residence (%) - Asian
Place of birth - Born in state of residence (%) - Hispanic or Latino
Place of birth - Born in state of residence (%) - American Indian and Alaska Native
Place of birth - Born in state of residence (%) - Multirace
Place of birth - Born in state of residence (%) - Other Race
Place of birth - Born in other state (%)
Place of birth - Born in other state (%) - White
Place of birth - Born in other state (%) - Black or African American
Place of birth - Born in other state (%) - Asian
Place of birth - Born in other state (%) - Hispanic or Latino
Place of birth - Born in other state (%) - American Indian and Alaska Native
Place of birth - Born in other state (%) - Multirace
Place of birth - Born in other state (%) - Other Race
Place of birth - Native, outside of US (%)
Place of birth - Native, outside of US (%) - White
Place of birth - Native, outside of US (%) - Black or African American
Place of birth - Native, outside of US (%) - Asian
Place of birth - Native, outside of US (%) - Hispanic or Latino
Place of birth - Native, outside of US (%) - American Indian and Alaska Native
Place of birth - Native, outside of US (%) - Multirace
Place of birth - Native, outside of US (%) - Other Race
Place of birth - Foreign born (%)
Place of birth - Foreign born (%) - White
Place of birth - Foreign born (%) - Black or African American
Place of birth - Foreign born (%) - Asian
Place of birth - Foreign born (%) - Hispanic or Latino
Place of birth - Foreign born (%) - American Indian and Alaska Native
Place of birth - Foreign born (%) - Multirace
Place of birth - Foreign born (%) - Other Race
Residents speaking English at home (%)
Residents speaking English at home - Born in the United States (%)
Residents speaking English at home - Native, born elsewhere (%)
Residents speaking English at home - Foreign born (%)
Residents speaking Spanish at home (%)
Residents speaking Spanish at home - Born in the United States (%)
Residents speaking Spanish at home - Native, born elsewhere (%)
Residents speaking Spanish at home - Foreign born (%)
Residents speaking other language at home (%)
Residents speaking other language at home - Born in the United States (%)
Residents speaking other language at home - Native, born elsewhere (%)
Residents speaking other language at home - Foreign born (%)
Marital status - Never married (%)
Marital status - Now married (%)
Marital status - Separated (%)
Marital status - Widowed (%)
Marital status - Divorced (%)
Ancestries Reported - Arab (%)
Ancestries Reported - Czech (%)
Ancestries Reported - Danish (%)
Ancestries Reported - Dutch (%)
Ancestries Reported - English (%)
Ancestries Reported - French (%)
Ancestries Reported - French Canadian (%)
Ancestries Reported - German (%)
Ancestries Reported - Greek (%)
Ancestries Reported - Hungarian (%)
Ancestries Reported - Irish (%)
Ancestries Reported - Italian (%)
Ancestries Reported - Lithuanian (%)
Ancestries Reported - Norwegian (%)
Ancestries Reported - Polish (%)
Ancestries Reported - Portuguese (%)
Ancestries Reported - Russian (%)
Ancestries Reported - Scotch-Irish (%)
Ancestries Reported - Scottish (%)
Ancestries Reported - Slovak (%)
Ancestries Reported - Subsaharan African (%)
Ancestries Reported - Swedish (%)
Ancestries Reported - Swiss (%)
Ancestries Reported - Ukrainian (%)
Ancestries Reported - United States (%)
Ancestries Reported - Welsh (%)
Ancestries Reported - West Indian (%)
Ancestries Reported - Other (%)
Geographical mobility - Same house 1 year ago (%)
Geographical mobility - Same house 1 year ago (%) - White
Geographical mobility - Same house 1 year ago (%) - Black or African American
Geographical mobility - Same house 1 year ago (%) - Asian
Geographical mobility - Same house 1 year ago (%) - Hispanic or Latino
Geographical mobility - Same house 1 year ago (%) - American Indian and Alaska Native
Geographical mobility - Same house 1 year ago (%) - Multirace
Geographical mobility - Same house 1 year ago (%) - Other Race
Geographical mobility - Moved within same county (%)
Geographical mobility - Moved within same county (%) - White
Geographical mobility - Moved within same county (%) - Black or African American
Geographical mobility - Moved within same county (%) - Asian
Geographical mobility - Moved within same county (%) - Hispanic or Latino
Geographical mobility - Moved within same county (%) - American Indian and Alaska Native
Geographical mobility - Moved within same county (%) - Multirace
Geographical mobility - Moved within same county (%) - Other Race
Geographical mobility - Moved from different county within same state (%)
Geographical mobility - Moved from different county within same state (%) - White
Geographical mobility - Moved from different county within same state (%) - Black or African American
Geographical mobility - Moved from different county within same state (%) - Asian
Geographical mobility - Moved from different county within same state (%) - Hispanic or Latino
Geographical mobility - Moved from different county within same state (%) - American Indian and Alaska Native
Geographical mobility - Moved from different county within same state (%) - Multirace
Geographical mobility - Moved from different county within same state (%) - Other Race
Geographical mobility - Moved from different state (%)
Geographical mobility - Moved from different state (%) - White
Geographical mobility - Moved from different state (%) - Black or African American
Geographical mobility - Moved from different state (%) - Asian
Geographical mobility - Moved from different state (%) - Hispanic or Latino
Geographical mobility - Moved from different state (%) - American Indian and Alaska Native
Geographical mobility - Moved from different state (%) - Multirace
Geographical mobility - Moved from different state (%) - Other Race
Geographical mobility - Moved from abroad (%)
Geographical mobility - Moved from abroad (%) - White
Geographical mobility - Moved from abroad (%) - Black or African American
Geographical mobility - Moved from abroad (%) - Asian
Geographical mobility - Moved from abroad (%) - Hispanic or Latino
Geographical mobility - Moved from abroad (%) - American Indian and Alaska Native
Geographical mobility - Moved from abroad (%) - Multirace
Geographical mobility - Moved from abroad (%) - Other Race
Place of birth for the foreign-born population - Ireland (%)
Place of birth for the foreign-born population - Denmark (%)
Place of birth for the foreign-born population - Norway (%)
Place of birth for the foreign-born population - Sweden (%)
Place of birth for the foreign-born population - United Kingdom (%)
Place of birth for the foreign-born population - England (%)
Place of birth for the foreign-born population - Scotland (%)
Place of birth for the foreign-born population - Other Northern Europe (%)
Place of birth for the foreign-born population - Austria (%)
Place of birth for the foreign-born population - Belgium (%)
Place of birth for the foreign-born population - France (%)
Place of birth for the foreign-born population - Germany (%)
Place of birth for the foreign-born population - Netherlands (%)
Place of birth for the foreign-born population - Switzerland (%)
Place of birth for the foreign-born population - Other Western Europe (%)
Place of birth for the foreign-born population - Greece (%)
Place of birth for the foreign-born population - Italy (%)
Place of birth for the foreign-born population - Portugal (%)
Place of birth for the foreign-born population - Spain (%)
Place of birth for the foreign-born population - Other Southern Europe (%)
Place of birth for the foreign-born population - Albania (%)
Place of birth for the foreign-born population - Belarus (%)
Place of birth for the foreign-born population - Bosnia and Herzegovina (%)
Place of birth for the foreign-born population - Bulgaria (%)
Place of birth for the foreign-born population - Croatia (%)
Place of birth for the foreign-born population - Czechoslovakia (%)
Place of birth for the foreign-born population - Hungary (%)
Place of birth for the foreign-born population - Latvia (%)
Place of birth for the foreign-born population - Lithuania (%)
Place of birth for the foreign-born population - North Macedonia (Macedonia) (%)
Place of birth for the foreign-born population - Moldova (%)
Place of birth for the foreign-born population - Poland (%)
Place of birth for the foreign-born population - Romania (%)
Place of birth for the foreign-born population - Russia (%)
Place of birth for the foreign-born population - Serbia (%)
Place of birth for the foreign-born population - Ukraine (%)
Place of birth for the foreign-born population - Other Eastern Europe (%)
Place of birth for the foreign-born population - China (%)
Place of birth for the foreign-born population - Hong Kong (%)
Place of birth for the foreign-born population - Taiwan (%)
Place of birth for the foreign-born population - Japan (%)
Place of birth for the foreign-born population - Korea (%)
Place of birth for the foreign-born population - Other Eastern Asia (%)
Place of birth for the foreign-born population - Afghanistan (%)
Place of birth for the foreign-born population - Bangladesh (%)
Place of birth for the foreign-born population - India (%)
Place of birth for the foreign-born population - Iran (%)
Place of birth for the foreign-born population - Kazakhstan (%)
Place of birth for the foreign-born population - Nepal (%)
Place of birth for the foreign-born population - Pakistan (%)
Place of birth for the foreign-born population - Sri Lanka (%)
Place of birth for the foreign-born population - Uzbekistan (%)
Place of birth for the foreign-born population - Other South Central Asia (%)
Place of birth for the foreign-born population - Burma (%)
Place of birth for the foreign-born population - Cambodia (%)
Place of birth for the foreign-born population - Indonesia (%)
Place of birth for the foreign-born population - Laos (%)
Place of birth for the foreign-born population - Malaysia (%)
Place of birth for the foreign-born population - Philippines (%)
Place of birth for the foreign-born population - Singapore (%)
Place of birth for the foreign-born population - Thailand (%)
Place of birth for the foreign-born population - Vietnam (%)
Place of birth for the foreign-born population - Other South Eastern Asia (%)
Place of birth for the foreign-born population - Armenia (%)
Place of birth for the foreign-born population - Iraq (%)
Place of birth for the foreign-born population - Israel (%)
Place of birth for the foreign-born population - Jordan (%)
Place of birth for the foreign-born population - Kuwait (%)
Place of birth for the foreign-born population - Lebanon (%)
Place of birth for the foreign-born population - Saudi Arabia (%)
Place of birth for the foreign-born population - Syria (%)
Place of birth for the foreign-born population - Turkey (%)
Place of birth for the foreign-born population - Yemen (%)
Place of birth for the foreign-born population - Other Western Asia (%)
Place of birth for the foreign-born population - Eritrea (%)
Place of birth for the foreign-born population - Ethiopia (%)
Place of birth for the foreign-born population - Kenya (%)
Place of birth for the foreign-born population - Somalia (%)
Place of birth for the foreign-born population - Uganda (%)
Place of birth for the foreign-born population - Zimbabwe (%)
Place of birth for the foreign-born population - Other Eastern Africa (%)
Place of birth for the foreign-born population - Cameroon (%)
Place of birth for the foreign-born population - Congo (%)
Place of birth for the foreign-born population - Democratic Republic of Congo (Zaire) (%)
Place of birth for the foreign-born population - Other Middle Africa (%)
Place of birth for the foreign-born population - Egypt (%)
Place of birth for the foreign-born population - Morocco (%)
Place of birth for the foreign-born population - Sudan (%)
Place of birth for the foreign-born population - Other Northern Africa (%)
Place of birth for the foreign-born population - South Africa (%)
Place of birth for the foreign-born population - Other Southern Africa (%)
Place of birth for the foreign-born population - Cabo Verde (%)
Place of birth for the foreign-born population - Ghana (%)
Place of birth for the foreign-born population - Liberia (%)
Place of birth for the foreign-born population - Nigeria (%)
Place of birth for the foreign-born population - Senegal (%)
Place of birth for the foreign-born population - Sierra Leone (%)
Place of birth for the foreign-born population - Other Western Africa (%)
Place of birth for the foreign-born population - Australia (%)
Place of birth for the foreign-born population - New Zealand (%)
Place of birth for the foreign-born population - Fiji (%)
Place of birth for the foreign-born population - Micronesia (%)
Place of birth for the foreign-born population - Bahamas (%)
Place of birth for the foreign-born population - Barbados (%)
Place of birth for the foreign-born population - Cuba (%)
Place of birth for the foreign-born population - Dominica (%)
Place of birth for the foreign-born population - Dominican Republic (%)
Place of birth for the foreign-born population - Grenada (%)
Place of birth for the foreign-born population - Haiti (%)
Place of birth for the foreign-born population - Jamaica (%)
Place of birth for the foreign-born population - St. Vincent and the Grenadines (%)
Place of birth for the foreign-born population - Trinidad and Tobago (%)
Place of birth for the foreign-born population - West Indies (%)
Place of birth for the foreign-born population - Other Caribbean (%)
Place of birth for the foreign-born population - Belize (%)
Place of birth for the foreign-born population - Costa Rica (%)
Place of birth for the foreign-born population - El Salvador (%)
Place of birth for the foreign-born population - Guatemala (%)
Place of birth for the foreign-born population - Honduras (%)
Place of birth for the foreign-born population - Mexico (%)
Place of birth for the foreign-born population - Nicaragua (%)
Place of birth for the foreign-born population - Panama (%)
Place of birth for the foreign-born population - Other Central America (%)
Place of birth for the foreign-born population - Argentina (%)
Place of birth for the foreign-born population - Bolivia (%)
Place of birth for the foreign-born population - Brazil (%)
Place of birth for the foreign-born population - Chile (%)
Place of birth for the foreign-born population - Colombia (%)
Place of birth for the foreign-born population - Ecuador (%)
Place of birth for the foreign-born population - Guyana (%)
Place of birth for the foreign-born population - Peru (%)
Place of birth for the foreign-born population - Uruguay (%)
Place of birth for the foreign-born population - Venezuela (%)
Place of birth for the foreign-born population - Other South America (%)
Place of birth for the foreign-born population - Canada (%)
Place of birth for the foreign-born population - Other Northern America (%)
Place of birth for the foreign-born population - Other (%)
Latest news about races in Knightdale, NC collected exclusively by city-data.com from local newspapers, TV, and radio stations
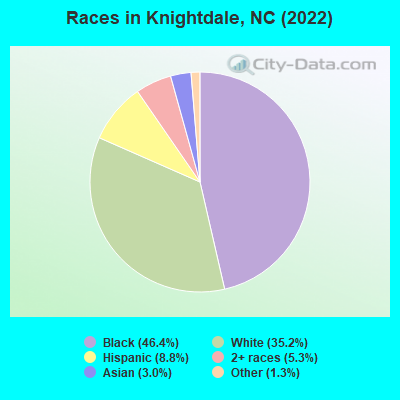
According to 2022 data, the most numerous races in Knightdale, NC are White alone (6,987 residents), Black alone (9,207 residents), and Hispanic (1,742 residents). 86.9% of Knightdale residents speak English at home. 9.7% of Knightdale, NC residents are foreign-born (4.1% born in Latin America, 2.1% born in Asia, 2.0% born in Africa), which is 17.5% greater than the foreign-born rate of 8.0% across the entire state of North Carolina.
Race distribution in Knightdale
2000 2022
5,647,155 70.2% White alone 1,723,301 21.4% Black alone 378,963 4.7% Hispanic 112,416 1.4% Asian alone 95,333 1.2% American Indian alone 79,965 1.0% Two or more races 9,015 0.1% Other race alone 3,165 0.04% Native Hawaiian and Other
6,497,519 60.7% White alone 2,155,650 20.1% Black alone 1,114,799 10.4% Hispanic 438,061 4.1% Two or more races 341,052 3.2% Asian alone 91,758 0.9% American Indian alone 50,180 0.5% Other race alone 9,954 0.09% Native Hawaiian and Other
Income and house value in Knightdale Median household income in 2022 $94,655 White non-Hispanic householders$72,213 Black householders$79,084 Asian householders$101,054 Some other race householders$89,720 Hispanic or Latino race householdersMedian 2022 house value $375,318 White Non-Hispanic householders$368,294 Black or African American householders $351,158 Asian householders$322,503 Some other race householders$307,333 Two or more races householders$340,764 Hispanic or Latino householders
Median age by race in Knightdale
42.1 Median age for White residents39.9 44.4 35.2 Median age for Black or African American residents33.0 37.4 15.0 Median age for American Indian / Alaska Native residents-444,444,444.0 -679,313,459.1 38.0 Median age for Asian residents38.6 30.6 -609,884,331.7 Median age for Native Hawaiian / Pacific Islander residents-611,708,482.1 -612,403,100.2 27.9 Median age for Other race residents26.9 31.1 17.3 Median age for Two or more races residents15.6 17.5 41.5 Median age for White alone residents39.3 44.0 27.2 Median age for Hispanic or Latino residents27.2 27.2
Owner/renter occupied households by race in Knightdale
House owners and renters - White residents 2,381 76.3% Owner occupied739 23.7% Renter occupiedHouse owners and renters - Black or African American residents 2,166 59.9% Owner occupied1,451 40.1% Renter occupiedHouse owners and renters - American Indian / Alaska Native residents 13 100.0% Renter occupiedHouse owners and renters - Asian residents 167 80.2% Owner occupied41 19.8% Renter occupiedHouse owners and renters - Other race residents 152 42.3% Owner occupied208 57.7% Renter occupiedHouse owners and renters - Two or more races residents 186 64.6% Owner occupied102 35.4% Renter occupiedHouse owners and renters - White alone residents 2,331 76.7% Owner occupied709 23.3% Renter occupiedHouse owners and renters - Hispanic or Latino residents 200 48.5% Owner occupied212 51.5% Renter occupied
Language usage in Knightdale
English speakers - Total 86.9% of residents of Knightdale speak English at home.
6.7% of residents speak Spanish at home 923 75.3% Speak English very well303 24.7% Speak English less than very well5.9% of residents speak other language at home 722 67.0% Speak English very well355 33.0% Speak English less than very well
English speakers - Born in the United States 92.6% of residents of Knightdale speak English at home.
5.9% of residents speak Spanish at home 445 100.0% Speak English very well1.4% of residents speak other language at home 108 100.0% Speak English very well
English speakers - Native, born elsewhere 69.4% of residents of Knightdale speak English at home.
28.1% of residents speak Spanish at home 71 58.7% Speak English very well50 41.3% Speak English less than very well
English speakers - Foreign-born 36.7% of residents of Knightdale speak English at home.
22.4% of residents speak Spanish at home 201 44.3% Speak English very well253 55.7% Speak English less than very well40.0% of residents speak other language at home 587 72.6% Speak English very well222 27.4% Speak English less than very well
White (Caucasian) - Speak only English Native:
96.4% (6,268)Foreign-born:
83.0% (166)
White (Caucasian) - Speak another language Native:
3.6% (234)Foreign-born:
27.2% (54)
Black or African American - Speak only English Native:
96.8% (7,339)Foreign-born:
41.6% (380)
Black or African American - Speak another language Native:
3.1% (235)Foreign-born:
49.2% (449)
American Indian / Alaska Native - Speak another language Native:
100.0% (27)Foreign-born:
100.0% (20)
Asian - Speak only English Native:
72.5% (77)Foreign-born:
22.5% (103)
Asian - Speak another language Native:
25.6% (27)Foreign-born:
77.7% (354)
Other race - Speak only English Native:
58.2% (273)Foreign-born:
2.4% (6)
Other race - Speak another language Native:
45.3% (212)Foreign-born:
97.4% (251)
Two or more races - Speak another language Native:
21.0% (353)Foreign-born:
100.0% (239)
White alone - Speak only English Native:
98.5% (6,253)Foreign-born:
80.5% (141)
White alone - Speak another language Native:
1.4% (88)Foreign-born:
20.2% (35)
Hispanic or Latino - Speak only English Native:
41.5% (415)Foreign-born:
5.4% (26)
Hispanic or Latino - Speak another language Native:
56.8% (568)Foreign-born:
94.6% (459)
Foreign-born residents in Knightdale 1,925 residents are foreign born (4.1% Latin America , 2.1% Asia , 2.0% Africa ).
This city:
9.7%North Carolina:
8.3%
Marital status for residents in Knightdale Marital status - White (Caucasian) population 15 years and over
Males 26.2% Never married64.4% Now married1.1% Separated1.4% Widowed6.9% DivorcedFemales 17.0% Never married61.2% Now married1.1% Separated6.3% Widowed14.4% DivorcedWomen who gave birth in the past 12 months Now married:
100.0% (80)Unmarried:
0.0% (0)
Women who did not give birth in the past 12 months Now married:
63.4% (992)Unmarried:
36.6% (574)
Marital status - Black or African American population 15 years and over
Males 36.7% Never married50.1% Now married1.4% Separated0.0% Widowed11.8% DivorcedFemales 39.1% Never married34.4% Now married6.2% Separated8.4% Widowed11.9% DivorcedWomen who gave birth in the past 12 months Now married:
43.9% (67)Unmarried:
56.1% (86)
Women who did not give birth in the past 12 months Now married:
40.4% (965)Unmarried:
59.6% (1,422)
Marital status - American Indian / Alaska Native population 15 years and over
Males 100.0% Never married0.0% Now married0.0% Separated0.0% Widowed0.0% DivorcedFemales 48.0% Never married0.0% Now married52.0% Separated0.0% Widowed0.0% DivorcedWomen who did not give birth in the past 12 months Now married:
52.0% (14)Unmarried:
48.0% (13)
Marital status - Asian population 15 years and over
Males 54.1% Never married45.9% Now married0.0% Separated0.0% Widowed0.0% DivorcedFemales 0.6% Never married99.4% Now married0.0% Separated0.0% Widowed0.0% DivorcedWomen who gave birth in the past 12 months Now married:
100.0% (25)Unmarried:
0.0% (0)
Women who did not give birth in the past 12 months Now married:
99.2% (136)Unmarried:
0.8% (1)
Marital status - Other race population 15 years and over
Males 47.6% Never married33.0% Now married0.0% Separated0.0% Widowed19.4% DivorcedFemales 26.0% Never married26.8% Now married15.6% Separated0.0% Widowed31.6% DivorcedWomen who did not give birth in the past 12 months Now married:
42.4% (116)Unmarried:
57.6% (157)
Marital status - Two or more races population 15 years and over
Males 43.0% Never married57.0% Now married0.0% Separated0.0% Widowed0.0% DivorcedFemales 71.7% Never married23.6% Now married2.2% Separated0.7% Widowed1.6% DivorcedWomen who did not give birth in the past 12 months Now married:
18.8% (156)Unmarried:
81.2% (672)
Marital status - White alone, not Hispanic / Latino population 15 years and over
Males 26.2% Never married64.2% Now married1.1% Separated1.4% Widowed7.1% DivorcedFemales 16.4% Never married62.4% Now married1.2% Separated6.6% Widowed13.4% DivorcedWomen who gave birth in the past 12 months Now married:
100.0% (81)Unmarried:
0.0% (0)
Women who did not give birth in the past 12 months Now married:
64.1% (964)Unmarried:
35.9% (540)
Marital status - Hispanic or Latino population 15 years and over
Males 53.3% Never married34.8% Now married0.0% Separated0.0% Widowed11.9% DivorcedFemales 43.0% Never married34.6% Now married2.1% Separated0.0% Widowed20.3% DivorcedWomen who did not give birth in the past 12 months Now married:
31.1% (159)Unmarried:
68.9% (352)
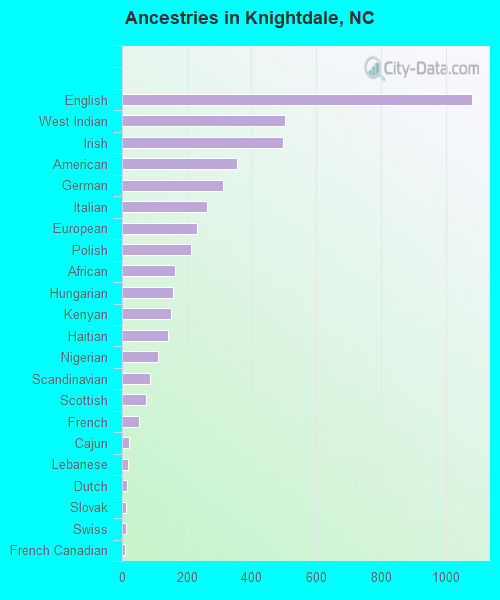
Ancestries in Knightdale
1,080 9.0% English505 4.2% West Indian498 4.1% Irish356 3.0% American313 2.6% German263 2.2% Italian233 1.9% European214 1.8% Polish165 1.4% African159 1.3% Hungarian150 1.2% Kenyan143 1.2% Haitian111 0.9% Nigerian87 0.7% Scandinavian73 0.6% Scottish51 0.4% French22 0.2% Cajun20 0.2% Lebanese16 0.1% Dutch13 0.1% Slovak13 0.1% Swiss10 0.08% French Canadian2 0.02% Scotch-Irish
Children Nativity (place of birth) in Knightdale
Children under 6 years - Living with two parents Both parents native 833 100.0% NativeBoth parents foreign-born 71 100.0% NativeOne native, one foreign-born parent 215 100.0% NativeChildren under 6 years - Living with one parent Native parent 461 100.0% NativeForeign-born parent 56 100.0% NativeChildren 6 to 17 years - Living with two parents Both parents native 1,657 100.0% NativeBoth parents foreign-born 141 63.7% Native80 36.3% Foreign-bornOne native, one foreign-born parent 500 100.0% NativeChildren 6 to 17 years - Living with one parent Native parent 703 100.0% NativeForeign-born parent 146 52.0% Native135 48.0% Foreign-born
Grandparents responsible for own grandchildren in Knightdale
Grandparents (30 to 59 years) White / Caucasian 54 100.0% Not responsible for grandchildrenBlack or African American 59 69.3% Responsible for grandchildren26 30.7% Not responsible for grandchildrenTwo or more races 4 100.0% Not responsible for grandchildrenWhite alone, not Hispanic / Latino 54 100.0% Not responsible for grandchildrenGrandparents (60 years and over) White / Caucasian 16 100.0% Not responsible for grandchildrenBlack or African American 101 80.4% Responsible for grandchildren25 19.6% Not responsible for grandchildrenWhite alone, not Hispanic / Latino 17 100.0% Not responsible for grandchildren